Short Report
Printed in Brazil - ©2016 Sociedade Brasileira de Química0103 - 5053 $6.00+0.00*e-mail: jcasleon@uis.edu.co
Orientation of Pterin-6-Carboxylic Acid on Gold Capped Silicon Nanopillars Platforms:
Surface Enhanced Raman Spectroscopy and Density Functional Theory Studies
John J. Castillo,*,a Ciro E. Rozo,b Linda Bertel,c Tomas Rindzevicius,d Stelia C. Mendez-Sanchez,a Fernando Martínez Ortegac and Anja Boisend
aGrupo de Investigación en Bioquímica y Microbiología, GIBIM, Escuela de Química, Universidad
Industrial de Santander, Bucaramanga, Colombia
bGrupo de Investigaciones Ambientales para el Desarrollo Sostenible, Facultad de Química
Ambiental, Universidad Santo Tomas, Floridablanca, Colombia
cCentro de Investigaciones en Catálisis, Universidad Industrial de Santander, Guatiguará,
UIS km 2 via Refugio, Piedecuesta, Colombia
dDepartment of Micro and Nanotechnology, Technical University of Denmark, Lyngby, Denmark
The orientation of pterin-6-carboxylic acid on gold nanopillars was investigated by surface enhanced Raman spectroscopy and density functional theory methods. The experimentally vibrations from pterin-6-COOH free and attached to the Au surface display vibration features indicating chemical interaction of the pterin with the metal surface. The spectral feature evidenced that the pterin would adsorb on gold surface with a “lying down” configuration through the high intensity vibration of NH scissoring and rocking OH modes. The orientation study of pterins on gold nanopillars presented herein is believed to lead to new applications in biosensing field for detecting pterins of physiological importance.
Keywords: SERS, gold nanopillar, pterin-6-carboxylic acid, DFT
Introduction
Surface enhanced Raman spectroscopy (SERS) are among the most widely spectroscopic techniques used for understanding the adsorption and orientation behavior of molecule on nanoscale metal surface.1-3 Furthermore, the
fluorescence background displayed for some biomolecules is reduced when they are adsorbed on metal surfaces and, thus, the technique is useful in the study of biological samples. It is well known that SERS involve two mechanisms based on chemical and electromagnetic effects which allow a huge spectral enhancement as well as enough information of the adsorbed species.
Over the past decade, the interest for the synthesis and fabrication of new colloid metal nanoparticles and solid support based SERS substrates was increased and this has led to the detection at trace levels of different compounds.4
SERS substrates can be divided into two groups, (i) colloid metal nanoparticles5 and (ii) roughened metallic surfaces.6
The main limitation in using colloid metal nanoparticles is the tendency for nanoparticle conglomeration after the addition of the analyte which often leads to poor reproducibility of the SERS spectra.7 An ideal SERS
substrate must have sufficient Raman signal enhancement to be able to detect the analyte while, at the same time, having a homogenous surface able to produce reproducible Raman spectra.8 Various methodologies for fabrication of SERS
substrates using e-beam lithography,9 anodized aluminum
oxide templates10 and nanoimprinting11 have been reported.
Recently, we have developed a new and simple maskless lithography method to produce flexible, free standing gold-capped nanopillar (Au NP) structures suitable for molecular detection at ultra-low concentrations.12,13
Numerous SERS experiments have been reported to study the orientation and adsorption mechanisms of molecules on SERS active substrates employing both quantum calculations and Raman scattering experiments. Wu et al.14 reported the chemical effects that arise between
on para-substituted benzenethiols using SERS on gold nanoclusters.15 By employing SERS and electronic
structure methods Geetha et al.16 studied the orientation
of 1,4-dimethoxy-3-bromomethylanthracene-9,10-dione on silver nanoparticles.
SERS has been widely employed to elucidate information about the changes in the orientation of biomolecules due to the increase in the Raman scattering intensity by several orders of magnitude which are important to fabricate effective analytical tools. Stokes et al.17 reported
the detection of folic acid (FA) in urine samples using silver nanoparticles. In a similar approach a novel SERS binary substrate of graphene oxide was developed for ultrasensitive detection of FA.18
Pterins are a class of metabolites composed of a pteridine ring system with a keto group and an amino group on positions 4 and 2, respectively. Pterins are involved in a wide range of living systems and can participate in relevant biological functions.19 Detection of
5,6,7,8-tetrahydrobiopterin (BH4) in the urine of newborns is important for the study of folates deficiencies which can induce irreversible neurological damage.20 Pteridinic
derivatives, such as pterin (PT) and pterin-6-carboxylic acid (Pt6C) are present in plasma, urine and other body fluids and the change in its normal concentrations is a valuable analytical signal for the diagnostics of various diseases.
Even though the SERS spectra of pterins have been investigated experimentally both on gold and silver nanoparticles,19,21 to the best of our knowledge there are no
previous reports of the orientation studies and computed vibrational frequencies of pterins in metallic surfaces nanostructured.
In this study we examine the adsorption of Pt6C on gold metal nanostructures using SERS and density functional theory (DFT) calculations. In order to investigate the binding of Pt6C to nanostructured Au, SERS active Au NP substrates were utilized. The DFT method was employed to obtain vibrational spectra of free Pt6C and Pt6C bound to a cluster of ten gold atoms (Au10). The presented study is an explorative step towards the fabrication of a detection system that is capable of sensing deficiencies of pterins in body fluids of newborns.
Experimental
Measurement tools and techniques
Raman scattering and SERS measurements were performed using a Horiba scientific LabRam HR evolution (Yobim Yvon, USA) with an acquisition range of 50-4000 cm-1. A 785 nm laser excitation with powers of up
to 25 mW and a diffraction grating of 600 lines mm-1 was
used. Raman scattering spectrum of solid state Pt6C was collected using a 10× long working distance objective and the acquisition time was 30 s for 1 accumulation. 6PtC SERS spectra were recorded using a 10× long working distance objective, 0.1 mW laser power and 5 s signal accumulation times. The power density was kept ca. 12 kW cm-2 at the
sample to minimize photoinduced and thermal effects.12
Fabrication of SERS active Au NP substrates
The substrates were fabricated employing reactive ion etching of Si and gold metal deposition processes yielding vertical free standing gold-capped silicon nanopillar structures (Au NP) surrounded by a continuous gold film at the base of the pillars.13,22 The obtained Au NP density
is approximately 18 pillars µm-2. Au NP dimensions are
the following: Au NP height ca. 600 nm, Si pillar width ca. 50 nm, Au cap height and width are ca. 300 and 120 nm, respectively (see Supporting Information section). All fabricated Au NP structures were stored in a desiccator and utilized within 3 days to minimize any effects related to oxidation of the Au surface.
Preparation of pterine-6-carboxylic acid solutions
6PtC was obtained from Sigma-Aldrich Corp (USA). All chemicals used in this study were of analytical grade. Pt6C was dissolved in water with an addition of 250 µL of NaOH (0.1 mol L-1) due to the poor solubility of Pt6C. The
Pt6C powder (0.029 g) was mixed with H2O (25 mL) and
magnetically stirring until the yellow color became clear.
SERS measurements
A droplet (ca. 1 µL) of a freshly prepared Pt6C solution was deposited on the SERS active substrates and left to dry. The droplets spread over the whole Au NP surface area (5 × 5 mm2) in several minutes to ensure homogeneity in the
surface coverage and to achieve a suitable time of adsorption equilibrium and thus avoid any change of the desorption of Pt6C. Before every SERS measurement Au NP-Pt6C were gently rinsed with Milli-Q water and dried with nitrogen flow to remove the non-adsorbed Pt6C. The Raman scattering signal was recorded over an area of ca. 0.05 mm2 with
17 and 11 µm, x and y step sizes, respectively.
Computational methods
calculated using DFT method with B3LYP functional23,24
combined with the standard 6-31G(2d,p)25 basis set. The
calculated frequencies were scaled by a factor of 0.9614 in accordance with previous results reported26 with the purpose
to correct for systematic errors. A cluster of Au atoms was chosen as a model system for the Au NP structures. In order to decrease the high computational demands for larger clusters and to have a surface cluster with enough dimensions to interact with Pt6C, a cluster of 10 Au atoms (Au10) was selected and proven to be a good candidate for simulating the Au-Pt6C SERS spectrum. The Au10 cluster was planar and large enough to cover a representative part of Pt6C, see the inset in Figure 1b. The interaction between Pt6C and Au10, the Au10-Pt6C geometry optimization and the Raman spectra were computed using the scalar relativistic effective core potential (ECP) with double-zeta basis sets (LANL2DZ).26 Validation of DFT for the
calculation of gold cluster has been studied by Li et al.27
and DFT methods have been used successfully to optimize the structures and assign all vibrational bands and predict frequencies and energies of molecule-metal complexes.28
The calculations were carried out using the GAUSSIAN 09 software package.29
Results and Discussion
Raman spectra of Pt6C
To the best of our knowledge the SERS spectra of pterins has been studied experimentally on gold and silver colloids nanoparticles and the literature has not discussed orientation, adsorption studies and computed vibrational frequencies of Pt6C in gold surfaces nanostructured. The assignment of Raman bands of pterins in a previously reported study was incomplete19,21 and a deeper analysis of
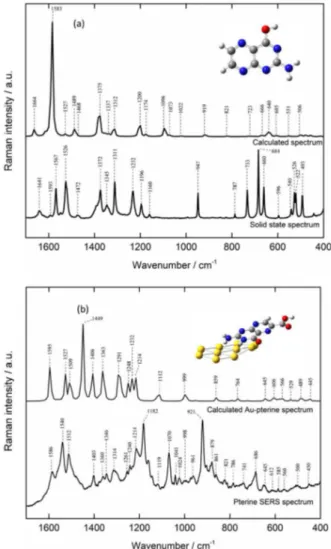
all vibrational modes of Pt6C is warranted. In the following paragraph, the complete assignment of the Raman bands of Pt6C is presented using both experimental and theoretical spectra (see summarized data in Table 1). The optimized structure of the free Pt6C is depicted in the inset of Figure 1. In Figure 1a calculated and experimental Raman scattering spectra of Pt6C are compared. The inset in Figure 1a shows the optimized structure of the Pt6C molecule. The calculated normal mode wavenumber of Pt6C in Figure 1a shows a set of intense peaks that can also observed experimentally (ca. 1600-1200 cm-1). The most intense experimentally
observed bands are N−H and C−H rocking vibrations (ρ(NH)(CH)) at 1526 cm-1 and NH
2 wagging vibrations at
1311 and 1160 cm-1. These calculated wavenumbers are in
agreement with the experimental wavenumbers recorded and in concordance with previous report about in situ
detection of pterinson Au and Ag nanoparticles.21 A group
of medium intensities frequencies located at 1567, 1372 and 1196 cm-1 are associated to ρ(NH), ρ(CH) and ring
deformation from pterin moiety. A set of weak intensity bands at 787, 596 and 540 cm-1 are assigned to the wagging
from NH2 group. A medium intensity band is observed at
947 cm-1 and is attributed to a ring deformation of Pt6C.
The calculated spectrum displays some deviations from the experimental results in the 1000-600 cm-1 region.
A prominent example is the band found at 947 cm-1. The
calculated spectrum displays a weak mode at 919 cm-1 which
primarily derives from the ring deformation of the pterin.
SERS spectra of Pt6C
To have insight into orientation and adsorption behavior of Pt6C on gold capped silicon nanopillars the SERS
spectrum of Pt6C is shown in Figure 1b and the observed vibrational modes and its corresponding assignments are listed in Table 2. The assignment of the experimental SERS bands is based on the observed frequencies and intensity patterns of the experimental spectra of solid state Pt6C.
The presence of new bands and the relative intensification observed in SERS spectra compared to the normal Raman bands suggest an influence and close interaction of the atoms bound to the metal surface. The most intense set of bands present in Pt6C normal Raman spectrum are also found in its SERS spectrum, Figures 1a and 1b. Chemical interaction of the Pt6C molecule with the Au metal surface is evidenced by changes in both relative intensities and the position of the vibrational modes.
In Figure 1b the strongest SERS signals are located at 1540 and 1512 cm-1 which arises mainly from scissoring
from NH2 and ring deformation of pterin moiety. The
SERS peak at 1586 cm-1 from the stretching vibration of
C=O(COOH) is a medium intensity band and it shows the interaction of carboxylic group with the Au surface. The weak SERS signal located around 1403 cm-1 show a
multi-rocking vibration of NH and CH groups and is in a good agreement with the calculated spectra (see Figure 1b). The presence of the rocking vibrations out of the plane of the groups NH2 and OH at 645 cm-1 in the SERS spectrum
further support the assumption that the Pt6C is anchored to the Au surface through a strong interaction with the amino group.
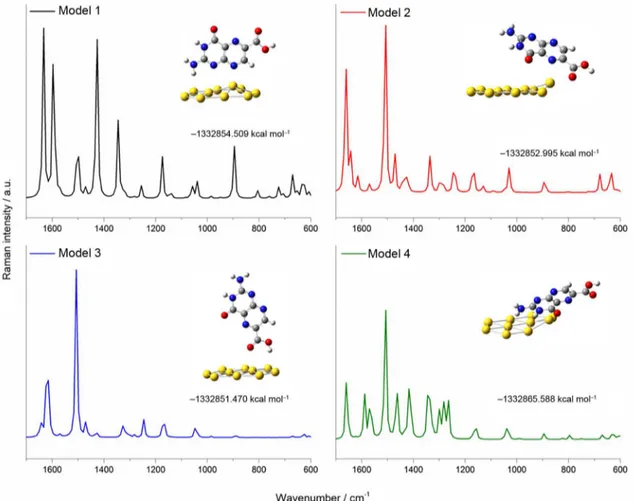
Such changes in the Pt6C SERS spectrum are corroborated by the calculated spectra obtained using the DFT method, Figure 2. Our theoretical study suggests an adsorption model where the Pt6C interacts with the Au atoms primarily through the nitrogen atoms from the amino group as shown in the inset in Figure 1b and the model 4 in Figure 2. In order to further verify the reliability of the above model, we have simulated three additional geometries placing the Au10 cluster at different positions (see Figure 2, models 1, 2 and 3). The simulated SERS spectra from the models 1, 2 and 3 shows a configuration where the amino group is far from the gold surface or the nitrogen from pterin moiety are interacting close together with gold atoms. On the other hand the models 1 and 4 showed the most strong vibration coming from the nitrogen from amino group and also the lowest values of energy, but the model 4 exhibited the lowest energy value
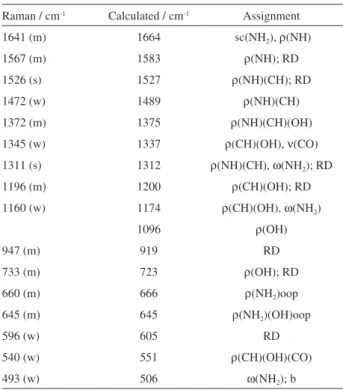
Table 1. Assignment of experimental and calculated Raman modes of the pterine-6-carboxylic acid molecule (solid state)
Raman / cm-1 Calculated / cm-1 Assignment
1641 (m) 1664 sc(NH2), ρ(NH)
1567 (m) 1583 ρ(NH); RD
1526 (s) 1527 ρ(NH)(CH); RD
1472 (w) 1489 ρ(NH)(CH)
1372 (m) 1375 ρ(NH)(CH)(OH)
1345 (w) 1337 ρ(CH)(OH), ν(CO)
1311 (s) 1312 ρ(NH)(CH), ω(NH2); RD
1196 (m) 1200 ρ(CH)(OH); RD
1160 (w) 1174 ρ(CH)(OH), ω(NH2)
1096 ρ(OH)
947 (m) 919 RD
733 (m) 723 ρ(OH); RD
660 (m) 666 ρ(NH2)oop
645 (m) 645 ρ(NH2)(OH)oop
596 (w) 605 RD
540 (w) 551 ρ(CH)(OH)(CO)
493 (w) 506 ω(NH2); b
w: weak; m: medium; s: strong; ν: stretching; δ: bending; ρ: rocking;
ω: wagging; sc: scissoring; t: twisting; b: breathing; oop: out of plane; RD: rings deformation of pterin.
Table 2. Assignment of experimental and calculated Raman modes of the pterine-6-carboxylic acid molecule adsorbed on the Au surface
Surface enhanced Raman spectroscopy (SERS) / cm-1
Calculated / cm-1 Assignment
1586 (m) 1595 ν(C=O(COOH)), ρ(OH)
1540 (s) 1527 sc(NH2), ρ(NH)
1512 (s) 1509 ρ(CH); RD
1449 ρ(NH)(CH); RD
1403 (m) 1406 ρ(NH)(CH)(NH2); RD
1360 (w) 1363 ρ(NH); RD
1291 ρ(CH)(OH); RD
1240 (w) 1248 RD
1232 ρ(OH)
1024 (w) 1214 ρ(OH)(CH)(NH2)
1112 (w) 1112 ρ(NH2); b
998 (w) 999 ρ(NH2)oop; RDoop
861 (w) 859 ρ(NH)oop
741 (w) 764 ρ(NH)(OH)oop
645 (m) 645 ρ(CH)(OH)(CO)
612 (w) 606 ρ(OH); b
585 (w) 566 ρ(NH)(OH); b; RD
529 ρ(NH)(OH); b
500 (w) 489 RD; b
450 (w) 445 ρ(NH)(OH); RD
w: weak; m: medium; s: strong; ν: stretching; δ: bending; ρ: rocking;
(E4 = −1332865.588 kcal mol-1) (inset Figure 2, model 4)
confirming thus that the most likely interaction with the Au10 cluster is through the nitrogen of amino group.
After performing the optimization, we find no reliable geometry alternatives as the obtained energy values are higher than the optimized geometry shown in model 4 Figure 2.
The orientation of Pt6C on Au surface was determined on the basis of surface selection rules and it will depend on the active sites through which the interaction takes place. According to this rule, the vibrational mode with the transitional moment perpendicular to the surface should have a large enhancement in Raman peaks. The possible orientation of the Pt6C on the gold surface was lying down on the gold surface through bonding of the aromatic ring and the electron pair of the nitrogen in NH2 group of pterin. Geetha et al.16observed a similar
orientation behavior on an antraquinone derivate adsorbed on silver nanoparticles. The scissoring vibrations from NH2 and ring deformation of pterin are most prominent
in SERS spectra of Pt6C confirming thus the lying down orientation of the pterin on the surface of gold capped silicon nanopillars.
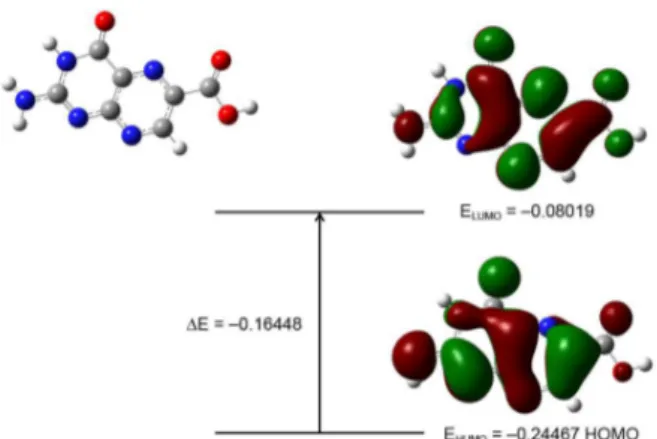
Frontier molecular orbitals
Frontier molecular orbitals (FMOs) play important role in the chemical stability of the molecule.25 The
highest occupied molecular orbital (HOMO) represents the ability to donate an electron while lowest unoccupied molecular orbital (LUMO) stands for an electron acceptor. The HOMO-LUMO energy gap determines a variety of properties including optical polarizability, kinetic stability and chemical hardness-softness of a molecule.26 The
chemical hardness is usually a good indicator of the chemical stability. Hard molecules display a large HOMO-LUMO gap while soft molecules have a small HOMO-LUMO gap. The hardness of a molecule is defined as:25
(1)
where εHOMO and εLUMO are the energies of the HOMO and
LUMO orbitals, respectively.
The HOMO and LUMO energy was calculated using B3LYP/6-31G(d) method, see Figure 3. Results show that the HOMO is located over the all pterine molecule with a HOMO energy (B3LYP) = −0.24467 a.u.
while the LUMO is located in the pterin group except for some hydrogen atoms with a LUMO energy (B3LYP) = −0.08019 a.u. Substituting the values into equation 1 yields η = 0.08224 a.u.which indicates that Pt6C is a soft material. The chemical hardness of Pt6C is close to the physiological pterine FA whose activated form in body showed a reported value of η = 0.08175 a.u.27
Conclusions
The study of the orientation of Pt6C on gold-capped silicon nanopillars is carried out using SERS spectroscopy and DFT calculations. The comparison between SERS and Raman scattering spectra show that the interaction of the Pt6C with the nanostructured gold surface is mainly through the nitrogen of the amino group and the orientation follows a lying down configuration confirmed by the bonding of the aromatic ring and the electron pair of the nitrogen in NH2
group of pterin. This feature was further confirmed by the calculation of the optimized geometry of Pt6C adsorbed to a cluster of ten gold atoms. HOMO and LUMO studies lead us to consider Pt6C as a soft material and chemical hardness value is close to the value exhibited by folic acid. The presented study is an explorative step towards the fabrication of a detection system that is capable of sensing pterins of physiological importance.
Supplementary Information
Supplementary information, including SEM image of the gold-capped silicon nanopillars, is available free of charge at http://jbcs.sbq.org.br as a PDF file.
Acknowledgments
We are grateful for the financial support provided by The Danish Concil for Independent Research’s NAnoPLAsmonic
Sensors (NAPLAS) Sapere Aude project, Universidad Industrial de Santander (Project 1782) and Prof Rafael Cabanzo for helping us in Raman and SERS measurements.
References
1. Harper, M.; McKeating, K.; Faulds, K.; Phys. Chem. Chem. Phys. 2013, 15, 5312.
2. Howes, P.; Rana, S.; Stevens, M.; Chem. Soc. Rev. 2014, 43, 3835.
3. McNay, G.; Eustace, D.; Smith, W.; Faulds, K.; Graham, D.; Appl. Spectrosc. 2011, 65, 825.
4. Sonntag, M.; Klingsporn, J.; Zrimsek, A.; Sharma, B.; Ruvuna, L.; Van Duyne, R.; Chem. Soc. Rev. 2014, 43, 1230. 5. Muniz-Miranda, M.; Pergolese, B.; Muniz-Miranda, F.;
Caporali, S.; J. Alloys Compd. 2014, 615, S357.
6. Wu, Q.; Luo, C.; Yu, H.; Kong, G.; Hu, J.; Chem. Phys. Lett.
2014, 608, 35.
7. Jarvis, R.; Johnson, H.; Olembe, E.; Panneerselvam, A.; Malik, M.; Afzaal, M.; O’Brien, P.; Goodacre, R.; Analyst 2008, 133, 1449.
8. Sharma, B.; Cardinal, M.; Kleinman, S.; Greeneltch, N.; Frontiera, R.; Blaber, M.; Schatz, G.; van Duyne, R.; MRS Bull.
2013, 38, 615.
9. Abu Hatab, N. A.; Oran, J. M.; Sepaniak, M. J.; ACS Nano
2008, 2, 377.
10. Wong-ek, K.; Eiamchai, P.; Horprathum, M.; Patthanasetthakul, V.; Limnonthakul, P.; Chindaudom, P.; Nuntawong, N.; Thin Solid Films 2010, 518, 7128.
11. Kondo, T.; Nishio, K.; Masuda, H.; Appl. Phys. Express2013, 6, 102401.
12. Schmidt, M.; Hübner, J.; Boisen, A.; Adv. Mater. 2012, 24, 11. 13. Wu, K.; Rindzevicius, T.; Schmidt, S.; Mogensen, M.;
Hakonen, K.; Boisen, A.; J. Phys. Chem. C2015, 119, 2053. 14. Wu, D.; Liu, X.; Duan, S.; Xu, X.; Ren, B.; Lin, S.; Tian, Z.;
J. Phys. Chem. C2008, 112, 4195.
15. You, T.; Liang, X.; Gao, Y.; Yin, P.; Guo, L.; Yang, S.; Spectrochim. Acta, Part A 2015, 152, 278.
16. Geetha, K.; Umadevi, M.; Sathe, G.; Vanelle, P.; Terme, T.; Khoumeri, O.; J. Mol. Struct. 2014, 1059, 87.
17. Stokes, R.; McBride, E.; Wilson, C.; Girkin, J.; Smith, E.; Graham, D.; Appl. Spectrosc. 2008, 62, 371.
18. Hu, C.; Liu, Y.; Qin, J.; Nie, G.; Lei, B.; Xiao, Y.; Zheng, M.; Rong, J.; ACS Appl. Mater. Interfaces 2013, 5, 4760.
19. Smyth, C.; Mehigan, S.; Rakovich, Y.; Bell, S.; McCabe, E.; J. Biomed. Opt. 2011, 16, 77007.
20. Tornero, E.; Merás, I.; Espinosa-Mansilla, A.; Talanta 2014, 128, 319.
21. Stevenson, R.; Stokes, R.; MacMillan, D.; Armstrong, D.; Faulds, K.; Wadsworth, R.; Kunuthur, S.; Suckling, C.; Graham, D.; Analyst 2009, 134, 1561.
22. Castillo, J.; Rindzevicius, T.; Wu, K.; Schmidt, M.; Janik, K.; Boisen, A.; Svendsen, W.; Rozlosnik, N.; Castillo-León, J.; J. Nanopart. Res. 2014, 16, 2525.
23. Rassolov, V.; Ratner, M.; Pople, J.; Redfern, P.; Curtiss, L.; J. Comput. Chem.2001, 22, 976.
24. Lee, C.; Yang, W.; Parr, P.; Phys. Rev. B: Condens. Matter 1988, 37,785.
25. Becke, A.; J. Chem. Phys. 1993, 98, 5648. 26. Pearson, G.; Proc. Natl. Acad. Sci. 1986, 83, 8440.
27. Li, L.; Cai, T.; Wang, Z.; Zhai, Z.; Geng, Y.; Sun, T.; Spectrochim. Acta Part A2014, 120, 106.
28. Shi, Y.; Li, Z.; Fan, K.; J. Phys. Chem. A 2010,114,10297. 29. Lang, X.; Yin, P.; You, T.; Jiang, L.; Guo, L.; Chem. Phys. Chem.
2011,12, 2468.
Submitted:October 8, 2015