Potentialities of infrared thermography to assess damage
in bonding between concrete and GFRP
Potencialidades da termograia infravermelha na
avaliação de danos na aderência entre concreto e PRFV
a Programa de Pós-graduação em Engenharia Civil (PPGEC), Universidade Federal de Santa Catarina (UFSC), Florianópolis-SC, Brasil; b Departamento de Engenharia Civil, Universidade Federal de Santa Catarina (UFSC), [email protected], Florianópolis-SC, Brasil.
Received: 20 May 2014 • Accepted: 03 Feb 2015 • Available Online: 12 Jun 2015
Abstract
Resumo
This paper demonstrates the application of the active infrared thermography to detect damage in bonding between concrete and glass iber reinforced
polymer (GFRP). Specimens of concrete and mortar with GFRP externally bonded were prepared and at their interfaces were inserted polystyrene discs to simulate damages. The samples were divided into two groups. In group 1, one sample was correctly bonded by a GFRP plate to the concrete, but in the other three were inserted polystyrene discs which had different diameters to simulate damages in bonding. In group 2, all of the samples contained identical polystyrene discs at their interfaces, but the total thickness of each specimen was different, because the objective was to
evalu-ate the ability of the camera to capture the simulevalu-ated damage in depth. The experimental procedure was divided into two stages. In the irst stage,
four types of heating were used to heat samples of group 1: incandescent lamp, kiln, blended lamp and fan heater. Thus, it was possible to detect the damage and to observe its format and length. It was noticed that the infrared images are different depending on the heat source incident on the
specimen. Therefore, group 2 was tested only for the more eficient heating (incandescent lamp). In the second stage, the infrared equipment was tested. Some of the parameters that must be inserted in the camera were varied in order to understand their inluence on image formation. The results
show the effectiveness of infrared thermography to assess adherence in GFRP/concrete interface. In the present work, the best results were obtained when the image is captured towards GFRP/concrete and using incandescent lamp. It was observed that the image and measured temperature suffer
signiicant distortion when a false value was inserted for the parameter emissivity.
Keywords: infrared termography, non destructive test, concrete, frp, debonding.
Para demonstrar a potencialidade da aplicação da técnica da termograia infravermelha ativa para detecção de danos na aderência entre concreto e polímero reforçado com ibra de vidro (PRFV), são utilizados neste trabalho corpos de prova de concreto e argamassa colados externamente com
PRFV, em cuja interface foram inseridos discos de EPS (poliestireno expandido) para simular danos. Os corpos de prova foram divididos em dois
grupos. No grupo 1, em uma das amostras, a chapa de PRFV estava totalmente aderida ao concreto, nas outras três foram inseridos discos de EPS de diferentes diâmetros para simulação de regiões com falha de aderência. No grupo 2, todos os corpos de prova continham idênticos discos de
EPS na interface, porém a espessura total de cada corpo de prova era diferente, pois o objetivo foi avaliar a capacidade da câmera em alcançar o
dano simulado. O procedimento experimental dividiu-se em 2 etapas. Na primeira, foram utilizados 4 tipos de aquecimento para o grupo 1: lâmpada
incandescente, estufa, lâmpada de mercúrio de alta pressão e termoventilador. Assim, foi possível detectar o dano e observar seu formato e exten-são. Notou-se uma diferenciação das imagens devido à fonte de calor incidente no corpo de prova e por isso, o grupo 2 foi testado apenas para o
aquecimento mais eiciente (lâmpada incandescente). Na segunda etapa, a câmera termográica foi posta em evidência. Alguns dos parâmetros de ajuste que devem ser nela inseridos foram variados a im de entender suas inluências na formação da imagem e consequentemente na identiicação do dano. Os resultados revelam a eiciência da termograia infravermelha para avaliar a aderência na interface concreto/PRFV. Neste trabalho, os melhores resultados foram obtidos quando a imagem foi captada para uma amostra aquecida no sentido PRFV/Concreto por lâmpada incandescen
-te e para quando são inseridos na câmera infravermelha os parâmetros corretos, especialmen-te a emissividade térmica.
Palavras-chave: termograia infravermelha, ensaios não destrutivos, concreto, polímero reforçado com ibras, danos na aderência.
M. M. CALDEIRA a [email protected]
I. J. PADARATZ b
1. Introduction
The combination of Glass Fibres Reinforced Polymer (GFRP) and concrete has gained increasingly attention in Civil Engineering by joining lightness and strength [1]. This application has been espe-cially used as structural reinforcement.[2].
One of the main factors that inluence the total strength of this ar -rangement is the correct adherence of the interface between these two materials once the right connection between FRP and
con-crete allows they work as an unit. [3]. Therefore, quality of interface adherence is needed and if a law is detected it must be localized and characterized[4].
A defect caused by incorrect adherence of FRP can only appear after bonding the polymer to a concrete surface. So, in order to
de-tect laws, the inspection has to identify it through the FRP. A quick,
practical and possible solution is the use of a non destructive test known as infrared thermography [5][6].
Thus, the main objective of this paper is the evaluation of defects at FRP/concrete interface using the active infrared thermography.
To do this, a qualitative analysis will be used and it will compare dif -ferent thermal excitations and dif-ferent defect positions (related to depth). Also, the behaviour of the thermal images will be evaluated when the infrared camera parameters are not correctly adjusted. Related to this topic, there is still a lack of research and so this paper intends to contribute to new experimental results and also compare them to previous works.
2. Infrared thermography and detection
of defects at FRP/concrete interface
by thermal excitation
There are already researches that present the infrared
thermogra-phy as an eficient technique to evaluate defects at FRP/Concrete interface. One of them[7] uses water and air-illed debonds in dif
-ferent sizes. These simulated laws were placed underneath the layer of the polymer and then samples were heated by two quartz
tower heaters for 70 seconds. Some minutes after heating the
im-ages were captured. The results present the artiicial defects quite
evidently (shown up as “hot-spots”) when the thermal images were analysed. So, the effectiveness of the method was proved.
Another paper [8] analyses different types of artiicial laws such as: timber, steel, Telon and cork. The tests were performed consider
-ing two types of thermal excitation. Firstly, two photographic lashes
were used adopting a duration pulse of 10 milliseconds and the
fre-quency was set to 22Hz. Afterwards, two halogen lamps were used
and they heat the area for 10, 30 and 60 seconds. Comparing the types of heating, the thermal contrast is not evident when the ther-mal excitation is made by short pulses. According to the authors, this could be improved if the sample surface had a more homogeneous thermal emissivity. On the other hand, heating an area using the hal-ogen lamps showed a better contrast in the infrared image because, in this case, more thermal energy was provided to the sample’s sur-face, if compared to the previous thermal excitation.
Another experimental work [9] evaluates different types of thermal excitation when applied infrared thermography. In this case, indi-vidual samples of composite material were subjected to infrared thermography in order to detect internal damages when exposed to impact. It was concluded that the convective heating presents
more effective results than incandescent lamps.
Like other scientiic works previously cited, it is possible to notice
the importance of choosing the type of heating when active infrared thermography inspections are performed in FRP, and therefore this is one of the issues which will be discussed in the present paper.
3. The thermal image formation and the
inluence of the inserting parameters
in the infrared camera
The inluence of the parameters which have to be inserted in the
infrared camera is another important factor which also interferes in the infrared image formation, once these are the data that allow the temperature calculation and the adjustment of thermal image [10].
Thus, it is necessary to understand how this equipment works in
order to study its calibration parameters.
The infrared camera is restricted to the infrared spectral band and its operation is based on the detection of infrared radiation emitted by bodies which forms “thermal images”. This camera detects ex-clusively radiant thermal energy from bodies’ surfaces, so it does
not detect the relected visible light, which means that the thermal
images can be obtained even in total darkness.
If the camera is pointed to an object, it receives emitted radiation from the object’s surface and from the environment adjacent to the body. Both are attenuated by atmosphere before they reach the camera. The camera receives also a third contribution: radiation emitted from the atmosphere, as Figure 1 illustrates
.
Figure 1 illustrates the total radiation potency that the camera re-ceives (Wtot).
So:
(1)
Wtot =
et
Wobj + (1 -
e
)
t
Wrefl + (1 -
t
) Watm
Wtot: Total potency [W]
Wobj: Potency of radiation emitted by object [W]
Wrel: Potency of radiation emitted by adjacent environment [W]
Watm: Potency of radiation emitted by atmosphere [W]
ε : Object’s emittance [no unity]
τ: Atmosphere transmittance [no unity]
So, in order to better analyse the infrared thermography inspec-tions when considered defects at FRP/concrete interface, it is nec-essary to study some parameters which are inserted in the infrared camera such as: thermal emissivity, distance from the lens to the object, and temperature and humidity of the environment.
In relation to this subject, scientiic works are more focused on
evaluation of thermal emissivity. One of these works [11] surveyed
The scientiic works previously cited demonstrate the relevance of
the study of the parameters that must be inserted into the infrared
camera. However, it is noteworthy that, despite the extensive liter -ature research carried out, no parametric studies of these param-eters were found and so this is one of the purposes of this work. Therefore, this article presents also an unprecedented contribution to the study of the parameters to be inserted into the infrared cam-era, assisting in the extension and deepening of this subject.
4. Materials and experimental program
4.1 Characteristics of the samples
Samples were divided in two different groups: group 1 and group 2. Group 1 consists of four concrete samples whose dimensions were 26.0 x 13.0 cm and 9.0 cm of thickness. In one of the faces of the samples a GFRP sheet (15.0 x 13.0 cm and 0.635 cm of thickness) was adhered by epoxy resin. Only in one sample of group one, the GFRP sheet was totally adhered to the concrete whereas in the remaining three thin polystyrene discs were inserted underneath the GFRP sheet to simulate a debonding. These discs had differ-ent diameters for each sample: 2, 6 and 10 cm.
Group two consists of six samples of 15.0 x 13.0 cm. Each sample had different thicknesses: 7, 6, 5, 4, 3 and 2 cm. A GFRP sheet of 15.0 x 13.0 and 0.635 cm of thickness was bonded at one of the samples surface. All of them had a thin polystyrene disc of 3 cm diameter underneath GFRP sheet as shown in Figure 3.
An epoxy resin was applied to bond the GFRP to the concrete sur-face, except in the area of the polystyrene disc. All samples were at an age greater than 180 days when tested and at this age the heat
of hydration does not inluence their temperatures [13].
Figure 1 – Schematic representation of a thermographic measurement. 1) adjacent ambient,
2) object, 3) atmosphere, 4) camera. Tobj: object's temperature, Trefl: reflected temperature,
Tatm: atmosphere temperature (room temperature). Wobj: radiation potency emitted by object,
Wrefl: radiation potency emitted by adjacent ambient, Watm: radiation potency emitted
by atmosphere [17]
4.2 Samples heating
Before capturing infrared images, samples were subjected to pre-vious heating. The type of heating was: kiln, incandescent lamp (200 Watts), high-pressure sodium lamp (250 Watts) and convec-tion heater (1500 Watts).
Samples were placed in kiln for 24 hours at 32° C. However, con -sidering the heating by lamp (incandescent lamp or high-pressure sodium lamp) the front surface of samples was positioned perpen-dicular to the lamp, which was 12 cm above the sample, for 5 min-utes. The convection heater was placed 14 cm from the front face of the specimen which was heated for 6 minutes. It is important to note that the convection heater was not perpendicular to the central point of simulated damage because the heat concentration
does not occur in the centre of the appliance. For each new heat-ing, a rest period of 24 hours was provided so that the specimens
could reach a thermal equilibrium condition with the ambient and
thus they could be subjected again to another heating heat source. In group 1, infrared images were captured towards GFRP-con-crete, but in group two, images were captured towards concrete-GFRP, one minute after removing the heat source in both cases. After testing the different types of heating to group one, results showed that when samples were heated by incandescent lamp, the best infrared images were obtained. So, this kind of heating was used to test samples of group two.
An infrared camera was used to capture the images. This device
was a FLIR B400, speciic for inspection buildings, available on
Non Destructive Research Group (GPEND) at Federal University of Santa Catarina.
4.3 Parameters of infrared camera
In order to evaluate the parameters which must be inserted in the cam-era, the samples of group one were used and they were heated by incandescent lamp. In this case, the temperature and humidity of the environment were set according to the weather forecast of Florianópolis
–SC, Brazil, on the day and time of the experiment, as shown in Table 1.
In order to calibrate thermal emissivity, the procedures recom-mended by the camera manufacturer’s manual were adopted. As thermal emissivity of materials considered in this experiment are height and the ambient is not subjected to strong heat sources,
the parameters of “Relected Apparent Temperature” does not in
-luence the inal result and so it does not need to be set. The value
inserted was 20°C.
Table 1 also shows the measured values of the parameters, i.e. the values of ambient temperature, humidity, distance from lens to object and emissivity which were obtained in the moment of the experiment. The measured values are named “real values” or “real parameters”.
Afterwards, the variation of parameters which will be inserted in
the camera was deined so that the difference between images
(or temperatures) captured when included real or false parameters could be observed.
Tables 2 to 5 present how the parameters were varied and which were the values inserted in the camera, for each case. It was noted that the distance from lens to object is the only parameter which can be varied considering the “real value”, and so two different distances were adopted: 1m and 5 m.
While one parameter was varied, the other parameters were set to the real measurements. In case of distance from lens to object the standard adopted was 1 m distance.
Figure 3 – Samples of group 2
(measurement in cm)
Table 1 – Real values (or measured values)
of parameters
Parameters Measured values
Temperature 17°C
Relative air humidity 64% Thermal emissivity 0.96
Distances lens-object 1m 5m
Table 2 – Real value and variations
of room temperature
Room temperature (°C)
Variations
0% 30% 60% 100% 150% 200%
17 22.1 27.2 34.0 42.5 51.0
Table 3 – Real value and variations
of thermal emissivity
Thermal emissivity
Variations
0% -30% -60% -90%
The infrared images were captured for each sample of group 1, for each variation of parameter, after being heated by incandescent lamp located 12 cm distant from the surface sample, for 5 min-utes. In this case, a special function of the camera which allows the measurement of one point in the image was used. The chosen
point was the centre of the artiicial defect.
If one parameter is varied, it is expected a different result (or a
different infrared image). However, a careful analysis is needed
because when the heating stops the natural tendency is that the
temperature of the sample decreases to reach the thermal equi -librium. Thus, the analysis must not consider this decrease as an error caused by the insertion of false parameter. To solve this
prob-lem, the capture of infrared images followed the next sequence: irstly, images were captured when inserted real parameters, then images were captured setting false parameters and inally images
were captured again when inserted the real parameters.
Despite the short period of time between the irst and the second
measurement (less than 1 minute), the sample still loses heat be-cause of its thermal properties. So, recording the infrared image
using real parameters twice (irst and last image recorded) indi -cates whether the decrease of temperature is related to the setting of parameters or not.
Scientiic studies already proves the eficiency of infrared thermog
-raphy to detect laws at FRP/concrete interface[14][15][16]. How
-ever, this article analyses this subject even deeper providing re-sults of an assessment for different types of heating and evaluates the infrared image for different situations, as it will be shown next.
5. Results and discussion
5.1 Samples of group 1
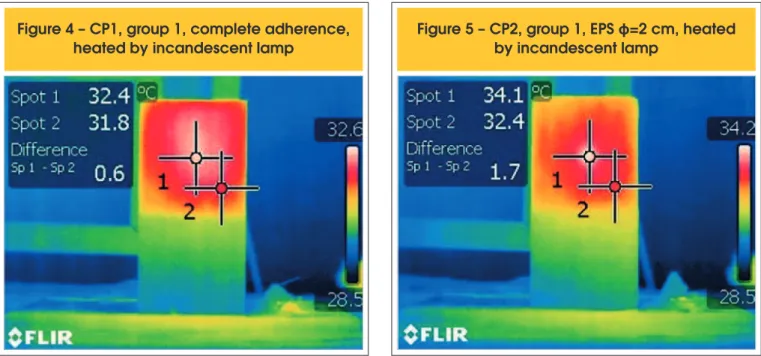
The infrared images captured for samples of group 1, after heating using incandescent lamp (Figures 4 to 7), show clearly the location
and shape of the artiicial defect. It is important to note that the dif -ference of temperature between the location of the defect and the sound area increases as the defect becomes greater.
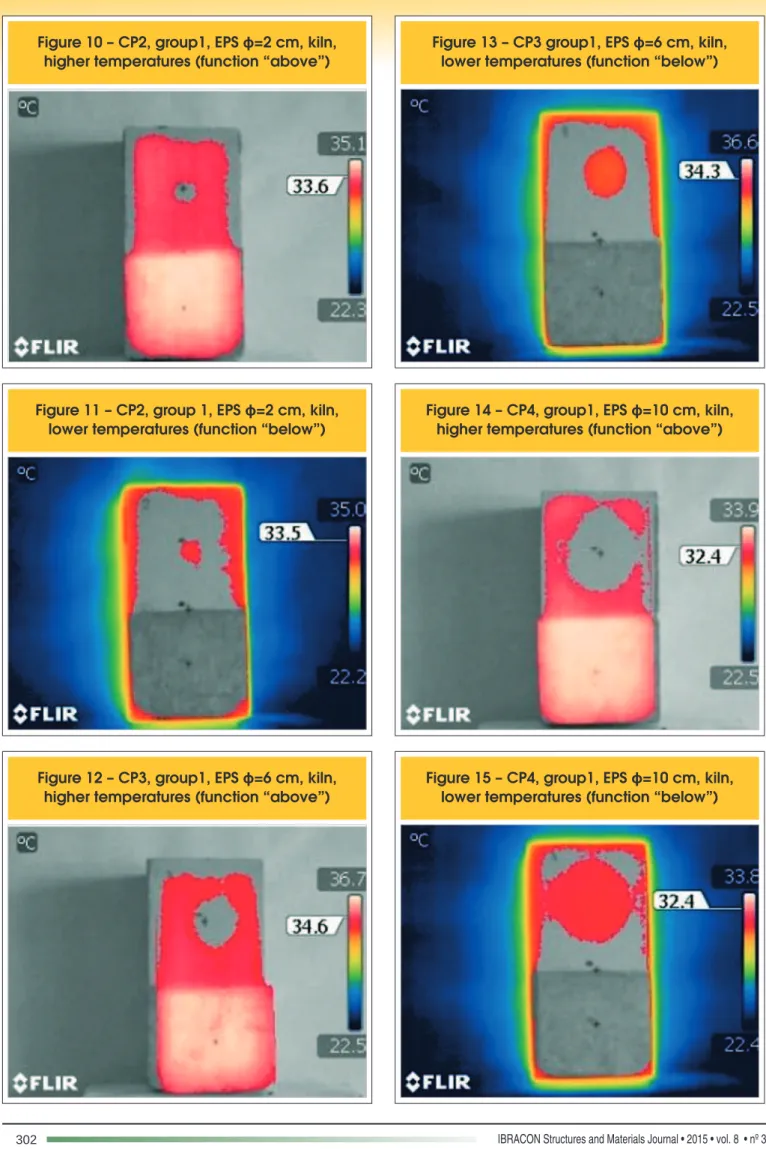
When the kiln was used to heat the same samples, it was not so easy to observe the defects in infrared images and so, two spe-cial camera functions named “above” and “below” were used. At the moment the samples were removed from kiln two images
were captured: the irst one shows in infrared only temperatures above the temperature marked in the white square (on the right
of image) and the second one present the lower temperatures, as shown in Figures 8 to 15. In this case, the defect is visible, but not as visible as when samples were heated by incandes-cent lamp.
Table 4 – Real value and variations of relative
air humidity
Relative air humidity (%)
Variations
0% +30% -30% -60% -90%
64 83 45 26 6
Table 5 – Real values and variations
of distance lens-object
Distance lens-object (m)
Real Variations
0% +30% -30% -60% -90%
1 2 5 10 15
5 1 2 10 15
Figure 4 – CP1, group 1, complete adherence,
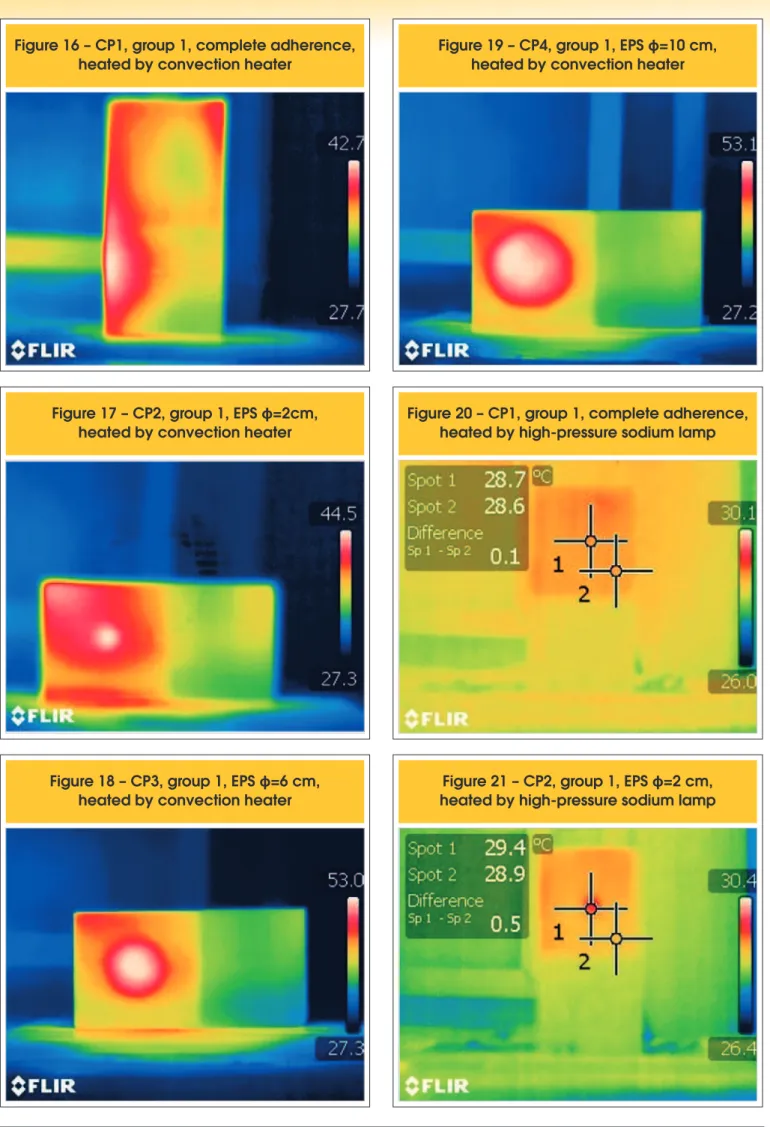
The results shown in Figures 16 to 19 are related to heating sam-ples using the convection heater.
The convection heater could rise even more the temperature of samples and this means that the defect can be clearly visible. None-theless, the heating was not uniform and this can induce to mistaken interpretation of results. For example, it is possible to conclude that there is a defect in the bottom left of CP1 (Figure 16). The other im-ages also present higher temperatures in the top left corner which could be wrongly interpreted as a small defect. So, the conclusion is that the larger the defect is, if the convection heater is correctly positioned, the better the result is. Figures 18 and 19 prove this
af-irmation once the polystyrene contour disc appears clearly and the
heat build-up in the upper left side is less visible.
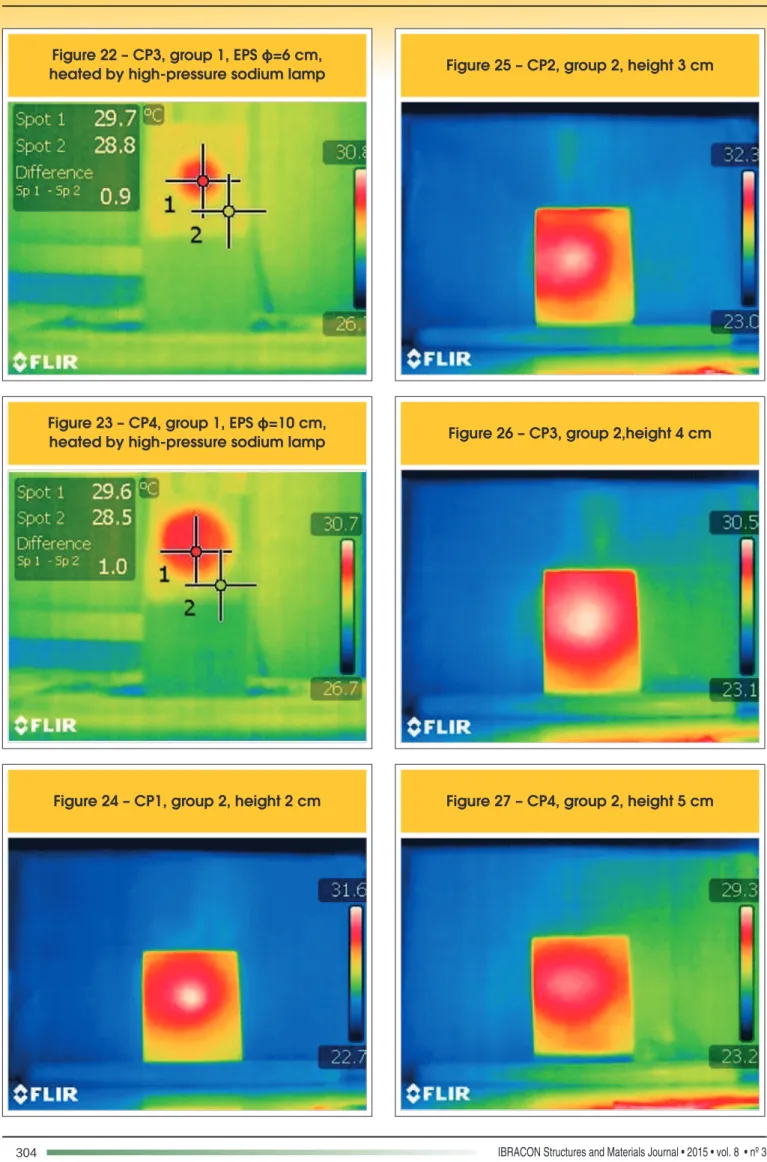
Finally, the results of experiments using high-pressure sodium lamp are shown in Figures 20 to 23.
In this case, the difference of temperature between the place where the defect is and the sound area is small, but it increases when the defect dimension increases. Furthermore, as the emission of heat-ing is not high, the image loses some clearness, if compared to the images obtained for the other heat sources studied.
Comparing the four heating sources used in samples of group 1, it was observed a better resolution when images were captured after being heated by incandescent lamp. Thus, only this heating device was applied on samples of group 2, as the main aim next is to work out how deep it could be reached by the infrared camera to detect the defect.
Figure 6 – CP3, group 1, EPS
ϕ
=6 cm, heated
by incandescent lamp
Figure 7 – CP4, group 1, EPS
ϕ
=10 cm, heated
by incandescent lamp
Figure 8 – CP1, group 1, complete adherence,
kiln, higher temperatures (function “above”)
Figure 10 – CP2, group1, EPS
ϕ
=2 cm, kiln,
higher temperatures (function “above”)
Figure 13 – CP3 group1, EPS
lower temperatures (function “below”)
ϕ
=6 cm, kiln,
Figure 11 – CP2, group 1, EPS
ϕ
=2 cm, kiln,
lower temperatures (function “below”)
Figure 14 – CP4, group1, EPS
higher temperatures (function “above”)
ϕ
=10 cm, kiln,
Figure 12 – CP3, group1, EPS
ϕ
=6 cm, kiln,
Figure 16 – CP1, group 1, complete adherence,
heated by convection heater
Figure 19 – CP4, group 1, EPS
heated by convection heater
ϕ
=10 cm,
Figure 17 – CP2, group 1, EPS
ϕ
=2cm,
heated by convection heater
Figure 20 – CP1, group 1, complete adherence,
heated by high-pressure sodium lamp
Figure 18 – CP3, group 1, EPS
ϕ
=6 cm,
Figure 22 – CP3, group 1, EPS
ϕ
=6 cm,
heated by high-pressure sodium lamp
Figure 25 – CP2, group 2, height 3 cm
Figure 23 – CP4, group 1, EPS
ϕ
=10 cm,
heated by high-pressure sodium lamp
Figure 26 – CP3, group 2,height 4 cm
5.2 Samples of group 2
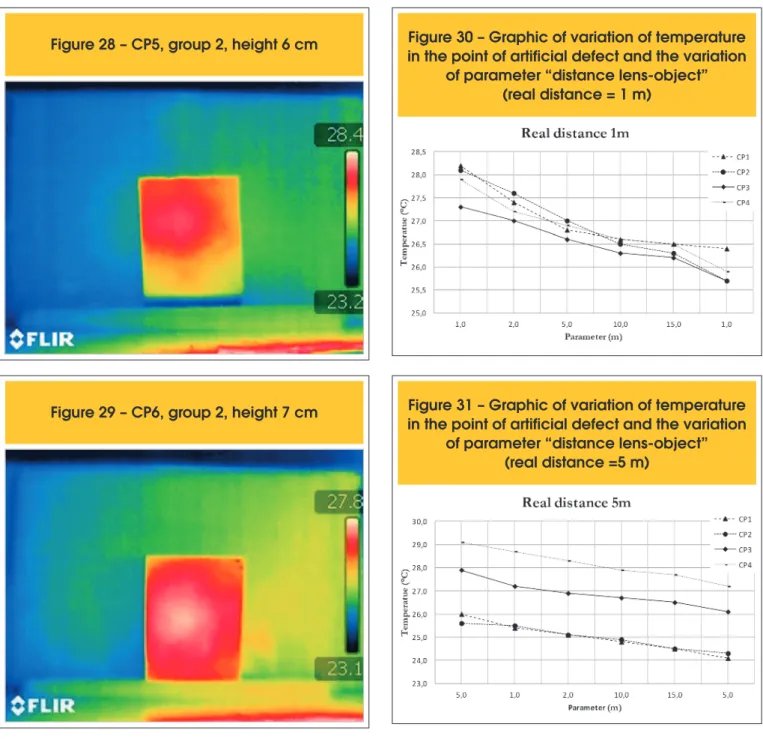
The results related to samples of group 2 are shown in Figures 24 to 29. In Figure 26, it is noted that from 4 cm mortar thickness (or 5cm total sample height) the image appear less clear than the previous and this lack of clearness has worsened with the increase in mortar layer (or the depth of the damage).
However, it is important to remark that this result is valid only for
these experiment conditions: incandescent lamp heating and the time of heating. If the time of heating was increased, for example, one might infer that it should be possible to detect a sample defect located at greater depths. Nonetheless, it does not mean that heat-ing time can be indiscriminately elevated in order to reach the
visu-alization of a greater depth of defect, because an excessive heat -ing can damage the FRP system, impair the adhesion and also
the material strength. Summarizing, the excessive heating can
weaken and even cancel the structural function of FRP system[17].
5.3 Inserting parameters for the infrared camera
Considering samples of group 1 heated by incandescent lamp,
Figure 28 – CP5, group 2, height 6 cm
Figure 30 – Graphic of variation of temperature
in the point of artificial defect and the variation
of parameter “distance lens-object”
(real distance = 1 m)
Figure 29 – CP6, group 2, height 7 cm
Figure 31 – Graphic of variation of temperature
in the point of artificial defect and the variation
of parameter “distance lens-object”
(real distance =5 m)
some wrong parameters were purposefully inserted in infrared camera and so the infrared images were compared taking into ac-count their temperatures and the differences between images. Firstly, the focus was in inserting in the infrared camera greater values of “distance from lens to object” than the ones of the real situation. It is shown in Figure 30 that despite the decrease of tem-perature values in the point of the defect, it is not possible to assert that this is an effect caused by the insertion of false parameters.
The decrease of temperature values also occurs between the irst
and the last measurement, which have exactly the same param-eters inserted. Therefore, this fact might be only due to the natural
condition of thermal equilibrium. Thus, if the camera is positioned
1 m distant from the target and if there is an increase of values
of “distance from lens to object”, there will be no inluence in the
result of sample temperature when it is measured with the infrared camera.
Figure 31 present the results when considered the 5m real dis-tance (from lens to object).
Once again, it is possible to notice the gradual decrease of
tem-perature between the irst and the last measurement which have
inluence in the result of sample temperature when the camera is
positioned 5 m distant to the target.
Similarly to the previous case, the infrared images also do not
present signiicant contrast differences.
However, if the focus is only in the difference of temperature be -tween samples, it can be noteworthy that, considering 5m distance
from lens to object, there is a relation between the size of the de -fect and temperature: the larger the de-fect is, the higher the mea-sured temperature in the central point of the defect will be. This is shown in Figure 31.
In Figure 31, the temperature value in the 2cm artiicial defect
(sample CP2) is very close to the temperature of sample CP1,
which have no artiicial defect. However, it is noteworthy that the temperature value in 6cm artiicial defect (sample CP3) is higher
than CP1 (no defect) and CP2 (2cm artiicial defect) and lower than
CP4 (10 cm defect). The conclusion is that the measurement of temperature of small subsurface damages is impaired when the infrared camera is moved away from the target.
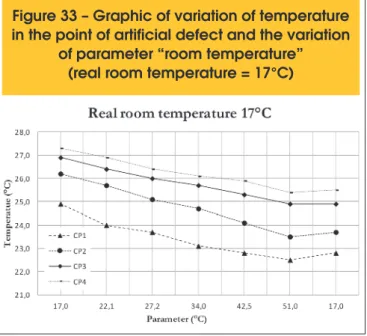
In Figures 32 and 33, the results of variation of parameters of rela-tive humidity and room temperature are respecrela-tively shown.
In Figure 32 it is shown that there is an inluence if the inserted
room temperature is higher than real because there is a small rise
in the graphic lines. However, this rises are less than 0.5°C even
if the values inserted are very far from real. Thus, the insertion of these false room temperatures can lead to a slight decrease of measurement of temperatures, if compared to real temperatures.
Nonetheless, the inluence of relative air humidity (Figure 33) does
not present any abnormality of line graphic decay and thus this
behaviour can be attributed to the thermal equilibrium.
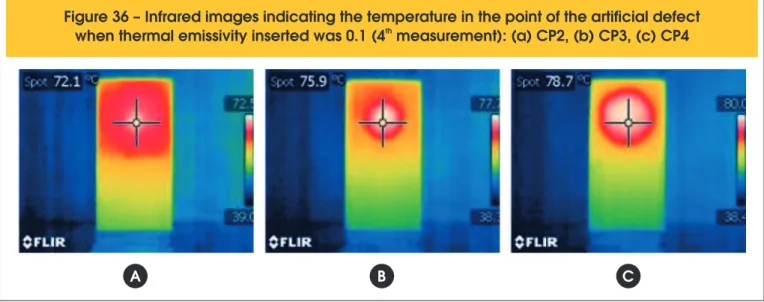
In Figure 34, is shown that the variation of thermal emissivity has
deinitely inluenced the measurement of temperature when using the infrared camera, because it had a signiicant increase when the
value of thermal emissivity inserted was small.
Form igures 35 and 36 one may infer that the visual detection of
damages is not impaired when the thermal emissivity inserted in IR camera is far from the real value.
6. Conclusions
Comparing the different types of heating, it is observed that the
incandescent lamp is the best device because it allows the identii
-cation of the simulated lack of adherence. However, some analysis
must be considered if the type of heating is taken into account. Despite the fact that the incandescent lamp provides clearer infra-red images when used as source of heating, its disadvantage is that it consumes too much energy and also that it has poor durabil-ity. It does not happen if the high-pressure sodium lamp is used, because the latter is more economic.
Nonetheless, the choice of the heat source depends on how and where the inspection will be performed. If the ambient has
Figure 32 – Graphic of variation of temperature
in the point of artificial defect and the variation
of parameter “relative air humidity”
(real relative air humidity = 64%)
Figure 33 – Graphic of variation of temperature
in the point of artificial defect and the variation
of parameter “room temperature”
(real room temperature = 17°C)
Figure 34 – Graphic of variation of temperature
in the point of artificial defect and the variation
controlled temperature, i.e. constant temperatures, without wind or other heating sources interferences (as in tunnels, for instance), the high-pressure sodium lamp could be the best option. Although
the images are less clear than other heat sources, the identiication
of the defect was noticeable.
According to the experimental work, the results using the convec-tion heater do not demonstrated precision and reliability, unlike
those given by the scientiic works [7] and [9]. In the later studies the heat lux was controlled, procedure not followed in the pres -ent research. This demonstrate that not only the type of heating
inluences the thermographic evaluation but also how the heat lux
will cover the surface of the sample, which is an relevant factor to consider in the analysis.
The individual parameters of “relative air humidity” and “distance from lens to object” do not presented any abnormality neither in the mea-surement of temperature nor in the distinctness clearness of infrared
images. However, the insertion of higher room temperature values
can lead to measurements of temperature slightly below the real ones.
The variation of the parameter of thermal emissivity has led to ex-pressive errors when considered temperature measurement and also it has slightly impaired the clearness of the infrared image. These errors were expected because the thermal emissivity is one of the most complex parameters and so it has been studied care-fully by some researchers [11][12]. These authors also concluded that the use of incorrect thermal emissivity values could lead to
signiicant errors in the infrared images when the temperature is
measured and this lead to misleading interpretations.
In the present paper, it was observed that the visual identiication of artiicial defect at interface FRP/concrete was not impaired even if
the thermal emissivity was far from the real value, once the contour of the polystyrene disc was very visible as it is shown in Figures 35 and 36. Therefore, even if considered an adverse situation, the
identiication of subsurface damages using infrared thermography as an NDT technique for diagnostic purposes is not invalidated.
A suggestion for future analysis is the study of combined variation
of parameters and not only individually, once in ield these values
Figure 35 – Infrared images indicating the temperature in the point of the artificial defect
st
when thermal emissivity inserted was 0.96 (1 measurement): (a) CP2, (b) CP3, (c) CP4
A
B
C
Figure 36 – Infrared images indicating the temperature in the point of the artificial defect
th
when thermal emissivity inserted was 0.1 (4 measurement): (a) CP2, (b) CP3, (c) CP4
can be varied together. The ongoing research project will consider this factor.
Finally, it is noteworthy that this paper ratiies part of results achieved by other authors who conirm the applicability of the in -frared thermography method to verify damages at FRP/concrete interface. It also contributes to new results and indicates the
ne-cessity of additional research to clarify some questions raised in
the present work.
7. References
[1] Bloch J, Miller K. Bridge to the future?. Bangor Daily News, Bangor, 2009, p.5-7.
[2] Realfonzo R, Martinelli E, Napoli A, Nunziata B. Experimen -tal investigation of the mechanical connection between FRP laminates and concrete. Compos. Part B Eng., v. 45, n. 1, 2013, p. 341–355.
[3] Cho K, Park SY, Kim ST, Cho JR, Kim BS. Shear connec-tion system and performance evaluaconnec-tion of FRP-concrete composite deck. KSCE J. Civ. Eng., v. 14, n. 6, 2010, p. 855–865.
[4] Bengar HA, Maghsoudi AA. Experimental investigations and veriication of debonding strain of RHSC continuous beams strengthened in lexure with externally bonded FRPs.
Mater. Struct., v. 43, n. 6, 2010, p. 815–837.
[5] Sohn H, Kim SD, In CW, Cronin KE, Harries K. Debonding
monitoring of CFRP strengthened RC beams using active sensing and infrared imaging. Smart Struct. Syst., v. 4, n. 4, 2008 pp. 391–406.
[6] Ghosh KK, Karbhari V M. Use of infrared thermography for
quantitative non-destructive evaluation in FRP strengthened
bridge systems. Mater. Struct., v. 44, n. 1, 2011, p. 169–185.
[7] HALABE, U.B., DUTTA S.S., GANGARAO H.V.S. NDE of
FRP Wrapped Colums Using Infrared In: Quantitative Non-destructive Evaluation, 34°, 2008, Anais, vol. 975, n. 1, p. 1387–1394.
[8] DUMOLIN J., IBARRA-CASTANEDO C., QUIERTANT M., TAILLADE F., BENDADA A., MALDAGUE X. Evaluation of FRP Gluing on Concrete Structures by Active Infrared Ther-mography. In: Conference on Qualitative InfraRed Thermog-raphy, 10°, 2010, pp. 1–9.
[9] DE ALMEIDA E. G. Inspeção Termográica de Danos por Impacto em Laminados Compósitos Sólidos de Matriz Po -limérica Reforçada com Fibras de Carbono, São Carlos, 2010, Dissertação (mestrado)- Universidade de São Paulo, São Carlos, 111 p.
[10] Titman D. Applications of thermography in non-destructive testing of structures. NDT E Int., v. 34, n. 2, 2001, p. 149–154. [11] MADDING R. P. Emissivity Measurement and Temperature
Correction Accurancy Considerations In: Thermosense XXI, 21°, 1999, v. 3700, p. 393–401.
[12] RODRÍGUES F. de J. L. Detecção de Defeitos em Materiais
Cerâmicos Usando Termograia., Florianópolis, 2010, Dis -sertação (mestrado) - Universidade Federal de Santa Cata-rina, 150 p.
[13] Lothenbach B, Winnefeld F. Thermodynamic modelling of the hydration of Portland cement. Cem. Concr. Res., v. 36, 2006, p. 209–226.
[14] SHIN P. H., WEBB S. C., PETERS K. J., “Nondestructive in -spection in adhesive-bonded joint CFRP using pulsed phase thermography. In: Thermosense: Thermal Infrared Applica-tions XXXV, 35°, 2013, v. 8705, p. 87050Q–1 87050Q–9.
[15] GHIASSI B., SILVA S. M., OLIVEIRA D. V., LOURENÇO P. B., BRAGANÇA L. Assessment of the Bond Quality Deg -radation in FRP-strengthened Masonry using IR
Thermog-raphy Technique. In: International Symposium on Fiber
Re-inforcement Polymers for Reinforced Concrete Structures, 11°, Guimarães, 2013, p. 1–9.
[16] Lai WL, Kou SC, Poon CS, Tsang WF, Ng SP, Hung YY. Characterization of Flaws Embedded in Externally Bonded
CFRP on Concrete Beams by Infrared Thermography and Shearography. J. Nondestruct. Eval., v. 28, n. 1, 2009, p. 27–35.
[17] M. Robert and B. Benmokrane, “Behavior of GFRP Reinforc-ing Bars Subjected to Extreme Temperatures,” J. Compos.
Constr., vol. 14, no. 4, pp. 353–360, 2010.
[18] FLIR Systems, Manual do Utilizador FLIR B series FLIR T