Spectral Contents of Electron Waves under
Strong Langmuir Turbulence
M. Virg´ınia Alves
1, R. S. Dallaqua
1, F. Do Prado
2, and D. M. Karfidov
31
Instituto Nacional de Pesquisas Espaciais, Laborat´orio Associado de Plasma
P. O. Box 515, 12243-971 - S˜ao Jos´e dos Campos, SP, Brazil
2
Centro Universit´ario da Fundac¸˜ao Educacional Inaciana - UNIFEI
Av. Humberto de A.C. Branco, 3972, 09859-901, S. B. do Campo, SP, Brazil
3
General Physics Institute, Moscow 119991, Russia
Received on 10 August, 2002. Revised version received on 28 March, 2003
In this work we present experimental results of electron plasma waves excited in a beam plasma system. Based on our experimental results we determine the transition from the quasi-linear to non-linear regime. We present the space evolution of the electron beam distribution function for both regimes. The spectrum of the electron plasma wave in the non-linear regime shows a component with frequency larger than the plasma frequency besides the plasma frequency itself. We show that the higher frequency component is strongly affected by Landau damping, indicating a dissipation region. The measured experimental power spectrum of this wave shows a dependence on wave numberkgiven byWk∝k−7/2as theoretically predicted.
1
Introduction
A system formed by a weak non-relativistic electron beam with a unmagnetized collisionless plasma constitutes one of the most interesting configurations for studying plasma wave-particle interactions. The relaxation of the beam pro-vides the free energy source for a rich variety of non-linear processes. According to quasi-linear (QL) theory the beam relaxation occurs through “plateau” formation by flattening the beam velocity distribution, fb(v), when the beam flows across the plasma[1]. The most unstable elec-trostatic wave has frequency near the plasma frequency, ωL≃ωpe= (n0e2/(ǫ0me))1/2, and wave number given by k0 ≃ωpe/vb,wherevb is the beam velocity. Depending on the beam energy, the amplitude of excited waves can be high enough to become a pump wave for wave-wave interactions such as modulational instability (MI)[2]. The main nonlin-ear effect related to MI is the trapping of waves by density cavities that occurs spontaneously in the plasma as the insta-bility develops. In turn, the trapped waves steep the density even more and the process continues as the waves collapse to smaller and smaller spatial lengths while their amplitude increases. At the collapse burn out stage, when the cavity is small enough for the absorption of Langmuir wave to start, the high-frequency pressure drops quickly and the excess density variations are released as ion-sound waves emitted from the cavity. The evolution of the MI leads the system to the strong Langmuir turbulence (SLT) regime [3-5].
More than twenty years ago a detailed experimental test of quasi-linear theory was performed by Roberson and collaborators[6]. They measured the final state of the
beam-plasma instability, and found good agreement with QL the-ory for the final spectrum and velocity distribution. A few years later, the nonlinear evolution of the electron beam-plasma instability started to be investigated [7-10]. The most recent experimental results on strong Langmuir turbu-lence in the beam plasma interaction have been presented by Wong and collaborators [11-13]. They explore the time evo-lution of the electrostatic wave spectra, during several ion plasma periods.
In this paper we determine experimental conditions for observing strong Langmuir turbulence in our device. We es-tablish the threshold for the transition between quasi-linear and nonlinear regime as a function of beam to plasma den-sity ratio (nb/n0) and beam energy normalized to thermal energy (Wb/n0Te). We measure the beam relaxation length and amplitude waves as a function ofWb/n0Te, for differ-ent values of nb/n0. We obtain the time growth rates for the excited waves and compare them with existing theory. We show that the excitation of MI leads the system to SLT regime. In this regime, we detect the presence of electron wave with frequency larger than the beam resonant wave. We show that for this higher frequency wave Landau damp-ing acts effectively. The measured experimental power spec-trum of this wave shows a dependence on wave numberk given byWk ∝k−7/2as theoretically predicted [14].
2
Experimental apparatus and
diag-nostics
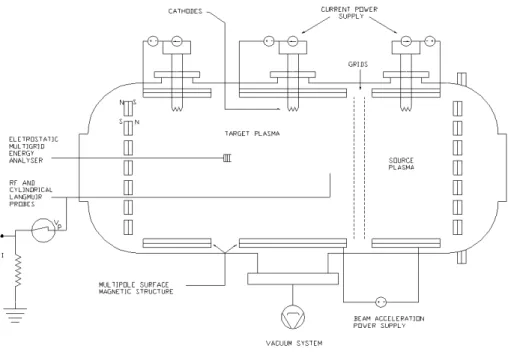
Experiments were carried out in a double QUIescent Plasma (PQUI) device with multipole surface magnetic confine-ment, 0.60 m of inner diameter and 1.20 m of total length [15]. The vacuum background attained using a diffusion pump is of the order of4×10−5
Pa. The device is divided by two grids into a source (ls= 0.30m) and a target plasma
(lt = 0.90 m) electrically insulated. A quiescent plasma is generated independently in both chambers by accelerat-ing primary electrons produced by tungsten hot cathode fila-ments. An electron beam is created biasing the source cham-ber negatively with respect to the grounded target chamcham-ber. The DC electron beam is≈ 0.5 m in diameter with the ratio of beam to electron thermal velocity in the range of vb/vth ≤ 20. The experiments were carried out in Argon gas in the filling pressure range of10−2
≤ p ≤ 10−1 Pa. Fig. 1 shows a schematic diagram of this apparatus.
Figure 1. Schematic diagram of the PQUI apparatus.
Table 1 - Typical plasma experimental parameters
Plasma density (m−3) 1014
< n0<6.0×10 15
Electron temperature (eV) 0.7< Te<5 Electron to ion temperature ratio Te/Ti≤15
Debye length (m) 2.1×10⁻⁴
< λDe<6.2×10⁻⁴ Plasma frequency (MHz) 90< ωpe/2π <690
Ion plasma frequency (MHz) 0.33< ωpi/2π <2.5
Beam energy (eV) Wb≤400
Beam to plasma density ratio 5×10⁻⁵
< nb/n0<10−2 Thermal spread of the beam (atz≃0m) 0.1<(∆v)/vb<0.2
The electron density and temperature measurements were performed using a single cylindrical Langmuir probe. The temperature was determined by the traditional method. The density was obtained by detecting the cut-off frequency of an electromagnetic wave launched into the plasma. The same probe, operating in the ion saturation current regime (probe potential, Vp = −50 V), was used for ion-sound oscillation measurements. The typical plasma potential in
At the range of working pressure the collisional damp-ing rate due to electron-ion and electron-neutral collisions is smaller than the generation rate of waves, the beam-plasma instability growth rate,γbp. This leads to the condition[17]
πnb n0
(vb ∆v)
2 > νen
ωpe
(1)
whereνen is the electron neutral collision rate. Once this condition is satisfied, the excitation of Langmuir wave by the beam-plasma instability is allowed. Using the parame-ters shown in Table 1 we see that Equation 1 is satisfied.
The beam tends to disturb the plasma, so we consider measurements for distances (z) larger than 0.2 m away from the grid, in the target plasma. At this distance the plasma is uniform in density and temperature, as shown in Fig. 2. The waves are still far from saturation when they enter the uni-form region, and all important physics occurs in that region.
Figure 2. Density and temperature across the PQUI device. The distancezis measured from the injecton grid. Relevant parameters areWb/(n0Te) = 125, andnb/n0= 4.1×10⁻⁴.
3
Transition from QL to SLT regime
In order to explain the observed waves in our experiment, we need a comprehensive theory. Such theory requires the specification of a free-energy source, a mechanism for wave growth driven by this free-energy source, and a wave energy saturation mechanism. Free energy for the Langmuir wave growth is provided by the beam relaxation. For the range of parameters used in the experiment the Langmuir wave growth is driven primarily by the kinetic version of the beam instability. The saturation mechanism is quasi-linear relax-ation or nonlinear processes, depending on the beam plasma parametersWb/Teandnb/n0[18].
From our experimental results it is possible to estab-lish a threshold line for the transition between QL and SLT regimes. We measure the maximum of Langmuir wave am-plitude, Wmax
L , as a function of Wb/Te for different val-ues ofnb/n0. Fig. 3 shows the results. Two different be-haviours appear: up to a certain value of Wb/Te, called
here(Wb/Te)th, the best fit of the experimental points gives Wmax
L ∝ (Wb/Te)2.0±0.3, independent of the value of nb/n0. ForWb/Te > (Wb/Te)th, the wave amplitude re-mains approximately constant. Fig. 3 also shows thatWmax
L increases withnb/n0.
Figure 3. Maximum of electron wave amplitude as a function of Wb/Te for different values of nb/n0: (a) 4.4×10⁻³ , (b) 1.7×10⁻³, (c)4.1×10⁻⁴, and (d)1.3×10⁻⁴. Lines are the
best fit to the experimental points, considering different ranges of beam energy.
According to quasi-linear theory, and considering pile up effects, the maximum normalized energy density of the waves is given by[18]
Wmax
L =
ǫ0|E0| 2
2n0Te = 1
18 nb n0
µ Wb
Te ¶2
. (2)
Therefore, forWb/Te < (Wb/Te)th, our experimental re-sults show the same dependence of Wb/Te andnb/n0 as predicted by QL theory.
Stabilization of maximum wave amplitude suggests the appearance of a nonlinear phenomenon that interferes with the beam-plasma instability evolution. Together with the saturation of wave energy we see the appearance of ion-sound waves[19].
From Fig. 3, for a given value ofnb/n0, we obtain the value of(Wb/Te)th. These points are shown in Fig. 4, iden-tified by circles, together with the points where ion sound waves are observed, identified by triangles. The line shown in Fig. 4 is the theoretical threshold for MI excitement in an electron beam plasma system [20]
µ nb n0
th
≃
µ Te Wb
¶3
th
Figure 4. Threshold conditions for transition from quasi-linear electron beam-plasma interaction to strong turbulence regime in a plane of parametersWb/Teandnb/n0.
For a system with parameters in the region below the MI excitation threshold, the Langmuir wave energy satu-rates due to the complete relaxation of the beam. The po-sition of saturation of the wave energy corresponds to the position of plateau formation in the distribution function, as predicted by quasi-linear theory (known as “beam relaxation
length”). For a system with parameters in the region above the MI excitement threshold, the nonlinear instability trans-ports the plasma waves to shorter wavelength scales (higher frequencies) where the resonant interaction between beam and waves does not occur. As a consequence the beam prop-agates for larger distances than the ones predicted by QL theory.
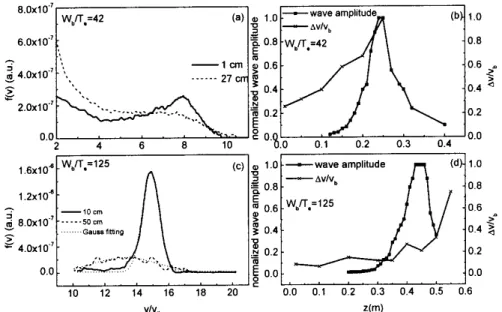
The axial evolution of the electron beam distribution function shows clearly the different behaviour for the quasi-linear and for the nonquasi-linear regime, as we can observe in Fig. 5. Figs. 5(a) and (b) show the quasi-linear case, withWb/Te = 42, and Figs. 5(c) and (d) show the non-linear case, withWb/Te = 125. For both casesnb/n0 = 4.1×10⁻⁴
. Figs. 5(a) and (c) show the electron beam distri-bution function for two different axial positions. Figs. 5(b) and (d) show the wave amplitude normalized by the max-imum wave amplitude and the spread of the beam∆v/vb against position. These figures show that the maximum of the wave amplitude coincides with the complete beam re-laxation (∆v/vb= 1) for the quasi-linear case. For the non-linear case, even forz = 0.5 m it is possible to identify a beam. The values of∆v/vbwere obtained using a Gaussian fit to the data as shown in Figs. 5(a) and (c).
Figure 5. Electron beam distribution function at two different positions: (a) for the quasi-linear case,Wb/Te= 42and (c) for the nonlinear
case,Wb/Te= 125. For both casesnb/n0= 4.1×10⁻⁴. Axial variation of the normalized wave amplitude and the velocity beam spread:
(b) for the quasi-linear case and (d) for the nonlinear case.
Figure 6 shows the normalized beam relaxation length, Ln = lωpe/vb, as a function ofWb/Tefor three different values of nb/n0. The lengthl is the distance between the grid and the axial position where the plateau is formed in the distribution function. The QL theory gives the beam re-laxation length asLn = (nb/n0)−1(Wb/Te)−1Λ, whereΛ is of order of the Coulomb logarithm[20]. The lines shown in Fig. 6 are obtained using Λ = 8and the corresponding nb/n0. Experimental results show that forWb/Te >100,
measured beam relaxation lengths are larger than the ones predicted by QL theory.
at fL = 380MHz, close to the plasma frequency (beam resonant wave). The second spectrum (B) was obtained at z = 0.40m and presents the main peak,fL = 380MHz, followed by the second harmonic,f ∼740MHz. Harmon-ics of the main frequency have already been observed[21]. The third plot was obtained at z = 0.50 m and shows a broader peak atfL = 380MHz, indicating the presence of waves with frequency larger than the frequency of the beam resonant wave. The second harmonic is still present with smaller amplitude than in case B. The wave amplitude in-creases with the distance from the grid and reaches a maxi-mum value atz ≃0.4m and then decreases for larger dis-tances. The space evolution of the Langmuir wave ampli-tude determines the behaviour of the system.
4
Analysis of the electron waves in the
nonlinear regime
In this section we concentrate on the electron waves ob-served in the nonlinear regime. The results obtained from the experimental date are compared with the existing theory. It is important to point out that we have a continuous beam injection. This fact leads us to a situation where close to the grid, at the point of beam injection, we expect that the excited wave amplitude grows as predicted by QL the-ory. For larger distances, the behaviour of the system de-pends on the wave energy density,WL=ǫ0|E0|2/2. After reaching a certain threshold, the excited wave can became a pump wave for wave-wave interactions. Starting from the space profile alongz of the wave amplitude we obtain the spatial growth rate, κ, for the instability and from that we obtain the temporal growth rate,γ. To obtain the results we present in this section we have usedn0= 2.1×10¹⁵
m−3 , nb/n0= 4.1×10⁻⁴andWb/Te= 125 (vb∼16vth). No-tice that with these parameters we are above the threshold MI line shown in Fig. 4, i.e., the system operates in the SLT regime.
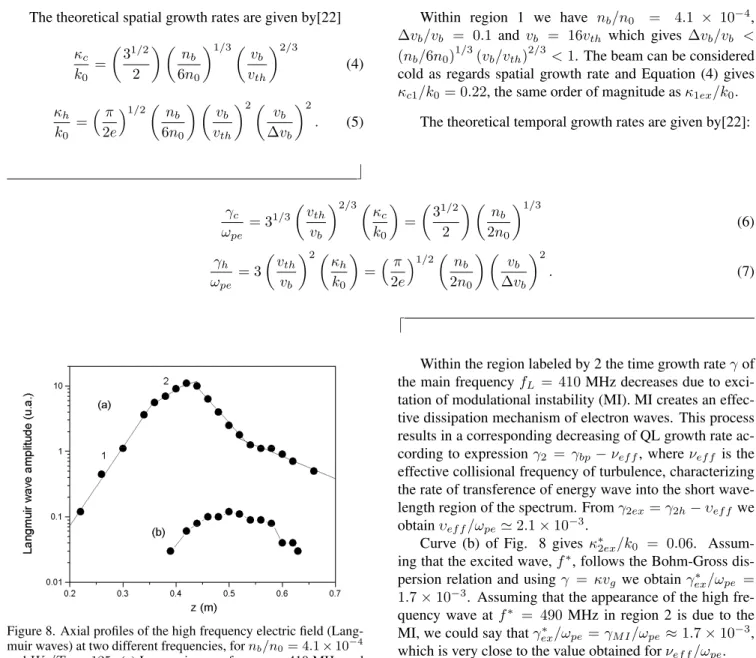
The axial profiles of the electron wave amplitude at fre-quencies, fL = 410MHz, close to the plasma frequency, and atf∗
= 490MHz, are shown in Fig. 8 (curves (a) and (b), respectively). Observe that the higher frequency wave only appears after the Langmuir wave has reached region labeled by 2.
Notice that from our experimental results we can only obtain the spatial growth rate. In general, beam-plasma in-stabilities exhibit both temporal and spatial growth. A sim-ple relationship between them is given when the beam can be considered cold (c) or hot (h), as regards both temporal and spatial growth[22].
The experimental values of the spatial growth rate can be obtained from Fig. 8 as follows. The spatial growth rate isκex = 1/ζ, whereζis the distance over which the wave amplitude grows by a factor ofe≃ 2.7. Within region la-beled by 1 in Fig. 8 we obtainκ1ex/k0 = 0.11and within region labeled by 2 we obtainκ2ex/k0= 0.04.
Figure 6. Measured (symbols) and theoretical (QL) relaxation length (lines) againstWb/Te, fornb/n0= 4.8×10−
4
,2.4×10−3,
and6.1×10−3.
Figure 7. Frequency spectra of Langmuir waves obtained in differ-ent positions in the target chamber: A forz= 0.3m, B forz= 0.4
The theoretical spatial growth rates are given by[22]
κc k0 =
µ31/2
2
¶ µ n b 6n0
¶1/3µv b vth
¶2/3
(4)
κh k0 =
³π 2e
´1/2µ nb 6n0
¶ µ v b vth
¶2µ v b ∆vb
¶2
. (5)
Within region 1 we have nb/n0 = 4.1 × 10− 4
, ∆vb/vb = 0.1 and vb = 16vth which gives ∆vb/vb < (nb/6n0)
1/3
(vb/vth) 2/3
<1. The beam can be considered cold as regards spatial growth rate and Equation (4) gives κc1/k0= 0.22, the same order of magnitude asκ1ex/k0.
The theoretical temporal growth rates are given by[22]:
⌋
γc ωpe
= 31/3 µv
th vb
¶2/3µκ c k0
¶ =
µ31/2
2
¶ µ n b 2n0
¶1/3
(6) γh ωpe = 3 µ vth vb
¶2µ κh k0
¶ =³π
2e
´1/2µ nb 2n0
¶ µ vb ∆vb
¶2
. (7)
⌈
Figure 8. Axial profiles of the high frequency electric field (Lang-muir waves) at two different frequencies, fornb/n0= 4.1×10−
4
andWb/Te = 125: (a) Langmuir wave frequency, 410 MHz and
(b) high frequency, 490 MHz.
As regards temporal growth the beam can be con-sidered marginally hot, since (nb/6n0)
1/3
(vb/vth) 2/3
< ∆vb/vb < 1. For the experimental parameters we obtain γ1c/ωpe = 5×10⁻²andγ1h/ωpe = 1.5×10⁻². Since the beam is only marginally hot let us assume that we can consider the beam cold as regards both temporal and spatial growth and use Equation (6) to obtain the temporal growth rate related toκ1ex. In that caseγc1ex/ωpe= 2.3×10⁻², a value in between the values obtained previously, and we can say that in region 1 the beam-plasma is the dominant insta-bility, and the system behaves as predicted by QL theory.
Within region 2,∆vb/vb ≃ 0.25(see Fig. 5), and the beam can be considered hot as regards both temporal and spatial growth rates. In that case the temporal growth rate γ2ex can be estimated through the relationγ=κvg, where κis the spatial growth rate andvg = 3vte2/vb is the group velocity of Langmuir waves[22]. These considerations give γ2ex/ωpe= 4.7×10⁻⁴.
Within the region labeled by 2 the time growth rateγof the main frequencyfL = 410MHz decreases due to exci-tation of modulational instability (MI). MI creates an effec-tive dissipation mechanism of electron waves. This process results in a corresponding decreasing of QL growth rate ac-cording to expressionγ2 =γbp−νef f, whereνef f is the effective collisional frequency of turbulence, characterizing the rate of transference of energy wave into the short wave-length region of the spectrum. Fromγ2ex=γ2h−υef f we obtainυef f/ωpe≃2.1×10−3.
Curve (b) of Fig. 8 gives κ∗
2ex/k0 = 0.06. Assum-ing that the excited wave,f∗
, follows the Bohm-Gross dis-persion relation and usingγ = κvg we obtainγex∗ /ωpe = 1.7×10⁻³
. Assuming that the appearance of the high fre-quency wave atf∗ = 490
MHz in region 2 is due to the MI, we could say thatγ∗
ex/ωpe=γM I/ωpe ≈1.7×10⁻³, which is very close to the value obtained forνef f/ωpe.
The relevant growth rate of modulational instability can be estimated by[20]
γM I ωpe =
µ m eWL 3minoTe
¶12
(8)
whereWLis the pump Langmuir wave amplitude.
We have not measured directly the value ofWL. How-ever, the value ofWL can be estimated in different ways. Using Equation 2 we obtain WL = WL/n0Te = 0.36. On the other hand, considering energy balance condition, γbp ≃ γM I, we obtainWL ≈0.32. The maximum of en-ergy of Langmuir wave, resonant with the electron beam, can also be attained from the normalized relaxation length of the beam[24]
WL≃ 1 Ln
Wb Te
. (9)
For the experimental conditions described before we haveLn≃250(see Fig. 6), which givesWL≃0.5.
the electrostatic code XPD1[23], incorporating three species of charged particles: background electrons and ions with maxwellian distribution functions and beam electrons with a drifting maxwellian distribution function. We choose as initial conditions the following parameters, typical for our experimental system in the nonlinear regime:n0= 2×10¹⁵ m−3
,Te= 2eV,Te/Ti= 10,vb = 9.6×10⁶m/s≃16vte, ∆v/vb= 0.1,me/mi= 1/(40×1836),nb/n0= 5×10⁻⁴, andWb/Te= 125. Fig. 9 shows the electric field across the system obtained from simulations for a timet≈18ω−1
pi . For z≃0.4m we obtainE0≃5kV/m, which givesWL≃0.2.
Figure 9. Axial profile of the electric field obtaind from simula-tions for a timet≃18ω−1
pi.
In summary, either way we reckon the value ofWL, we obtain0.2 < WL ≃0.5, and the MI growth rate given by Equation 8 stays in the range1×10−3
up to1.5×10−3 , in good agreement with bothνef f/ωpe andγex∗ /ωpe. Also WL >> (kλD)2, a condition to strong Langmuir turbu-lence.
The values of wave number involved in these processes can be obtained as follows. Using the Bohm-Gross disper-sion relation for small values ofkλDe
( f fpe
)≃1 +3 2(kλDe)
2
(10)
we obtainkλDe ∼0.36for the wave withf∗ = 490MHz, andfpe ≃ 412 MHz. The absorption of the highest fre-quency component is an important characteristic at the final stage of the SLT regime. The plasma bulk electrons are ac-celerated by Landau damping. Theoretical expression for Landau damping is
Γk ωpe
= π 8
1
(kλDe)3exp(−1/(2k 2
λ2
De)−3/2). (11)
ForkλDe∼0.36,Equation 11 givesΓk/ωpe= 4.0×10⁻². We see then that for the region of the spectrakλDe∼0.36, Landau damping acts effectively, compared to the others growth rates previously calculated. According to theory, the turbulent energy concentrated in the high frequency waves is absorbed by plasma electrons, leading to acceleration of
bulk electrons, as experimentally observed[19]. The theoret-ical results on power spectra for this absorption is given by W(k)∝k−7/2
[14]. Fig. 10 shows the experimental results for the power spectra presenting a good agreement with the theory.
Figure 10. Power spectra of the higher frequency electron plasma wave.
5
Conclusions
We present experimental measurements of electron waves excited in a system operating in a Langmuir turbulence regime. The interaction of a non-relativistic warm elec-tron beam with a unmagnetized plasma drives the turbu-lence. We establish experimental threshold conditions for transition from the QL into the SLT regime as a function of beam and plasma parameters, Wb/Te andnb/n0. The operating regime determines the appearance and character-istics of Langmuir waves. At regions close to the grid, point of the injection of the beam, the Langmuir wave grows ac-cording to QL theory. As the wave amplitude reaches a cer-tain threshold it becomes a pump wave for exciting other waves. A wave with frequency larger than the frequency of the beam resonant wave appears. Analysis of the growth rates indicate that this wave is a consequence of the devel-opment of the modulational instability. It was shown that this component is strongly affected by Landau damping and the measured power spectra is in good agreement with the theory. Analysis of the effects of the ion waves on the dy-namics on the Langmuir turbulence will be addressed in a near future.
Acknowledgments
The authors thank the Brazilian Agency CNPq (Con-selho Nacional de Desenvolvimento Cient´ıfico e Tec-nol´ogico) for partially supporting this work.
References
[1] D. B. Melrose,Instabilities in space and laboratory plasmas, Cambridge University, pp.45-50 (1986).
[3] L. N. Degtyarev, R. Z. Sagdeev, G. I. Solov´ev, V. D. Shapiro and V. I. Shevchenko, Sov. Phys. Plasma Phys.,6, 263 (1980). [4] V. D. Shapiro and V. I. Shevchenko, inHandbook of Plasma Physicsvol. 2, eds. M Rosenbluth and R Sagdeev, p.124, Am-sterdam: Elsevier Publ., (1984).
[5] V. E. Zakharov, Sov. Phys. JETP,35, 908 (1972).
[6] C. Roberson, K. W. Gentle, and P. Nielsen, Phys. Review Lett.,26, 226 (1971).
[7] B. H. Quon, A. Y. Wong, and B. H. Ripin, Phys. Review Lett.,
32, 406 (1974).
[8] A. Y. Wong and B. H. Quon, Phys. Review Lett.,34, 1499 (1975).
[9] H. Ikezi, R. P. H. Chang, and R. A. Stern, Phys. Review Lett.,
36, 047 (1976).
[10] A. Y. Wong and P. Y. Cheung, Phys. Review Lett.,52, 1222 (1984).
[11] M. D. McFarland and A. Y. Wong, Phys. Plasmas, 4, 945 (1997).
[12] M. D. McFarland and A. Y. Wong, Phys. Plasmas, 8, 110 (2001).
[13] M. D. McFarland and A. Y. Wong, Physical Review Letters,
84, 666 (2000).
[14] A. A. Galeev, R. Z. Sagdeev, Yu. S. Sigov, V. D. Shapiro, and V. I. Shevchenko, Sov. J. Plasma Phys.,1, 5 (1975).
[15] J. L. Ferreira, F. do Prado, M.V. Alves, E. D. Campos, and D. M. Karfidov, Revista de F´ısica Aplicada e Instrumentac¸˜ao,9, 47 (1994).
[16] F. do Prado,Estudo Experimental de Ondas e Turbulˆencia de Langmuir,PhD Thesis, INPE-6819-TDI, 1997.
[17] D. L. Matthews, M. Pongratz, and K. Papadopoulos, J. Geo-phys. Research,81, 123 (1976).
[18] V. N. Tsytovich, Nonlinear effects in plasma, New York: Plenum Press (1970).
[19] F. Do Prado, D. M. Karfidov, M. V. Alves, and R. S. Dallaqua, Physics Letters A,248, 86 (1998).
[20] A. A. Gallev, R. Z. Sagdeev, V. D. Shapiro, and V. I. Shevchenko, Sov. Phys. JETP,45, 266 (1977).
[21] P. Y. Cheung, A. Y. Wong, C. B. Darrow, and S. J. Qian, Phys. Review Lett.,48, 1348 (1982).
[22] S. A.Self, M. M. Shoucri, and F. W. Crawford, J. Applied Phys.,42, 704 (1971).
[23] J. P. Verboncoeur, M. V. Alves, V. Vahedi, and C. K. Birdsall, J. Comp. Physics,104, 321 (1993).