Article
J. Braz. Chem. Soc., Vol. 25, No. 11, 2032-2038, 2014. Printed in Brazil - ©2014 Sociedade Brasileira de Química 0103 - 5053 $6.00+0.00
A
*e-mail: [email protected]
A Green Approach for the Determination of Selected Anti-Diabetic Drugs in
Pharmaceutical Formulation by Transmission FTIR Spectroscopy
Faiza Fahim,a Ayesha Naseer,a Shakil Ahmed,a Syed Tufail H. Sherazib and Muhammad I. Bhanger*,a
aHEJ Research Institute of Chemistry, International Center for Chemical and Biological Sciences, University of Karachi, 75270 Karachi, Pakistan
bNational Centre of Excellence in Analytical Chemistry, University of Sindh, 76080 Jamshoro, Pakistan
Métodos baseados em espectroscopia de infravermelho com transformada de Fourier (FTIR) para a determinação de duas drogas anti-diabetes, i.e., metformina HCl e glimepirida em formulações de comprimidos, são descritos. Os métodos envolvem o uso de discos de KBr, cautelosamente preparados, com padrões e amostras de metformina HCl e glimepirida. Espectros de FTIR foram adquiridos na região de infravermelho média. A extração e pré-concentração foram evitadas. Para a quantificação da metformina HCl, uma banda de IR proeminente, com localização fixa em 3173 cm−1 com dois pontos na linha base, entre 3550-2850 cm−1 e para a glimepirida, uma banda com localização fixa em 1708 cm−1, com dois pontos na linha base, entre 1800-1600 cm−1 foram selecionados para a calibração usando a lei de Beer. Para a metformina HCl, desenvolveu-se calibrações usando padrões na faixa entre 0,300 mg a 3,100 mg, enquanto que para a glimepirida, as calibrações foram desenvolvidas usando padrões na faixa entre 0,400 a 2,450 mg. Precisão e reprodutibilidade dos métodos propostos foram avaliadas e classificadas como satisfatórias com coeficientes de regressão excelentes, recuperação aceitável e baixos desvios do padrão. Os métodos de FTIR foram aplicados com sucesso na quantificação de formulações de fármacos contendo metformina HCl e glimepirida como substâncias ativas e os resultados comparáveis aos valores citados.
Fourier transform infrared spectroscopy (FTIR) based methods for the determination of two anti-diabetic drugs, i.e., metformin HCl and glimepiride in tablet formulation are described. The methods involve the use of carefully prepared KBr discs with standards and samples of metformin HCl and glimepiride. FTIR spectra were acquired in the mid IR region. Extraction and pre concentration procedures were totally avoided. For quantification of metformin HCl, a prominent IR band appearing at fixed location height 3173 cm−1 with two point baseline between 3550-2850 cm−1 and for glimepiride IR band at fixed location height 1708 cm−1 with two point baseline between 1800-1600 cm−1 were selected for Beer’s law calibrations. For metformin HCl, calibrations were developed using standards in the range between 0.300 mg to 3.100 mg whereas for glimepiride, calibrations were developed using standards in the range between 0.400 mg to 2.450 mg. Accuracy and reproducibility of proposed methods were evaluated and found to be satisfactory with excellent regression coefficients, acceptable recoveries and low standard deviations. The FTIR methods were successfully applied for the quantification of pharmaceutical tablets formulation containing metformin HCl and glimepiride as active substances and the results were found to be comparable with the quoted values.
Keywords: transmission FTIR spectroscopy, metformin HCl, glimepiride, tablet formulations
Introduction
Type II diabetes is a metabolic disease, which is characterized by high blood sugar level. It is a life threatening disorder and prevalence of diabetes in developing countries are
penetrating very fast. One of the surveys reveals that 366 million cases will be predicted in 2030 and number of cases will be doubled from 2000 to 2030 in developing countries.1 The
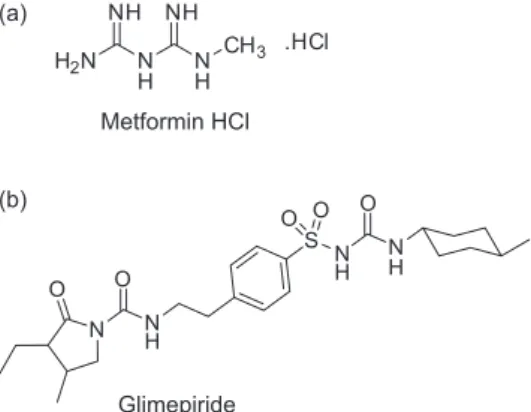
Metformin HCl (imidodicarbonimidicdiamide, N,N -dimethyl-monohydrochloride) is the first line of therapy in the case of overweight patients.2 If blood glucose levels
remains inadequate, so other oral hypoglycemic agents [sulfonylureas usually glimepiride (3-ethyl-4-methyl-N -(4-[N-((1r,4r)-4-methylcyclohexylcarbamoyl)-sulfamoyl] phenethyl)-2-oxo-2,5-dihydro-1H-pyrrole-1-carboxamide)] may be added in the therapy or review the dose of the metformin HCl2 will be the strategy for controlling the
levels of glucose in blood. Chemical structures of metformin HCl and glimepiride are presented in Figure 1a and 1b, respectively.
Different analytical methods, including chromato-graphic3-10 and spectroscopic,11-20 are reported for
determination of metformin HCl and glimepiride in pharmaceutical dosage. Official methods for the determination of metformin HCl and glimepiride are available in British,21 and US22 Pharmacopeia. A review
of the use of various analytical techniques for analysis of glimepiride has also been published in the past.23 Most of
these methods are lengthy, expensive, time consuming and laborious besides requiring a toxic solvents thus resulting in retardation in the pace of quantification. Moreover for betterment of human health, USP recommended that there should be a less use of chemicals and reagents in pharmaceutical analysis, so as all the above mentioned methods for detection of active will be less favorable for daily analysis of pharmaceutical dosage form.
Fourier transform infrared spectroscopy (FTIR), in recent years, has proved to be a simple, rapid and green method for the quantification of many active constituents in pharmaceutical samples,24-33 as in most of the cases, no
prior sample preparation is required. In the present work, metformin HCl and glimepiride, the two well-known anti-diabetic drugs, have been evaluated directly by transmission FTIR in dosage form by preparing accurately weighed amount of KBr pellets with standards and samples.
Experimental
Material and methods
Chemical and reagents
Pure analytical grade standard sample of metformin HCl and glimepiride were obtained with courtesy of local Pharmaceutical Suppliers. Spectroscopic grade KBr (Merck Company) was used for drawing pellet of standards and samples to analyse on the FTIR. Locally manufactured pharmaceutical formulations containing metformin HCl and glimepiride as an active ingredient are used for analysis. The method is outlined as follow:
Preparation of sample for analysis
Calibration and validation samples of metformin HCl and glimepiride were grinded in a mortar to homogenize the powders properly. Suitable weight ratios (such as 1 mg of metformin HCl and 0.500 mg of glimepiride with 99 mg of KBr) were transferred to 13 mm die and pressed near 12000 lbs for 5 min to obtain a pellet. The pellet was then placed in the FTIR for recording the spectra. The commercial tablets were first ground and then processed further in the same way as the calibration samples.
FTIR parameters
FTIR spectrometer of Thermo Nicolet 6700 with removable KBr optics and equipped with Deuterated Tri Glycine Sulfate (DTGS) detector was used to analyze pellets of standards and sample with KBr. All spectra were taken in mid infrared (IR) region of 4000-400 cm−1 accumulating
32 scans per spectrum at an optimum resolution of 4 cm−1.
Software named as OMNIC version 7.3 (Thermo Nicolet Analytical Instruments, Madison, WI) was used to record and operate FTIR spectra. Before each analysis, fresh background spectrum was taken with same instrumental conditions.
Calibrations
For metformin HCl
A set of eight standards with KBr in the form of pellet were prepared in concentration range of 0.300 mg to 3.100 mg for Beer’s law calibration. Linear calibrations were obtained with chemometric software, Turbo Quant (TQ) Analyst.
For glimepiride
Similarly for glimepiride, a set of nine standards in the concentration range of 0.400 mg to 2.450 mg were prepared. Calibration was carried out by focusing on
carbonyl band at 1708 cm−1 to achieve best linearity and
regression results. Although other bands were also selected for the calibration but statistical results of selected bands were excellent.
Software and data treatment
Nicolet TQ Analyst chemometric software was used to construct Beer’s law. To evaluate the predictive ability of the developed models and to compare it, the relative standard errors of prediction (RSEP) were calculated. The RSEPCAL and RSEPVAL errors were determined for the
calibration and validation data sets, respectively, which are shown in Figure 3 and 5. To check the performance of the developed model the cross-validation technique, leave-one-out, was applied.
Interday and intraday precision
The intra and interday precision were checked assay of the samples on the same day and on different days at different time intervals, respectively.
Roughness of methods
The robustness of the method was evaluated by assay of the sample, by a different analyst on same instrument on a different day.
Efficiency and recovery
Through standard addition method, the recovery was determined to check the efficiency of method. In this method, varying quantities of the standards were added to the known concentration of pharmaceutical sample and then by the proposed method total concentration was evaluated. Then this concentration is compared with the actual concentration. The recovery and efficiency was calculated by using equation 1.
R (%) = (C.B/A) × 100 (1)
where R is concentration of glimepiride recovered, C is total concentration after addition, B is the concentration of sample taken before addition and A is concentration of standard added.
Limit of detection and quantification
The analytical parameters, limit of detection (LOD) and quantification (LOQ) for the current method were
determined by calculating the peak height of the IR bands at 3173 cm−1 for metformin HCl and at 1708 cm−1 in
glimepiride at a fairly low concentration until the band just disappeared. The lowest amount from which the substantial signal was produced was analyzed eleven times and calculated using the equation 2. Likewise, LOQ of this method was determined with the equation 3.
LOD = 3 × SD × C/P (2)
where SD is standard deviation, C is the lowest concentration of standards that could be detected and P is the peak height.
Similarly:
LOQ = 10 × SD × C/P (3)
In this study, AOAC Guidelines for Single Laboratory Validation of Chemical Methods for Dietary Supplements and Botanicals,34 were used to calculate the coefficient
of variation (CV, %) of the data set and used as relative standard deviation (RSD, %).
Results and Discussion
Metformin HCl and glimepiride have been successfully determined in this study by transmission FTIR using KBr pellets. Proposed methods for assessment of metformin HCl and glimepiride will be a worthwhile addition to the quality control and quality assurance in pharmaceutical industry.
FTIR spectra of pure standard and a drug sample containing metformin hydrochloride are shown in Figure 2a and 2b, respectively. Two characteristic bands of metformin hydrochloride were observed at 3370 cm−1 and 3292 cm−1
relative to the N–H primary stretching vibration. While a band at 3173 cm−1 due to the N–H secondary stretching,
and characteristic bands at 1622 cm−1 and 1568 cm−1 are
assigned to C-N stretching. As the amount of metformin hydrochloride in the tablet was above 95%, there is no major interference of the matrix substances. Both spectra related to standard and drug sample of metformin hydrochloride were found to be comparable which is very obvious from Figure 2a and 2b.
Many bands and spectral regions were selected for the calibrations. However, selected bands and spectral regions provided best results for Beer’s law calibrations. KBr disks with various concentrations of the metformin HCl standards in ranging between 0.300 mg to 3.100 mg were prepared. A band showing best results at 3173 cm−1 for Beer’s law with
R2 value of 0.996 and spectral region between 3550 cm−1 to
2850 cm−1 (the absorbance of N–H primary and secondary
The Beer’s law calibration model was developed through computed fixed height in the TQ analyst program. Following achieved regression equation (equation 4) was applied on tablets obtained from the local commercial drug stores to calculate actual amount of metformin HCl.
Y= 1.7439 x + 0.000 (4)
The quantitative results of metformin HCl were also checked by selecting another relatively sharp band at 936.46 cm−1, which is very clear in Figure 2a and 2b, but
calibration was not so linear as compared to calibration of 3173 cm−1 band.
An additional advantage of the comparison of Figure 2a and 2b is that it provides an opportunity to check the presence of impurity in drug samples as several substandard or expired drugs may be present in the market; hence it is well suited to distinguish even counterfeit drugs from the original sample. This quality is specific for a direct FTIR method, such as present one, over the generally used spectrophotometric and chromatographic methods.
Characteristic stretching bands at 3369 cm−1 correspond
to amine (-N−H), a band at 2931 cm−1 relates to aromatic Figure 2. FTIR spectra of (a) pure standard metformin HCl and (b) as drug sample (glucophage).
(-C−H) while bands at 1708, 1079 and 1544 cm−1
correspond to amide (C=O), sulfoxides and aromatic (C=C), respectively.
From various selected bands, a specific band at 1708 cm−1 with baseline from 1800 to 1600 due to carbonyl
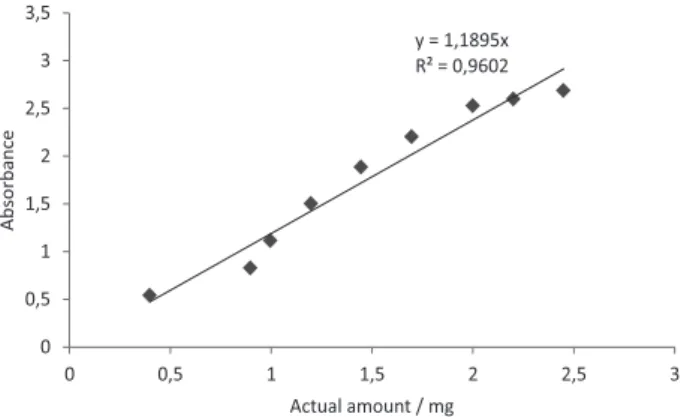
group of glimepiride was selected for Beer’s law calibration because bands due to amine groups are not so intensive. Therefore, it has not provided good calibration for our selected range of standards. The concentration range of glimepiride standards for Beer’s law was ranged between 0.400 mg to 2.450 mg in KBr pellets with the regression coefficient R2 = 0.960. The result of calibration was
found to be acceptable. As concentration of standards was increased, absorbance was found to increase accordingly. So, without any doubt, such calibrations could be boldly used for accurate quantification of active component in pharmaceutical dosage. The Beer’s law calibration model is shown in Figure 5.
Following regression equation (equation 5) was achieved through Beer’s law calibration plot, which was
applied on the real pharmaceutical samples to calculate actual amount of glimepiride in tablet formulation.
Y= 1.1895 x + 0.000 (5)
The LOD and LOQ for metformin HCl were determined and found to be 0.138 mg and 0.572 mg, respectively. Similarly, for glimepiride these values were calculated as 0.001 and 0.006 respectively.
Beer’s law calibrations were applied on real pharmaceutical samples containing metformin HCl and glimepiride as active ingredients. FTIR predictions given in Table 1 indicated that amount of active ingredient is almost comparable with quoted values on the packet of tablets.
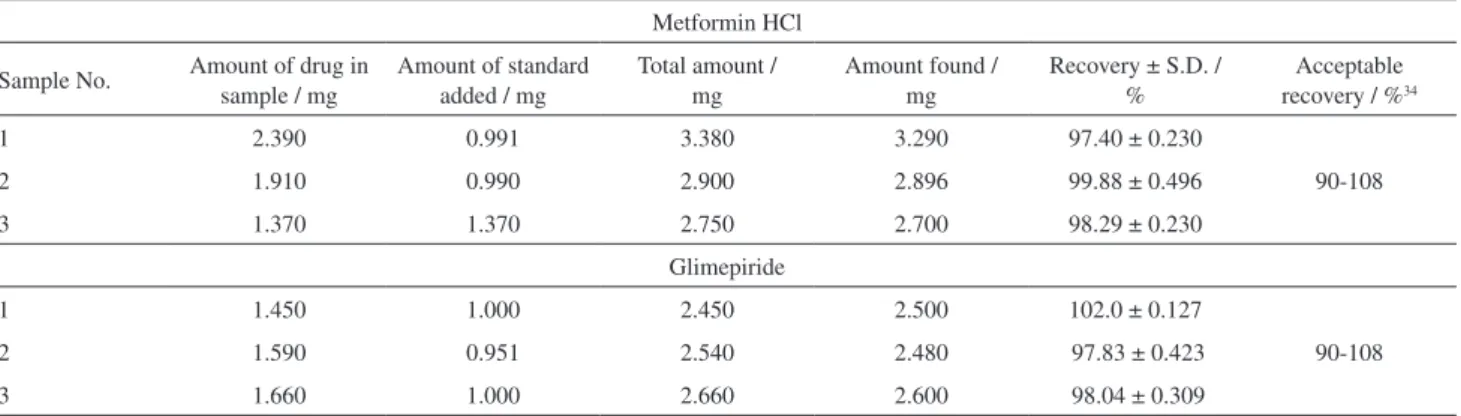
The FTIR methods were further evaluated by standard addition method and results obtained from the study are summarized in Table 2. These were calculated in triplicate
Figure 4. Representative FTIR spectrum of drug sample of glimepiride.
Figure 5. Beer’s Law calibration of glimepiride.
Table 1. FTIR quantification of metformin HCl and glimepiride in pharmaceutical samples by the proposed method
Metformin HCl
Product No. Amount labeleda / mg Amount foundb / mg
Sample 1 500.0 493.5
Sample 2 500.0 504.0
Sample 3 850.0 793.9
Glimepiride
Sample 1 4.000 4.208
Sample 2 4.000 4.000
Sample 3 4.000 4.004
aAmount of Metformin HCl per tablet labeled on package; bmean value
Table 2. Recovery test of metformin HCl and glimepiride by standard addition method
Metformin HCl
Sample No. Amount of drug in sample / mg
Amount of standard added / mg
Total amount / mg
Amount found / mg
Recovery ± S.D. / %
Acceptable recovery / %34
1 2.390 0.991 3.380 3.290 97.40 ± 0.230
90-108
2 1.910 0.990 2.900 2.896 99.88 ± 0.496
3 1.370 1.370 2.750 2.700 98.29 ± 0.230
Glimepiride
1 1.450 1.000 2.450 2.500 102.0 ± 0.127
90-108
2 1.590 0.951 2.540 2.480 97.83 ± 0.423
3 1.660 1.000 2.660 2.600 98.04 ± 0.309
Table 3. Precision data of the method
Metformin HCl
Actual amount 3.380mg Actual amount 2.900mg Actual amount 2.750 mg
Observed / mg Recovery ± S.D. / % Observed / mg Recovery ± S.D. / % Observed / mg Recovery ± S.D. / %
Intraday
3.290 97.40 ± 0.230 2.896 99.88 ± 0.496 2.600 98.04 ± 0.309
Interday
3.310 97.92 ± 0.367 2.910 100.3 ± 0.386 2.700 98.18 ± 0.476
Glimepiride
Actual amount 2.450mg Actual amount 2.540mg Actual amount 2.660
Intraday
2.500 102.0 ± 0.127 2.480 97.83 ± 0.423 2.600 98.04 ± 0.309
Interday
2.400 97.95 ± 0.347 2.500 98.42 ± 0.489 2.675 100.5 ± 0.532
Table 4. Data of ruggedness studies
Metformin HCl
Actual amount 3.380mg Actual amount 2.900mg Actual amount 2.750 mg
Observed / mg Recovery ± S.D. / % Observed / mg Recovery ± S.D. / % Observed / mg Recovery ± S.D. / %
Analyst 1
3.290 97.40 ± 0.230 2.896 99.88 ± 0.496 2.600 98.04 ± 0.309
Analyst 2
3.310 97.92 ± 0.367 2.910 100.3 ± 0.386 2.700 98.18 ± 0.476
Glimepiride
Actual amount 2.450mg Actual amount 2.540mg Actual amount 2.660
Analyst 1
2.500 102.0 ± 0.127 2.480 97.83 ± 0.423 2.600 98.04 ± 0.309
Analyst 2
2.400 97.95 ± 0.347 2.500 98.42 ± 0.489 2.675 100.5 ± 0.532
and mean values are quoted with standard deviation (SD). These results revealed excellent precision and accuracy of developed methods.
to be excellent indicating high degree of precision of the methods. The % recovery was between 97-102% indicating high degree of accuracy.
Conclusions
The present study reported simple, rapid and green methods for the analysis of two antidiabetic drugs, i.e., metformin HCl and glimepiride. Proposed methods are suitable for QC process in pharma industry. Therefore, as compared to other spectroscopic or chromatographic method, this is a direct, inexpensive and green approach in which costly chemicals and toxic solvents are totally avoided. Such types of FTIR applications have a strong potential to replace classical methods in quality assurance /quality control (QA/QC) for the analysis of active contents in pharmaceutical preparations.
Acknowledgements
The authors acknowledge with thanks to Prof M. Iqbal Chaudhary, Director, International Center for Chemical and Biological Sciences, University of Karachi, Karachi for providing the necessary laboratory facilities to accomplish this work.
References
1. Wild, S.; Roglic, G.; Green, A.; Sicree, R.; King, H.; Diabetes Care2004,27, 1047.
2. http://www.nice.org.uk/nicemedia/pdf/cg66niceguideline.pdf accessed in July 2014.
3. Karthik, A.; Subramanian, G.; Mallikarjuna, R. C.; Krishnamurthy, B.; Ranjithkumar, A.; Musmade, P.; Surulivelrajan, M.; Karthikeyan, K.; Udupa, N.; Pak. J. Pharm. Sci. 2008, 21, 421.
4. Sakuntala, M. S. V.; Prasad, S. V. U. M.; Devi, S. S.; Kishore, Yadav; S. K.; Reddy, K. S.; J. Chem and Pharm. Res.2012,4, 154.
5. Al-Rimawi, F.; Talanta2009, 79, 1368.
6. Jain, D.; Jain, S.; Jain, D.; Amin, M.; J. Chromatogr. Sci. 2008,
46, 501.
7. Cheng, C. L.; Chou, C. H.; J. Chromatogr. B. Biomed. Sci. App.
2001, 762, 51.
8. Vesterqvist, O.; Nabbie, F.; Swanson, B.; J. Chromatogr. B. Biomed. Sci. Appl.1998, 716, 299.
9. Melis, V.; Usach, I.; Peris, J.-E. In High-Performance Liquid Chromatography (HPLC): Principles, Practices and
Procedures, Zuo, Y., ed.; Nova Science Publishers, Inc.: New
York, 2014, ch. 4.
10. Bonfilio, R.; Araújo, M. B.; Salgado, H. R. N.; J. AOAC Int.
2013, 96, 960.
11. Mubeen, G.; Noor, K.; Indian. J. Pharm . Sci. 2009, 71, 100. 12. Bhamare, P. C.; Bari, S. B.; Natarajan, S.; Patil, A. A.; Patil,
S. H.; Shirode, P. T.; Asian J. Biochem and Pharm. Res.2011,
1, 115.
13. Loni, A. B.; Ghante, M. R.; Sawant, S. D.; Pharma Chem.2012,
4, 854.
14. Arayne, M. S.; Sultana, N.; Zuberi, M. H.; Siddiqui, F. A.;
Indian J. Pharm. Sci.2009, 71, 331.
15. Umapathi, P.; Ayyappan, J.; Quine, S. D.; Trop. J. Pharm. Res.
2012, 11, 107.
16. Bonfilio, R.; Araújo, M. B.; Salgado, H. R. N.; J. Braz. Chem. Soc. 2011, 22, 292.
17. Induri, M.; Bhagavan, R. M.; Rajendra, P. Y.; Pavankumar, R. K.; E-J. Chem. 2012, 9, 993.
18. Madhuri, D. G.; Res. J. Pharm. Tech.2011,4, 1865.
19. Bhargavi, S.; Suryasagar, G.; Sowmya, D. K.; Ashok, K.; Nama, S.; Int. J. Pharm. Sci. Rev. Res.2013, 21, 131. 20. Kishore, L.; Kaur, N.; Der Pharmacia Lettre 2011,3, 276. 21. British Pharmacopoeia; Stationery Office: London, 2009. 22. The United States Pharmacopoeia, USP 25 rev., The United
States Pharmacopoeia Convention: Rockville, 2002.
23. Bonfilio, R.; de Araújo, M. B.; Salgado, H. R.; Ther. Drug Monit. 2010, 32, 550.
24. Ayala, C.; Brunetto, M. R.; Ovalles, F. Y.; Gallignani, M.; Rev. Téc. Ing. Univ. Zulia2009, 32, 238.
25. Konoz, E.; Hossein, A.; Sarrafi, M.; Samadizadeh, M.; Boreiri, S.; E-J. Chem.2012, 9, 2232.
26. Mallah, M. A.; Sherazi, S. T. H.; Mahesar, S. A.; Rauf, A.; Pak. J. Anal. Environ. Chem. 2011, 12, 61.
27. Mallah, M. A.; Sherazi, S. T. H.; Mahesar, S. A.; Rauf, A.;
J. Chem. Soc. Pak. 2012, 34, 556.
28. Zuo, Y.; Zhang, L.; Wu, J.; Johnathan, W.; Suzanne, F. M., Christopher, R.; Abstracts of Papers of the American Chemical Society, 2005, 229, 130.
29. Prasad, P. R.; Murarilal, K. B.; Rajani, K.; J. Chem. Pharm. Res. 2012, 4, 180.
30. Kogawa, A. C.; Salgado, H. R. N.; Phys. Chem.2013,3, 1. 31. Moreno, A. H.; Salgado, H. R. N.; Phys. Chem. 2012,2, 6. 32. Tótoli, E. G.; Salgado, H. R. N.; Phys. Chem. 2012, 2, 103. 33. Vieira, D. C. M.; Ricarte, P. C.; Salgado, H. R. N.; Adv. Anal.
Chem. 2012, 2, 80.
34. http://www.eoma.aoac.org/app_k.pdf, accessed in August 2014.
Submitted on: June 2, 2014