Article
J. Braz. Chem. Soc., Vol. 25, No. 11, 1984-1992, 2014. Printed in Brazil - ©2014 Sociedade Brasileira de Química 0103 - 5053 $6.00+0.00
A
*e-mail: [email protected]
Kinetic and Thermodynamic Parameters of Biodiesel Oxidation with Synthetic
Antioxidants: Simplex Centroid Mixture Design
Dionisio Borsato,* Diego Galvan, Jaqueline L. Pereira, Juliane R. Orives,
Karina G. Angilelli and Rodolfo L. Coppo
Fuels Analyses and Research Laboratory, Chemistry Department, State University of Londrina, P.O. BOX 10.011, 86057-970 Londrina-PR, Brazil
A inluência da temperatura sobre a oxidação de biodiesel foi avaliada pelos parâmetros cinéticos e termodinâmicos do biocombustível de óleo de soja e gordura suína com antioxidantes sintéticos: 3-terc-butil-4-hidroxianisol (BHA), 3,5-di-terc-butil-hidroxitolueno (BHT), 2-terc -butil-hidroquinona (TBHQ) e galato de propila (PG), de acordo com delineamento de mistura simplex-centróide. Os parâmetros cinéticos foram determinados considerando-se reação de primeira ordem e aplicando a equação de Arrhenius. A adição de antioxidantes promoveu o aumento da energia de ativação (Ea), sendo TBHQ e PG os mais eicientes, apresentando efeito sinérgico. BHT
e BHA foram os menos eicientes, assim como suas misturas. Os parâmetros termodinâmicos de ativação, avaliados pela equação de Eyring, não indicaram processos espontâneos (∆G‡> 0) com
valores de ∆H‡ positivos, e ∆S‡ positivos e negativos. O delineamento simplex-centróide indicou
valor otimizado de 174,46 kJ mol-1 para a mistura contendo 33,33 e 66,67% de TBHQ e PG,
respectivamente.
Temperature’s inluence on biodiesel oxidation was evaluated by kinetic and thermodynamic data in biofuel from soybean oil and lard with synthetic antioxidants: butylatedhydroxyanisol (BHA), butylatedhydroxytoluene (BHT), tert-butylhydroquinone (TBHQ), and propylgallate (PG) by simplex centroid mixture design. The kinetic parameters ware obtained by Arrhenius equation and showed that addition of antioxidants in all tests increased activation energy (Ea) and that TBHQ
and PG were more eficient and presented synergistic effect. BHT and BHA were the least eficient, as well as their mixtures. The thermodynamic activation parameters of the reactions, evaluated by the Eyring equation and based on the theory of the activated complex (ACT), indicated no spontaneous processes (∆G‡> 0) with positive ∆H‡ values and positive and negative ∆S‡ values.
The application of simplex centroid mixture design, using Ea as response, showed the optimised
value of 174.46 kJ mol-1 for a mixture containing 33.33 and 66.67% of TBHQ and PG, respectively.
Keywords: activated complex, synthetic antioxidants, oxidation stability, mixture design
Introduction
The storage stability of a fuel is related to changes in physical and chemical characteristics caused by its interactions with the environment, and these changes can vary according to the nature of the raw material used in the production of biodiesel, specially due the presence/ absence of natural antioxidant in the inal product.1,2 The autooxidation of fatty acid methyl esters (FAMEs) is associated with the oxygen reaction with allylic hydrogens
on their unsaturated chains, resulting in the formation of free radicals and by-products that can cause problems in the engine and injection equipment.3,4 To inhibit or delay the oxidation reaction, antioxidants are used; phenolic compounds, classiied as primary antioxidants, promote the removal or inactivation of free radicals by donating active hydrogen atoms.5,6
which features rapid results, thus, reducing labour time and reagent consumption.8 Monitoring the oxidative stability obtained by Rancimat allows the determination of kinetic and thermodynamic parameters involved in the mechanism of biodiesel oxidation. Data such as energy (Ea), enthalpy (∆H‡), entropy (∆S‡) and Gibbs free energy
(∆G‡) of activation allow the assessment of the eficiency
of antioxidants added in biofuel and also to estimate the storage time, ensuring product quality in the periods of storage, distribution and use.4
The great diversity of raw materials and production techniques results in variations in the physicochemical properties of biodiesel, making it dificult to choose a speciic antioxidant. Therefore, mixing is the most effective and economical way to maintain quality of the biofuel.2,9,10 The development of any product that involves more than one component implies some particular experiments with mixtures. Many studies employing mixture designs follow the models proposed by Scheffe, which allow the exploration of the entire experimental region.9,11,12
Taking into consideration the importance of knowledge about kinetic and thermodynamic parameters and the fact that there are few reports in the literature on this subject, this work aimed to apply mathematical models that describe the oxidation reaction at several temperatures, throughout Rancimat method, with different synthetic antioxidants, alone or in mixtures.
Experimental
Biodiesel
B100 biodiesel was acquired from BioPar - Bioenergia do Paraná Ltda. (Rolândia, Paraná, Brazil), free of antioxidants, obtained by transesteriication with a mixture of soybean oil (90%) and lard (10%), in methylic route using sodium methoxide as catalyst.
Some speciication tests were carried out to determine the lash point (ASTM D93),13 the acid number (ASTM D664)14 and the speciic mass (ASTM D4052)15 of the biodiesel.
Antioxidants
The antioxidants used were butylatedhydroxyanisol (BHA) Synth, 98.50%, butylatedhydroxytoluene (BHT) Synth, 99%, tert-butylhydroquinone (TBHQ) Acros, 97% and propyl gallate (PG) Acros, 98%. All of these analytical grade reagents were added directly to the biodiesel prior to the evaluation of oxidation stability; the proportions were stipulated by mixture design.
The total concentration of antioxidants did not exceed 6.0 × 10⁻³ mol L-1, that corresponds to approximately 0.1% m/m, except PG, which was used at a concentration of 3.0 × 10⁻³ mol L-1 (approximately 0.05% m/m). The choice of antioxidants and their concentrations was made according to preliminary tests.11
Experimental design
A simplex centroid mixture design was applied for four components (TBHQ, BHT, BHA and PG), with two repetitions at the central point with combinations of mixtures 2q–1, where q is the number of components
equal to the sum 1 or 100%.16 The control sample was also performed in triplicate.
Mathematical model
The function used was equation 1:
(1)
where Y is the response function of the experimental data Ea
(kJ mol-1), x
1, x2, x3 and x4 are independent variables which
correspond to the ratios of TBHQ, BHT, BHA and PG in the mixture, respectively, and β represents the estimated parameters.12
Statistical analysis
The optimisation of the conditions, the regression coefficients and analysis of variance (ANOVA) were determined by Statistica Software version 9.0.17
Oxidation stability test and induction period (IP) determination
Tests were carried out using the oxidative stability accelerated method through Rancimat equipment model 873 (Metrohm®, Herisau, Switzerland) according to oficial EN 14112.18 Assays were performed at temperatures of 110, 115, 120 and 125 °C.
The induction period (IP) is determined by automated Rancimat software: a graph of conductivity (μS cm-1)
Determination of kinetic and thermodynamic parameters of the biodiesel oxidation reaction
Data of the electrical conductivity (Λ) vs. time (t), obtained by Rancimat, for all assays of the mixture design and each temperature, were adjusted considering irst-order reactions, so the rate constants (k) could be determined. The parameter activation energy (Ea) and pre-exponential factor (A) were calculated using the Arrhenius equation, while the enthalpy (∆H‡) and entropy (∆S‡) of activation
were obtained by the Eyring equation or activated complex theory (ACT). The Gibbs free energy of activation (∆G‡) was obtained from the fundamental equation of
thermodynamics for all temperatures.4
Chromatographic analysis
Methyl esters, methanol, free and total glycerin, mono-, di- and triglyceride content were determined using a gas chromatograph with a lame ionization detector (GC-FID) system (Shimadzu GC 17A) and a DB1 column (100% polydimethylsiloxane with 30 m length × 0.25 mm internal diameter × 0.25 µm ilm thickness, J&W Scientiic) was employed. The temperatures of split injector and detector were maintained at 340 °C. The oven was maintened initially at 50 °C for 2 min, and then heated at a rate of 10 °C min-1 until 180 °C, maintained at this temperature for 2 min and, inally, heated at a rate of 15 °C min-1 until it reached 340 °C, where it was maintained for 10 min. The carrier gas low, N2, was 1.5 mL min
-1 and the injection
volume was 2.0 µL. Data were acquired and treated by the software Shimadzu CLASS-CR10.
The ester content was determined according to EN 14103,19 where a sample of 0.1 mL of biodiesel was solved in n-heptane (Sigma Aldrich, HPLC-grade) in a proportion of 1:10, using methyl heptadecanoate (Fluka, analytical grade) as internal standard. The alcohol content was veriied according to EN 1411020 using methanol (Fluka, analytical grade) as standard. For analysis of free and total glycerin, mono-, di- and triglyceride content, according to ASTM D6584,21 analytical standards of glycerin (Restek, 500 μg mL-1 in pyridine), monoolein (Supelco, 500 μg mL-1 in pyridine), 1,3-diolein (Restek, 500 μg mL-1 in pyridine), triolein (Restek, 500 μg mL-1 in pyridine) were used.
Results and Discussion
Biodiesel properties and composition
The EN 1421422 standard determines that the acceptable percentage of methyl esters in biodiesel must be equal to
or greater than 96.50% m/m. Chromatographic analysis of biodiesel showed that the content of methyl esters was 98.98% m/m, thus complying with current legislation; 84.82% m/m of this amount was composed of unsaturated esters C18:1, C18:2 and C18:3, at a percentage of 26.98, 50.06 and 7.78%, respectively. High content of unsaturated esters in the composition of biodiesel is assigned to the high content of soybean oil (90%), which was used as raw material. The biodiesel produced had density equal to 879 kg m-3, 167.0 °C of lash point and 0.45 mg
KOH g
-1 of acid
number, all values that meet the product speciications.23 According to Knothe24 biodiesel obtained from vegetable oils are rich in unsaturated fatty acids, making it susceptible to oxidation reaction resulting in low values of induction period (IP).24,25 The average IP value for control was 1.42 h, which is higher than the values of 0.16 h26 and 1.36 h27 of biodiesel obtained from 100% of soybean oil, showing that use of the pig fat may inluence the increase of the oxidative stability. However, the addition of antioxidants is still needed in order for biodiesel to meet speciications,23 of which the minimum value of IP is 6 h.9
Oxidation stability at different temperatures
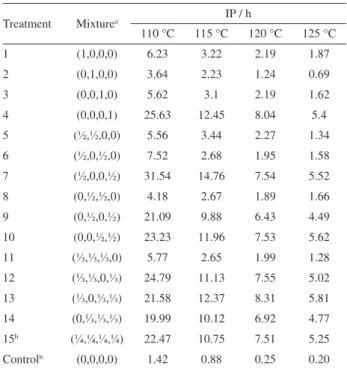
According to Table 1, IP values decreased with increasing temperature and increased with the addition of antioxidants in all treatments, when comparing to the control sample.
Table 1. IP values at different temperatures for each test from simplex centroid mixture design
Treatment Mixturea IP / h
110 °C 115 °C 120 °C 125 °C
1 (1,0,0,0) 6.23 3.22 2.19 1.87
2 (0,1,0,0) 3.64 2.23 1.24 0.69
3 (0,0,1,0) 5.62 3.1 2.19 1.62
4 (0,0,0,1) 25.63 12.45 8.04 5.4
5 (½,½,0,0) 5.56 3.44 2.27 1.34
6 (½,0,½,0) 7.52 2.68 1.95 1.58
7 (½,0,0,½) 31.54 14.76 7.54 5.52 8 (0,½,½,0) 4.18 2.67 1.89 1.66
9 (0,½,0,½) 21.09 9.88 6.43 4.49 10 (0,0,½,½) 23.23 11.96 7.53 5.62
11 (⅓,⅓,⅓,0) 5.77 2.65 1.99 1.28
12 (⅓,⅓,0,⅓) 24.79 11.13 7.55 5.02
13 (⅓,0,⅓,⅓) 21.58 12.37 8.31 5.81 14 (0,⅓,⅓,⅓) 19.99 10.12 6.92 4.77 15b (¼,¼,¼,¼) 22.47 10.75 7.51 5.25
It is observed that BHT used alone (treatment 2), presented the lowest values of IP in all assay temperatures, indicating lower efficiency when compared to other antioxidants, alone or in mixtures. However, it showed higher values than those observed in control samples. All treatments containing PG showed greater values of IP in all temperatures, even though it was added at lower concentration than the other antioxidants. Among the others antioxidants, TBHQ (treatment 1) is the most effective, followed by BHA (treatment 3) and BHT (treatment 2). The best response was achieved in the mixture containing TBHQ and PG, indicating synergism between them. The Tukey test applied to averages showed that IP of treatment 7 presented significant difference related to the responses of these isolated antioxidants (treatments 1 and 4), at a level of 5%.
The higher effectiveness of PG may be attributed to its chemical structure, which is more susceptible to donate hydrogen radical (H•) due to greater stabilization of the radical formed by the ring substituents.28,29 TBHQ has two hydroxyl groups, whereas both BHA and BHT have only one hydroxyl and various substituents, including (–OCH3) and (–CH3) bonded on the para-position of the ring. The hydroxyl group of BHA is more likely to release hydrogens compared to the hydroxyl group of BHT, because this one cannot stabilise its radical by resonance. Additionally, BHA has higher thermal stability than BHT, especially at a temperature of 110 °C.29-31 The structures of the antioxidants are depicted in Figure 1.
Santos et al.31 analysed the thermal proile of synthetic antioxidants at 110 °C, and observed that the stability decreases in the order: PG > TBHQ > BHA > BHT. Maia et al.11 evaluated the oxidative stability of B100 biodiesel from soybean oil, with Rancimat, obtaining similar results when used with TBHQ, BHA and BHT at 110 °C. However, this information must be considered with caution, because the cited biodiesel mixture was stored near room temperature.32
Kinetics and thermodynamics of the oxidation reaction of biodiesel
The rate constants (k) were determined by applying the natural logarithm (ln) on values of electrical conductivity (Λ)
vs. time (t), where the slope and intercept represent k and
ln Λ, respectively. As result, a linear relationship between conductivity and time is shown in equation 2:
lnΛ 0 = k(tf – ti) + lnΛ (2)
where Λ is the conductivity at time t; Λ0 is the initial
conductivity, and ti and tf correspond to initial and inal time, respectively.
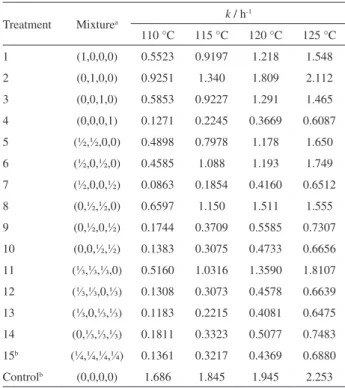
Table 2 presents the average values of k, which showed high coeficients of determination (R2) ranging from 0.9336
to 0.9858. Galvan et al.4 also observed high correlation coeficients for the oxidation of biodiesel obtained from a mixture of vegetable oil and animal fat, considering irst-order reaction kinetics.
According to Table 2, the control presented a value of k, at 125 °C, which is 1.3 times higher than the rate constant at 110 °C. It is observed that the k values increase with increasing temperature for all treatments as consequence of the increase in the rate of consumption of the antioxidant, showing thereby the dependence of the oxidation process with temperature.33
The high k values can be related to the amount of soybean oil used in the production of biodiesel. However, there is a decrease in the values of the rate constants when antioxidants are present; treatment 2 presented the highest
Figure 1. Chemical structures of the investigated antioxidants.
Table 2. Rate constants (k) at different temperatures for all treatments
Treatment Mixturea k / h -1
110 °C 115 °C 120 °C 125 °C
1 (1,0,0,0) 0.5523 0.9197 1.218 1.548
2 (0,1,0,0) 0.9251 1.340 1.809 2.112
3 (0,0,1,0) 0.5853 0.9227 1.291 1.465
4 (0,0,0,1) 0.1271 0.2245 0.3669 0.6087
5 (½,½,0,0) 0.4898 0.7978 1.178 1.650
6 (½,0,½,0) 0.4585 1.088 1.193 1.749
7 (½,0,0,½) 0.0863 0.1854 0.4160 0.6512
8 (0,½,½,0) 0.6597 1.150 1.511 1.555
9 (0,½,0,½) 0.1744 0.3709 0.5585 0.7307
10 (0,0,½,½) 0.1383 0.3075 0.4733 0.6656
11 (⅓,⅓,⅓,0) 0.5160 1.0316 1.3590 1.8107
12 (⅓,⅓,0,⅓) 0.1308 0.3073 0.4578 0.6639
13 (⅓,0,⅓,⅓) 0.1183 0.2215 0.4081 0.6475
14 (0,⅓,⅓,⅓) 0.1811 0.3323 0.5077 0.7483
15b (¼,¼,¼,¼) 0.1361 0.3217 0.4369 0.6880
Controlb (0,0,0,0) 1.686 1.845 1.945 2.253
values of k compared with the others, although they were still lower than those observed for the control. According to Tan et al.34 the k value is directly related not only to the presence or absence of antioxidants, but also with the structures of the fatty acids, as having a high content of unsaturation is partly responsible for increasing the constant.
Kinetic data can be expressed by quantitative relationship between assay temperature, rate constant and activation energy through the Arrhenius equation:34
ln(k) = ln A – Ea/RT (3)
where k is the rate constant (h-1), A the pre-exponential factor (h-1), E
a the activation energy (kJ mol
-1), R the
ideal gas constant (8.31447 J K-1 mol-1) and T the absolute temperature (K).
According to the Arrhenius equation (equation 3), the graph of ln k vs. the reciprocal of temperature (1/T,K-1) plots a line with slope (–Ea/R) and intercept (ln A), which allows determination of Ea and A, respectively.
The oxidation reaction of B100 biodiesel occurs through an energised transitory species of intermediate structure between the reactants and products called activated complex or transition state.4 Thus, the thermodynamic parameters (∆H‡ and ∆S‡) were estimated by applying the
activated complex theory (ACT), developed by Eyring in 1935. The effect of temperature on reaction rate can be interpreted using ACT as described by equation 4, which is analogous to the Arrhenius equation (equation 3):35,36
ln(k/T) = [ln(kB/h) + (∆S‡/R)] – (∆H‡/R)(1/T) (4)
where kB is the Boltzmann constant (1.38065 × 10⁻²³ J K-1),
h is Planck’s constant (6.62608 × 10⁻³⁴ J s), ∆H‡ is the
enthalpy of activation (kJ mol-1), ∆S‡ is the entropy of
activation (J mol-1 K-1) and the notation ‡ refers to the state
of activated complex.
According to the Eyring equation (equation 4), the regression of ln k/T vs. 1/T (K-1) derived from ACT yields a straight line with slope (–∆H‡/R) and intercept
[ln (kB/h) + (∆S‡/R)], which permits the determination of
∆H‡ and ∆S‡, respectively.
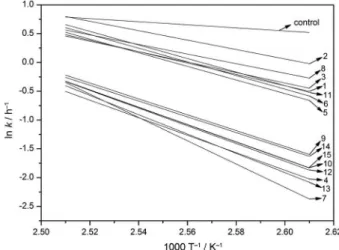
Figure 2 shows the linear regression of the data obtained by equation 3 for each treatment (Table 2); the coeficients of determination varied between 0.8612 and 0.9994. Chen et al.,37Chen and Luo38 and Xin et al.39 obtained a good linear correlation between ln kvs.1/T (K-1) studying the kinetics of oxidation of biodiesel obtained from different raw materials, associated with the use of different synthetic antioxidants.
Considering that Ea is given by the slope, the larger the energy of activation value, the greater the dependence of k
with temperature, that is, the slope is more accentuated in the graph.40,41 Figure 2 depicts that the control presented the smallest slope, indicating that it is more susceptible to oxidation compared to the other treatments containing antioxidants. On the other hand, the treatment with PG presented bigger slopes, particularly when mixed with TBHQ, leading to higher values of Ea and, thus, greater oxidative stability.
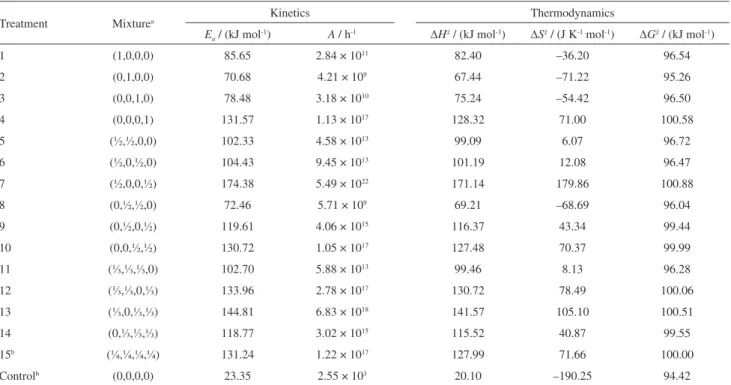
The values of Ea are depicted in Table 3, where the control sample showed the lowest value, followed by the three treatments containing only TBHQ, BHA and BHT. Also, it is observed that there is an occurrence of synergism among the antioxidants when used in mixtures (treatments 5, 6, 7, 11, 12 and 13), because the Eaof the mixtures of antioxidants is greater than the sum of their individual effects. Among the mixtures, Ea of treatment 7 (TBHQ and PG) was about 7.5 times higher than that of the control, followed by the other mixtures with PG (treatments 12 and 13). Among the antioxidants mixture in which PG is absent, treatments 5, 6, 8, and 11, the one containing TBHQ and BHA showed the highest Ea, 4.5 times higher than the control, followed by the other mixtures with TBHQ (treatments 5 and 11).
There is considerable evidence that phenolic antioxidants have synergistic activities, so it is very important to consider these effects when choosing their formulation.11 However, the synergistic effect has not been observed in some mixtures containing BHT and BHA (treatments 8, 9, 10, 14 and 15), and even treatment 8, which showed the lowest value among these mixtures, presented an Ea value 3 times higher than the control. Litwinienko et al.42 reported that the high degree of unsaturation in the chemical chain of biodiesel leads to lower Ea for the oxidation reaction.
The biodiesel used was produced with high percentage of soybean oil and contains high content of polyunsaturated FAMEs , which are more susceptible to oxidation reactions, evidenced by the low value of Ea observed in the control (23.35 kJ mol-1).4,5
The influence of temperature on the reactions is determined by the activation energy. Higher values of Ea
imply that a small change in temperature is required to induce changes in the oxidation rate, whereas reactions with lower values of Ea are relatively independent of temperature.34,40,41 According to Levenspiel,40 reactions with values ranging between 40 and 400 kJ mol-1 are considered low and high activation energy, respectively. Therefore, the oxidation of biodiesel obtained from soybean oil predominantly exhibits poor chemical stability, even in the presence of antioxidants, because the values of the activation energy obtained were not high.32
The biodiesel displayed values of pre-exponential factor (A) varying from 2.55 × 10³ h-1, for control, up to 5.49 × 10²² h-1, for the mixture with TBHQ and PG (Table 3). Chen et al.37 and Chen and Luo38 reported values of 2.21 × 10¹³ and 5.66 × 10¹⁰ h-1, respectively. According to Tan et al.34 small changes in the values of E
a result in
signiicant changes in the pre-exponential factor.
Figure 3 depicts the graph generated by equation 4, through ACT, for the oxidation of biodiesel at different temperatures. The lines presented determination
coeficients (R²) with values between 0.8497 and 0.9994. Galvan et al.4 obtained a similar linear correlation between
ln k/T vs. 1/T (K-1), to evaluate the thermodynamic parameters of the oxidation reaction of an optimised biodiesel from a mixture of vegetable oil and animal fat.
In Table 3, it can be noted that all treatments, including the control, showed positive ∆H‡ values, indicating that
the process is endothermic, i.e., an external source of energy is required to raise the energy level of reagents to their transition state. Thus, the higher the value of
Table 3. Kinetic and thermodynamic parameters for biodiesel oxidation
Treatment Mixturea Kinetics Thermodynamics
Ea / (kJ mol-1) A / h-1 ∆H
‡ / (kJ mol-1) ∆S‡ / (J K-1 mol-1) ∆G‡ / (kJ mol-1)
1 (1,0,0,0) 85.65 2.84 × 10¹¹ 82.40 –36.20 96.54
2 (0,1,0,0) 70.68 4.21 × 10⁹ 67.44 –71.22 95.26
3 (0,0,1,0) 78.48 3.18 × 10¹⁰ 75.24 –54.42 96.50
4 (0,0,0,1) 131.57 1.13 × 10¹⁷ 128.32 71.00 100.58
5 (½,½,0,0) 102.33 4.58 × 10¹³ 99.09 6.07 96.72
6 (½,0,½,0) 104.43 9.45 × 10¹³ 101.19 12.08 96.47
7 (½,0,0,½) 174.38 5.49 × 10²² 171.14 179.86 100.88
8 (0,½,½,0) 72.46 5.71 × 10⁹ 69.21 –68.69 96.04
9 (0,½,0,½) 119.61 4.06 × 10¹⁵ 116.37 43.34 99.44
10 (0,0,½,½) 130.72 1.05 × 10¹⁷ 127.48 70.37 99.99
11 (⅓,⅓,⅓,0) 102.70 5.88 × 10¹³ 99.46 8.13 96.28
12 (⅓,⅓,0,⅓) 133.96 2.78 × 10¹⁷ 130.72 78.49 100.06
13 (⅓,0,⅓,⅓) 144.81 6.83 × 10¹⁸ 141.57 105.10 100.51
14 (0,⅓,⅓,⅓) 118.77 3.02 × 10¹⁵ 115.52 40.87 99.55
15b (¼,¼,¼,¼) 131.24 1.22 × 10¹⁷ 127.99 71.66 100.00
Controlb (0,0,0,0) 23.35 2.55 × 10³ 20.10 –190.25 94.42
aProportions of: TBHQ, BHT, BHA, PG; baverage of triplicate. ∆G‡: average of values at different temperatures (383.15, 388.15, 393.15 and 398.15 K).
enthalpy of activation of biodiesel, the greater the oxidative stability.35,36,43 ∆H‡ values increased with the addition of
antioxidants, when compared with the control: mixtures with presence of PG presented the highest values, followed by their mixtures with TBHQ, demonstrating that these two antioxidants are synergistic with each other and with other antioxidants. This effect was not observed in the presence of treatments with BHT and BHA.
Considering values of entropy (Table 3), both positive and negative signals were obtained for the treatments. Negative ∆S‡ values may arise as a result of association
mechanism; degrees of freedom were lost due to the activated complex formation, which means that reacting species joined themselves to form the state transition during the reaction, thereby having a more ordered state than the reactants in the ground state structure. Positive∆S‡ values
indicate an increase of degrees of freedom, i.e., greater system disorder.35,36
The Gibbs free energy of activation (∆G‡) is used to
determine the spontaneity of chemical reactions, and it was determined for all temperatures by the fundamental thermodynamic equation (equation 5):43
∆G‡ = ∆H‡ – T∆S‡ (5)
Table 3 shows that all samples presented positive values of ∆G‡, indicating that they are endergonic and not
spontaneous. It can also be noted that all treatments with antioxidants showed values of ∆G‡ higher than the control,
with treatment 7 being the most endergonic, followed by treatments with PG in the mixtures. The reaction rate decreases with increasing ∆G‡, however, as the temperature
increases, the reaction rate also increases.35,44
Activation energy (E
a)
As the kinetic parameters were consistent with the thermodynamics, an analysis was carried out with the objective of obtaining a mixture formulation, which yields higher values of Ea(Table 3).
In the canonical equation 6 itted to the experimental data, the dependent variable Y is the activation energy,
Ea (kJ mol-1), in which signiicant terms at the 5% level are shown with an asterisk. Also, the addition of antioxidants positively inluenced the Ea of the studied biodiesel, since most terms had positive coeficients.
Y = 85.69*x1 + 70.72*x2 + 78.52*x3 + 131.61*x4 + 95.31*x1x2 + 88.11*x1x3 + 261.73*x1x4 – 9.83*x2x3 + 72.59*x2x4 + 101.43*x3x4 + 147.47*x1x2x3 –
236.77*x1x2x4 – 78.94*x1x3x4 + 213.95*x2x3x4 (6)
The validity of the model for predictive purposes was conirmed by analysis of variance (Table 4), in which the model is signiicant (p = 2 × 10⁻⁶), with experimental and adjusted coeficients of determination equal to 99.90 and 99.60%, respectively, and with insigniicant regression deviation (p = 0.17).
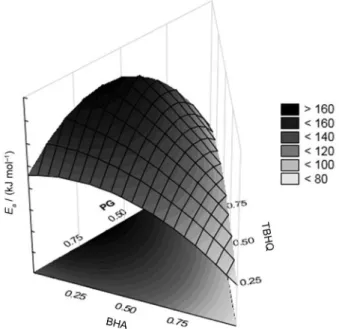
The combination region among the independent variables TBHQ, BHA and PG can be seen in Figure 4, which was generated by setting the least signiicant variable that corresponds to 0% BHT. The boundary region of the response surface demonstrates that an Ea (dependent variable) greater than 160 kJ mol-1 can be achieved using a mixture containing TBHQ and PG.
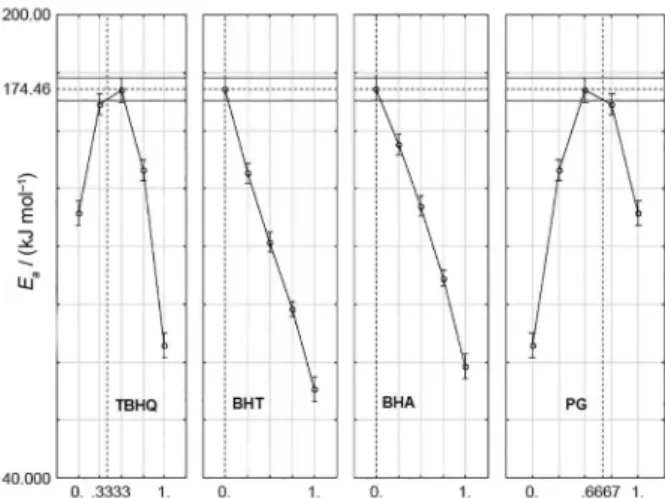
Figure 5 shows the optimisation of the predictive equation that represents the Ea of biodiesel in the presence of synthetic antioxidants. The maximum value (174.46 kJ mol-1) can be obtained when using a mixture containing 33.33% of TBHQ and 66.67% of PG.
Table 4. ANOVA for response Ea
Degrees of freedom
(df)
Sum of squares
Mean
squares F-value p-value
Model 13 12796.99 984.38 348.18 2 × 10⁻⁶
Total error 5 14.14 2.83 – –
Lack of it 1 5.87 5.87 2.84 0.17
Pure error 4 8.26 2.07 – –
Total 18 12811.13 711.73 – –
Figure 5.Ea optimisation for biodiesel with synthetic antioxidants. Conclusions
The Rancimat method was demonstrated to be rapid and appropriate to investigate the kinetic and thermodynamic parameters of oxidation of biodiesel in the presence of synthetic antioxidants, alone or in mixtures. The parameters analysed indicated a low oxidation resistance for B100 biodiesel, however, the addition of antioxidants increased stability in all treatments, and those containing mixtures with PG and TBHQ yielded the best results. The simplex centroid mixture design was found to be a suitable tool to assess the best antioxidant to be added in biodiesel in order to increase its oxidation stability.
Acknowledgements
The authors would like to thank the State University of Londrina (UEL) and CAPES for scholarships.
References
1. Jain, S.; Sharma, M. P.; Biomass Bioenergy2011, 35, 4008. 2. Dinkov, R.; Hristov, G.; Stratiev, D.; Aldayri, V. B.; Fuel 2009,
88, 732.
3. Ramalho, V. C.; Jorge, N.; Quim. Nova2006, 29, 755. 4. Galvan, D.; Orives, J. R.; Coppo, R. L.; Silva, E. T.; Angilelli,
K. G.; Borsato, D.; Energy Fuels2013,27, 6866.
5. Pullen, J.; Saeed, K.; Renewable Sustainable Energy Rev.2012,
16, 5924.
6. Jain, S.; Sharma, M. P.; Renewable Sustainable Energy Rev.
2010, 14, 667.
7. Frankel, E. N.; Trends Food Sci. Technol.1993, 4, 220. 8. Frankel, E. N.; J. Sci. Food Agric.1991,54, 495.
9. Orives, J. R.; Galvan, D.; Coppo, R. L.; Rodrigues, C. H. F.; Angilelli, K. G.; Borsato, D.; Energy Convers. Manage.2014,
79, 398.
10. Guzman, R.; Tang, H.; Salley, S.; Simon Ng, K. Y.; J. Am. Oil Chem. Soc.2009, 86, 459.
11. Maia, E. C. R.; Borsato, D.; Moreira, I.; Spacino, K. R.; Rodrigues, P. R. P.; Gallina, A. L.; Fuel Process. Technol. 2011,
92, 1750.
12. Cornell, J. A.; Experiments with Mixtures - Designs, Models and the Analysis of Mixture Data, 3rd ed.; John Wiley and Sons
Inc: New York, USA, 2002.
13. ASTM D93: Standard Test Methods for Flash Point by Pensky-Martens Closed Cup Tester, Philadelphia,2001.
14. ASTM D664: Standard Test Method for Acid Number of Petroleum Products by Potentiometric Titration, Philadelphia, 2001.
15. ASTM D4052: Standard Test Method for Density, Relative Density, and API Gravity of Liquids by Digital Density Meter, Philadelphia,2002.
16. Calado, V.; Montgomery, D. C.; Planejamento de Experimentos Usando o Statistica; E-papers Serviços Editoriais Ltda: Rio de Janeiro, Brazil, 2003.
17. StatSoft®; Statistica for Windows Software v.9.0; StatSoft Inc.,
United States, 2009.
18. EN 14112: Fat and Oil Derivatives. Fatty Acid Methyl Esters (FAME). Determination of Oxidation Stability (Accelerated
Oxidation Test),European Committee for Standardization, Berlin, 2003.
19. EN 14103: Fat and Oil Derivatives. Fatty Acid Methyl Esters (FAME). Determination of Ester and Linolenic Acid Methyl Ester
Contents, European Committee for Standardization, Berlin, 2003. 20. EN 14110: Fat and Oil Derivatives. Fatty Acid Methyl Esters
(FAME). Determination of Methanol Content, European Committee for Standardization, Berlin, 2003.
21. ASTM D6584: Standard Test Method for Determination of Total Monoglycerides, Total Diglycerides, Total Triglycerides,
and Free and Total Glycerin in B-100 Biodiesel Methyl Esters
by Gas Chromatography, Philadelphia, 2003.
22. EN 14214: Automotive Fuels. Fatty Acid Methyl Esters (FAME) for Diesel Engines. Requirements and Test Methods, European Committee for Standardization, Berlin, 2003.
23. Agência Nacional do Petróleo, Gás Natural e do Biocombustível (ANP); Establishes the Specification for Biodiesel Commercialization in Brazil; Resolution No. 14, 11 May 2012. 24. Knothe, G.; Fuel Process. Technol. 2007, 88, 669.
25. Yang, Z.; Hollebone, B. P.; Wang, Z.; Yang, C.; Landriault, M.;
Fuel Process. Technol.2013, 106, 366.
26. Domingos, A. K.; Saad, E. B.; Vechiatto, W. W. D.; Wilheim, H. M.; Ramos, L. P.; J. Braz. Chem. Soc.2007, 18, 416. 27. Ryu, K.; Bioresour. Technol.2010, 101, S78.
28. Loh, S. K.; Chew, S. M.; Choo, Y. M.; J. Am. Oil Chem. Soc.
2006, 83, 947.
30. Karavalakis, G.; Hilari, D.; Givalou, L.; Karonis, D.; Stournas, S.; Energy2011, 36, 369.
31. Santos, N. A.; Cordeiro, A. M. T. M.; Damasceno, S. S.; Aguiar, R. T.; Rosenhaim, R.; Carvalho Filho, J. R.; Santos, I. M. G.; Maia, A. S.; Souza, A. G.; Fuel 2012, 97, 638.
32. Borsato, D.; Maia, E. C. R.; Dall’Antonia, L. H.; Silva, H. C.; Pereira, J. L.; Quim. Nova2012, 35, 733.
33. Xin, J.; Imahara, H.; Saka, S.; Fuel2009, 88, 282.
34. Tan, C. P.; Man, Y. B. C.; Selamat, J.; Yusoff, M. S. A.; J. Am. Oil Chem. Soc.2001, 78, 1133.
35. Ong, L. K.; Kurniawan, A.; Suwandi, A. C.; Lin, C. X.; Zhao, X. S.; Ismadji, S.; J. Supercrit. Fluids2013, 75, 11.
36. Choi, C. S.; Kim, J. W.; Jeong, C. J.; Kim, H.; Yoo, K. P.;
J. Supercrit. Fluids2011, 58, 365.
37. Chen, Y. H.; Chen, J. H.; Luo, Y. M.; Shang, N. C.; Chang, C. H.; Chang, C. Y.; Chiang, P. C.; Shie, J. L.; Energy2011, 36, 4415.
38. Chen, Y. H.; Luo, Y. M.; Fuel Process. Technol. 2011, 92, 1387. 39. Xin, J.; Imahara, H.; Saka, S.; Fuel2008, 87, 1807.
40. Levenspiel, O.; Chemical Reaction Engineering, 3rd ed.; John
Wiley and Sons Inc: New York, USA, 1999.
41. Atkins, P.; de Paula, J.; Atkins’ Physical Chemistry, 8th ed.;
Oxford Press: New York, USA, 2006.
42. Litwinienko, G.; Daniluk, A.; Kasprzyska-Guttman, T.; Ind. Eng. Chem. Res.2000, 39, 7.
43. Sivakumar, P.; Parthiban, K. S.; Sivakumar, P.; Vinoba, M.; Renganathan, S.; Ind. Eng. Chem. Res.2012, 51, 8992. 44. Boonchom, B.; Kongtaweelert, S.; J. Therm. Anal. Calorim.
2010, 99, 531.
Submitted: May 5, 2014