Allowing repeat winners
Marco D. Huesch
∗Department of Community & Family Medicine
Duke University School of Medicine
Richard Brady
Department of Economics
Duke University
Abstract
Unbiased lotteries seem the least unfair and simplest procedures to allocate scarce indivisible resources to those with equal claims. But, when lotteries are repeated, it is not immediately obvious whether prior winners should be included or excluded. As in design questions surrounding single-shot lotteries, considerations of self-interest and distributive social preferences may interact. We investigate preferences for allowing participation of earlier winners in sequential lotteries. We found a strong preference for exclusion, both in settings where subjects were involved, and those where they were not. Subjects who answered questions about both settings did not differ in their tendency to prefer exclusion. Stated rationales significantly predicted choice but did not predict switching of choices between the two settings.
Keywords: fairness, social preferences, self-interest, lotteries, allocative procedures.
1
Introduction
When scarce, indivisible resources are to be distributed among equally deserving claimants, an unbiased lottery is commonly judged as the least unfair procedure (Stone, 2007).1 But if lotteries are repeated, should earlier
win-ners be included or excluded?
This decision may involve motives of self-interest and/or distributive social preferences.2 On one side,
self-interest might involve consideration of the variance of payoffs from including or excluding earlier winners, or the low probability event of winning twice. Since it is more likely that someone other than the subject will be the winner of the first lottery, it is also compatible with the subject’s self-interest that the other be excluded. This should increase the subject’s chances of winning once.
On the other side, distributive social preferences (Bolton & Ockenfels, 2005), might consider fairness with regard to those who hadn’t won before, or with respect to those who had. On both sides, these motivations may in-teract (Karni & Safra, 2002; Dolan et al., 2003; Dolan et
∗We thank Craig Fox, Steve Lippman and participants in a UCLA
Anderson Brown Bag seminar for formative discussions, and Jon Baron, Rachel Croson and two anonymous reviewers for valuable comments on earlier drafts of this paper. Address: Marco D. Huesch, Duke Fuqua School of Business, 100 Fuqua Drive, Durham, NC 27708-0127. Email: [email protected].
1The operative word is “least”. Keren and Teigen (2010) investigate
preferences for the use of a randomizer in detail and find many condi-tions under which the actual use of a randomizer is strongly opposed even if the abstract idea of using a randomizer is not.
2In our set-up, reciprocal preferences (over player types) are not
fea-sible as actions, intentions or identities of other players are all unknown in this game without strategic interactions (Bolton & Ockenfels, 2000).
al., 2004; Østerdal, 2005; Fehr et al., 2007). In particu-lar, a “moral bias” due to self-interest might color social preferences (Croson & Konow, 2009).
In this note we report on subject preferences for allow-ing repeat winners in free sequential lotteries (i.e. raf-fles). Our study’s focus on probabilistic allocations seeks to add to the large experimental literature on fairness in deterministic allocations (Karni et al., 2008). We follow and adapt an approach used by Konow (2008) and Cro-son and Konow (2009) and attempt to isolate self-interest from distributive social preferences. Questions are posed to subjects under a disinterestedspectatorframing, and under a partisanstakeholderframing.
We find that the majority of participants prefer exclu-sion of repeat winners. Subject preference were similar regardless of spectator-vs.-stakeholder framing. Stated rationales consistent with self-interest did not predict changes in preferences within-subject. In our subjects’ judgment, repeated lotteries are as fair as simple lotter-ies, it appears, as long as prior winners are excluded.
2
Method
2.1
Designs
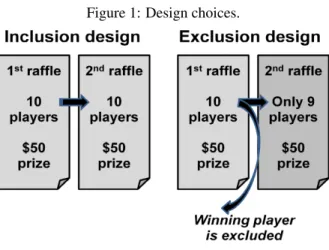
The preferences investigated here are over different de-signs of a back-to-back pair of raffles with 10 identical hypothetical participants (Figure 1). The only difference is that the winner of the first raffle does or does not par-ticipate in the second raffle. Under either design, each participant has a 1 in 10 chance of winning a $50 prize in the first raffle. Allowing repeat participation of the
Figure 1: Design choices.
ner [theinclusiondesign] results in an identical second raffle and a set of possible final payoffs {$0, $50, $100} with probabilities {0.81, 0.18, 0.01} respectively. The expected payoff in this design is $10, with variance 450 square $.
Without the participation of the winner of the first raf-fle [theexclusiondesign], each participant in the second raffle now has a 1 in 9 chance to win a $50 prize. Under this design, the set of possible final payoffs is {$0, $50} with probabilities of {0.80, 0.20} respectively. The ex-pected payoff in this design is also $10,3but the variance
is lower at 400 square $.4
2.2
Data and sampling
We administered an on-line survey to a pool of subjects maintained by the Duke Interdisciplinary Initiative in So-cial Psychology (DIISP) at Duke University. Of 1,469 members of the DIISP pool, 261 agreed to participate in the survey (response rate of 17.8%), of which 6 did not (fully) complete the survey.5 Surveys were completed
anonymously. Subjects were asked to explain their pref-erences in a free text response field. Subjects’ stated ra-tionales were classified by the second author asExpected
3The intuition for the same mean payoffs across the two designs can
best be seen from the principal’s perspective. Under each design the principal disburses a total of $100 randomly to a group of 10 identical participants yielding each an expected payout of $10.
4The intuition for the different variances across the two designs can
most easily be seen by supposing there were only two participants. Then under the exclusion design, each agent must win one and one only time, so the variance is zero. Under the inclusion’ design, either agent may win once, twice or no times, so the variance is strictly positive. Loosely, sampling with replacement is riskier than sampling without.
5The members of the DIISP pool are 40% male; 51% Caucasian,
25% Asian or Asian-American, 16% African-American and 4% Latino. 74% are undergraduate, 13% graduate student and 13% are not students. Highest educational attainment was 5% high school, 2% associate de-gree, 8% bachelor’s, 6% advanced (master’s or higher), and 78% in process of obtaining bachelor’s degree.
valuefor use of any of the following: {expected value, expected return, average return, better off, expected pay-out, expected winnings, expected payoff, expectation} or if the subject multiplied probabilities with dollar amounts in his or her reasoning.
Rationales were classified asDistributionif they refer-enced any of: {better odds, better chance to win, higher maximum payoff, better shot, more chances, better dis-tribution, less people, better opportunity} and they did not combine any of these words with explicit calculation of an expected value amount. Non-statistical reasoning with rationales invoking fairness was coded asInclude for fairnessorExclude for fairnessdepending on preference. Rationales were marked asUnclearif blank or illegible.
2.3
Spectator or stakeholder framings
We asked each subject to express a preference over the designs as a hypothetically implicatedstakeholder. The subject was instructed to assume that the raffles involved him or her and nine other players (Appendix). This was intended to highlight the individual utility domain, although clearly some consideration of social utility is likely to remain.6
Subjects also expressed preferences as a hypothetically impartialspectator. The subject was informed that the raffles involve ten other players not including the subject. This was assumed to isolate the dimension of social wel-fare and suppress considerations of individual utility to some degree. The order of the two different question-naire framings, and within each framing the order of de-signs, was presented randomly across subjects using a random number generator embedded in the web-based survey tool. We combine results and report pooled re-sults across orderings as there were no significant order effects in our pilot surveys.
3
Results
3.1
Overall preferences
In the stakeholder framing where the subject was pre-sumed to be involved in the design, 78% of the respon-dents preferred exclusion (Table 1). A χ2 test of the
distribution of exclusion and inclusion responses versus expected equal distributions revealed a significant differ-ence between the two distributions (p< .001). Similarly, 75% preferred exclusion under the spectator framing with
6We thank an anonymous reviewer for pointing out that, if a subject
Table 1: Number (%) preferring inclusion or exclusion of earlier winner.
Inclusion Exclusion Missing Total
Stakeholder 51 (19.5)
204 (78.2)
6
(2.3) 261
Spectator 63 (24.1)
195 (74.7)
3
(1.2) 261 Note:N= 261 individuals, each asked twice under dif-ferent framing, with order of presentation randomized.
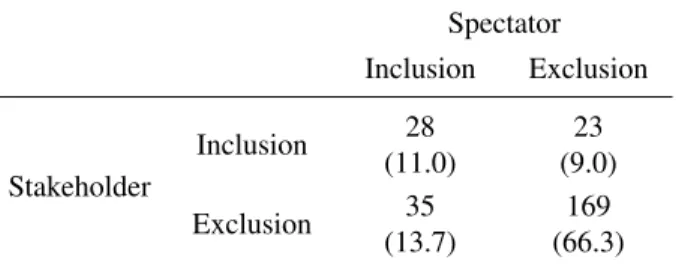
Table 2: Within-subject number (%) preferring inclusion or exclusion of earlier winner.
Spectator Inclusion Exclusion
Stakeholder
Inclusion 28 (11.0)
23 (9.0)
Exclusion 35 (13.7)
169 (66.3) Note: N= 255 individuals excluding blank responses, each asked twice under different framing, with order of presentation randomized.
a similarly significant difference between the observed distributions and expected equal distributions (p< .001).7
3.2
Within-subject comparison
Of the 255 subjects who completed the entire survey un-der both framings, 66% did not change their choice of exclusion while 11% did not change their choice of inclu-sion (Table 2). Of those who chose incluinclu-sion as a hypo-thetical stakeholder, 54.9% (28 of 51) also chose inclu-sion as a spectator. Conversely, of those who preferred exclusion as a hypothetical stakeholder, 82.8% (169 of 204) also chose exclusion as a spectator.
7A similar, smaller pilot survey was administered by the first author
to 45 full-time MBA students at UCLA prior to the large-scale DIISP survey. However, participants in the pilot survey were given a choice of indifference rather than being forced to pick between the two raffle designs in each scenario. Results of this pilot survey were similar to those of the DIISP survey with 67% preferring exclusion (χ2= 10;p=
.002) under the individual perspective, 53% preferring exclusion under the social utility perspective (χ2= 4;p= .046). In this pilot, across
subjects, 3 of 45 chose “indifference” under the stakeholder perspec-tive (7%), while 7 of 45 chose it under the spectator perspecperspec-tive (16%). Within subjects, we had 2 of 45 subjects stating “indifference” under both framings (4%), and 6 stating “indifference” under one of the fram-ings (of which 4 chose “exclusion” under stakeholder framing (9%), 1 chose “inclusion” under stakeholder framing (2%) and 1 chose “inclu-sion” under the spectator framing (2%).
A McNemar test of symmetry did not find that the off-diagonal entries, representing subjects switching choices, differed significantly from each other (χ2= 2.48, 1 d.o.f.; p=.12). Arbitrarily assigning values of 1 to inclusion and 2 to exclusion and using a sign test similarly revealed no significant differences under the two framings (p> .14).
3.3
Rationale-preference associations
We investigated whether the stated rationales (Table 3) predicted choice of inclusion under either framing. Pro-bit regressions showed that stating a rationale of distri-bution reduced the probability of choosing inclusion by 18% (marginal effect, p = .016) compared to not using this rationale. Stating a rationale of expected value in-creased the probability of choosing inclusion by 31% (p
= 0.039) compared to not using this rationale. However, stating a rationale of either distribution or expected value (i.e., claiming to use statistical reasoning) was not sig-nificantly associated with choosing inclusion (marginal effect reduction of 13% points,p> .12).
We expected that subjects who prefer exclusion be-cause they wished to reduce the variance of their own payoffs in the stakeholder frame might act differently in the two framings. Examination of whether the stated ra-tionale predicted likelihood of switching choices under the two settings did not reveal significant associations. Probit regression marginal effects of stating a rationale of distribution reduced the probability of switching choices (from exclusion to inclusion, or vice versa, across the frames) by 12% (p = .073) compared to not using this rationale. Stating a rationale of expected value increased the probability of this switch by 24% (p = 0.087) com-pared to not using this rationale. Stating a rationale of either distribution or expected value (i.e. claiming to use statistical reasoning) was not significantly associated with switching choices (marginal effect reduction of 9% points,p> .24).8
4
Discussion
While an apparently fair single lottery allows equal ac-cess to all participants (Stone, 2007), we find that a re-peated lottery which excludes the prior winner is pre-ferred to one that permits such participation. The study found strong preferences for such exclusion across two framings which attempted to isolate self-interest and dis-tributive social preferences.
In particular, even subjects who invoked statistical rea-soning consistent with a self-interest motivation were not significantly more likely to change their preferences. We
8Computing tetrachoric correlations instead of probit regression
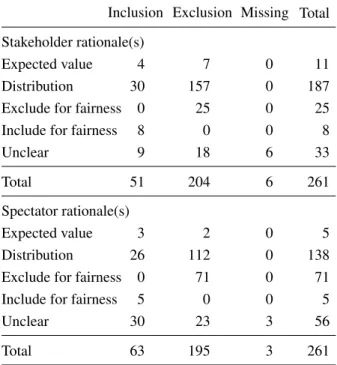
Table 3: Preferences and rationale(s) for inclusion or ex-clusion of earlier winner.
Inclusion Exclusion Missing Total
Stakeholder rationale(s)
Expected value 4 7 0 11 Distribution 30 157 0 187 Exclude for fairness 0 25 0 25 Include for fairness 8 0 0 8
Unclear 9 18 6 33
Total 51 204 6 261
Spectator rationale(s)
Expected value 3 2 0 5 Distribution 26 112 0 138 Exclude for fairness 0 71 0 71 Include for fairness 5 0 0 5
Unclear 30 23 3 56
Total 63 195 3 261
Note: N= 261 individuals, each asked twice under the different framings. Sub-totals of counts of rationales ex-ceed sub-totals of counts of choices since subjects ap-pealing to both statistical reasoning (expected value, dis-tribution) as well as fairness reasoning are counted in both rows.
interpret this as suggesting that subject preferences ap-peared to be driven by social welfare maximization as op-posed to self-interest. An alternative explanation hinges on a subject’s realization that someone other than the sub-ject is more likely to be the winner of the first raffle. Given this, it is entirely compatible with a subject’s per-ceived self-interest to wish to exclude the prior winner and thus increase the subject’s own chance of winning once. In this view, preference for exclusion are not neces-sarily motivated by social welfare maximization as much as self-interest.
Another alternative explanation is that any “moral bias” occasioned by self-interest was not strong enough to change preferences, or that our experimental design did not succeed in isolating the competing motivations of self-interest and distributive social preferences. In our setting, as has been found more generally elsewhere (Dolan & Cookson, 2000; Konow, 2008; Cappelen et al., 2010), subjects were fairly stable in their preferences. Fi-nally, there was also a significant minority of subjects who chose inclusion on the basis of statistical reason-ing, especially distribution (e.g., 30 subjects under the stakeholder framing). These preferences may be
con-sistent with subjects overweighting the low probability event of winning consecutively, in line with the cumula-tive prospect theory deviation from classic expected util-ity theory (Tversky & Kahneman, 1992; Wakker, 2000).
Our study suggests several avenues for further re-search.9 It could be investigated whether other
moder-ating or non-modermoder-ating factors (in addition to self in-volvement) determine elicited preferences. For example, how does our finding of strong preferences for exclusion based on a 10 player raffle hold up in a larger or smaller setting. We speculate that the presence of more players would attenuate the findings here, given the mathemat-ical convergence of the parameters of the designs with increasingn, and the lower probability of winning under any design.
A complementary analysis could examine larger or small hypothetical rewards to understand the moderating effects of a larger expected payoff. Of particular interest is to change the experiment from one involving raffles for rewards to drawing lots for an unpleasant task or a finan-cial penalty. The key question would then be, mirroring the current question, should someone who has “lost” once face the risk of being “punished” twice or should they ob-tain an exemption from further participation?
Finally, we see our results on preferences for repeated probabilistic allocation mechanisms as also relevant to other on-going research on preferences surrounding use of a single randomizer. While we have focused on how self-interest and social preferences might interact in re-peated lotteries, they are presumably also implicated in single shot decisions. For example, the range of prefer-ences that Keren and Teigen (2010) find surrounding the details of actual use of a randomizer (versus the abstract concept of “drawing lots”) suggest similar interesting in-teractions.
4.1
Limitations
We see the most serious limitation of our study as lying in the hypothetical nature of the rewards. A previous (un-reported) pilot study used incentive-compatible rewards and found similar strong preferences, this was unlikely to have represented truly salient rewards.10 Other
limita-tions include the lack of context to the queslimita-tions posed, and the use of predominantly students experimental sub-jects. As Weber and Camerer (2006) point out, lab re-search with students may not concur with the citizenry in general which is relevant to possible applications of our study.
9We thank an anonymous reviewer for these and other suggestions
for further work.
10The design that was majority-preferred was run on the class as a
Subjects choosing between two simple lotteries and any convex combination of the two may prefer to choose mixtures of lotteries rather than the endpoints of a lin-ear lottery set (Sopher & Narramore, 2000). It is thus possible that the exclusion design was favored, since it “creates” two different lotteries which are, in a sense, mixed equally over time. It has also been argued that the generosity to others that is often seen in experiments may be illusory (Dana et al., 2007). Apparent concern for others’ welfare may really represent a preference for not appearing selfish, at least in the stakeholder frame. The stakeholder results here could thus represent a desire by subjects not to seem greedy (by choosing a design which allows participating and winning twice) rather than true concern for fairness, although it is difficult to see how this would apply to the spectator frame. Taste for risk may be moderated by income levels (Bosch-Dome’necha & Sil-vestre, 1999), so it cannot be ruled out that wealth effects produced these results. Similar heterogeneity in prefer-ences for fairness has been related to gender, monetary incentives and motivational context (Kennelly & Fantino, 2007).
4.2
Study implications
Our experiment contributes to a line of theoretical and applied research attempting to isolate self-interest and so-cial preferences motivations (Karni et al., 2008; Croson & Conow, 2009; Cappelen et al., 2010). Our study investi-gated a similar trade-off in probabilistic allocations where strategic interactions were ruled out. Applications of such studies may have most relevance in resource-constrained systems such as healthcare, where rationing of access is routinely by lot, conditional on similar clinical need.
Consider, for example, access to public-subsidized in-vitro fertilization therapy. Should couples be allowed to have repeated access to the chance of receiving a child, if they have already “won” once? Our results add to those of some others (Walker & Siegel, 2002) who suggest that there might be strongly felt preferences for similar allo-cation design choices.
References
Bolton, G. E. & Ockenfels, A. (2000) ERC: a theory of equity, reciprocity and competition. American Eco-nomic Review, 90,166–93.
Bolton, G. E. & Ockenfels, A. (2005) A stress test of fair-ness measures in models of social utility. Economic Theory, 25,957–982.
Bosch-Dome‘necha, A. & Silvestre, J. (1999) Does risk aversion or attraction depend on income? An experi-ment.Economics Letters, 65,265–273.
Cappelen, A. W., Konow, J., Sørensen, E. & Tungod-den, B. (2010) Just luck: an experimental study of risk taking and fairness. http://ssrn.com/abstract=1554965 [7/19/10]
Croson, R. & Konow, J. (2009) Social preferences and moral biases. Journal of Economic Behavior & Orga-nization, 69,201–212.
Dana, J., Weber, R. A. & Kuang, J. X. (2007) Exploiting moral wiggle room: experiments demonstrating an il-lusory preference for fairness. Economic Theory,33, 67–80.
Dolan, P. & Cookson, R. (2000) A qualitative study of the extent to which health gain matters when choosing between groups of patients.Health Policy, 51,19–30. Dolan, P., Olsen, J. A., Menzel, P. & Richardson, J.
(2003) An inquiry into the different perspectives that can be used when eliciting preferences in health.
Health Economics, 12,545–551.
Fehr, E., Klein, A. & Schmidt, K. M. (2007) Fairness and contract design.Econometrica, 75,121–154.
Karni, E. & Safra, Z. (2002) Individual sense of justice: a utility representation.Econometrica, 70,263–284. Karni, E., Salmon, T. & Sopher, B. (2008) Individual
sense of fairness: an experimental study.Experimental Economics, 11,174–189.
Kennelly, A. & Fantino, E. (2007) The Sharing Game: Fairness in resource allocation as a function of incen-tive, gender, and recipient types. Judgment and Deci-sion Making, 2,204–216.
Keren, G. & Teigen, K. H. (2010) Decisions by coin toss: inappropriate but fair.Judgment and Decision Making, 5,83–101.
Kobberling, V. (2009) Program for cal-culating the cumulative prospect theory. http://people.few.eur.nl/wakker/miscella/calculate.cpt. kobb/index.htm [1/16/09]
Konow, J. (2008) The moral high ground: an experimen-tal study of spectator impartiality. http://mpra.ub.uni-muenchen.de/18558/ [7/19/10]
Østerdal, L. P. (2005) Axioms for health care resource allocation.Journal of Health Economics, 24,679–702. Sopher, B. & Narramore, M. (2000) Stochastic choice in decision making under risk: an experimental study.
Theory and Decision, 48,323–350.
Stone, P. (2007) Why lotteries are just. The Journal of Political Philosophy, 15,276–295.
Tversky, A. & Kahneman, D. (1992) Advances in prospect theory: Cumulative representation of uncer-tainty.Journal of Risk and Uncertainty, 5,297–323. Walker, R. L. & Siegel, A. W. (2002) Morality and
the limits of societal values in health care allocation.
Health Economics, 11,265–273.
9,261–263.
Weber, R. A. & Camerer, C. F. (2006) “Behavioral ex-periments” in economics.Experimental Economics, 9,
187–192.
Appendix
Subjects chose their preferred design under stakeholder and spectator framings with framings and designs pre-sented in random order across subjects.11
Stakeholder framing
Suppose you and 9 others will take part in a pair of raffles. You prefer which design?
Design A: In one raffle you have a 1/10 chance to win $50, followed by another raffle in which you again have a 1/10 chance to win $50.
Design B: In one raffle you have a 1/10 chance to win $50. If you didn’t win, you have another raffle in which you now have a 1/9 chance to win $50.
Briefly, any reason why?
Spectator framing
Suppose 10 other people — not including you — will take part in a pair of raffles. You prefer which design?
Design A: In one raffle everyone has a 1/10 chance to win $50, followed by another raffle in which everyone again has a 1/10 chance to win $50.
Design B: In one raffle everyone has a 1/10 chance to win $50. For the nine who didn’t win, they have another raffle in which everyone has a 1/9 chance to win $50.
Briefly, any reason why?
11In the pilot study we attempted to understand the intensity of the