ABSTRACT
Effect of experimental chewing on masticatory
muscle pain onset
Paulo César Rodrigues CONTI1, Rafael dos Santos SILVA2, Carlos dos Reis Pereira de ARAUJO3, Leylha Maria N. ROSSETI4, Shigueharu YASSUDA5, Renato Oliveira Ferreira da SILVA4, Luiz Fernando PEGORARO6
1- DDS, MSc, PhD, Associated Professor, Department of Prosthodontics, Bauru School of Dentistry, University of São Paulo, Bauru, SP, Brazil. 2- DDS, MSc, PhD, Adjunct Professor, Department of Dentistry, State University of Maringá, Maringá, PR, Brazil.
3- DDS, MSc, PhD, Assistant Professor, Department of Prosthodontics, Bauru School of Dentistry, University of São Paulo, Bauru, SP, Brazil. 4- DDS, MSc, PhD, Private Practice, São Paulo, SP, Brazil.
5- DDS, Private Practice, Bauru, SP, Brazil.
6- DDS, MSc, PhD, Professor, Department of Prosthodontics, Bauru School of Dentistry, University of São Paulo, Bauru, SP, Brazil.
Corresponding address: Dr. Paulo César Rodrigues Conti - Faculdade de Odontologia de Bauru - USP - Departamento de Prótese - Al. Octávio Pinheiro Brisolla 9-75 - 17012-901 - Vila Universitária - Bauru- SP, Brasil - Phone: +55 14 32358340 - e-mail: [email protected]
5HFHLYHG0D\0RGL¿FDWLRQ2FWREHU$FFHSWHG2FWREHU
O
bjectives: To evaluate the effect of a chewing exercise on pain intensity and pressure-pain threshold in patients with myofascial pressure-pain. Methods: Twenty-nine consecutive women diagnosed with myofascial pain (MFP) according to the Research Diagnostic Criteria comprised the experimental group and 15 healthy age-matched female were used as controls. Subjects were asked to chew a gum stick for 9 min and to stay at rest for another 9 min afterwards. Pain intensity was rated on a visual analog scale (VAS) every 3 min. At 0, 9 and 18 min, the pressure-pain threshold (PPT) was measured bilaterally on the masseter and the anterior, medium, and posterior temporalis muscles. Results: Patients with myofascial pain reported increase (76%) and no change (24%) on the pain intensity measured with the VAS. A reduction of the PPT at all muscular sites after the following conclusions can be drawn: 1. there are at least two subtypes of patients with myofascial pain that respond differently to experimental chewing; 2. the chewing protocol had an adequate discriminative ability in distinguishing patients with myofascial pain from healthy controls.Key words: Myofascial pain syndromes. Chewing. Palpation.
INTRODUCTION
Pain in the masticatory muscles is the most prevalent symptom associated with temporomandibular disorders (TMD), being present in 88.7% of the affected population6. Function
impairment is also experienced by TMD patients, including reduced chewing ability. Kurita, et al.13
(2001) found a positive correlation between chewing ability and TMJ pain and reduced mouth opening found for noises and muscle tenderness.
Different types of muscle hyperactivity have been associated with muscle pain, among those bruxism, as well as extensive voluntary repeated maximum contractions, innate weakness in the strength of a muscle accentuated by repeated
maximum contractions and continuous use of the muscle18. The overuse of the masticatory muscles
has also been associated with changes in the blood supply, suggesting that ischemia may occur during contraction above a given threshold18.
Lobbezoo-Scholte, et al.14 (1993) studied the
validity of six tests to discriminate patients from control subjects and found that passive opening measurement and palpation were the most useful for this purpose. Dao, Lund and Lavigne5 (1994)
and Gavish, et al.8 (2002) concluded that pain
al.8 (2002) carried out a similar study, increasing
the exercise time and measuring the pain using the Visual Analogue Scale (VAS) over 9 min at rest. They concluded that a strenuous chewing exercise of MFP. In spite of that, the phenomenon of pain reduction in a small percentage of the patients with MFP should be further investigated.
Pressure-pain threshold (PPT) has been extensively used in diagnostic studies19,23 of
myogenic TMDs as well as in therapeutic studies15,
but little is known about the impact of chewing exercises on PPT measurements of symptomatic patients. Farella, et al.7 (2001) evaluated those
!" #$ & '' reduction after the test.
Investigators have used some exercises to induce muscle pain, such as tooth grinding2,
experimental chewing5,8, electromyographically
controlled clenching2,3, and maximal protrusion19.
The literature has demonstrated that muscular hyperactivity exerts an important role as an etiological factor in this pain modality, since a symptomatic muscle pain relief has been observed concomitant to reduction in muscular activity6,17.
The purpose of this study was to test whether there are distinct pain responses to chewing exercise among patients with MFP with mild to moderate pain, and verify whether this protocol could be used to distinguish patients with MFP from control subjects.
MATERIAL AND METHODS
Subjects
The MFP group consisted of 29 consecutive Caucasian women (mean age 29.83±8.43 years, ranged from 18 to 49) selected among those seeking for treatment at the Orofacial Pain Clinic of the Bauru School of Dentistry, University of São Paulo, Brazil. Inclusion criteria followed the diagnostic of MFP (Group Ia), according to the Research Diagnostic Criteria (RDC/TMD)6. Patients
with more than two absent teeth, history of facial or cervical injury, cervical pain or limited range of motion, active periodontal disease or caries, history of general neurological disturbances cervical and/ or masticatory active trigger points were excluded from the study. The diagnosis of TMJ disorders, according to RDC/TMD6 (diagnostic II) were also
an exclusion criterion, although individuals with asymptomatic disc displacement joint (IIa, without pain) concomitant with Ia diagnostic (RDC/TMD6)
were allowed to participate. The patients should not have taken any analgesic medication within 24 h prior to the experimental procedure.
The control group was comprised by 15 asymptomatic Caucasian women (means age 25.47±1.23 years, ranged from 20 to 35) recruited at the regular dental clinics of the Bauru School of Dentistry. None of the subjects had any facial pain complaint or underwent TMD treatment 6 months prior to the experiment. Except for pain, the inclusion criteria for the control group were the same to the used for the MFP group. All participants granted a written informed consent to participate in the study (126/2004).
Experimental Design
All participants filled out the RDC/TMD6
questionnaire and were examined by one of the authors. The digital palpation was carried out with a pressure of 1.0 kgf to the extraoral sites and approximately 0.5 kgf to the intraoral and articular sites, as recommended by the RDC/TMD6.
This pressure was previously calibrated using an algometer (Dinamometer model DDK, Kratos Equipamentos, Cotia, SP, Brazil).
* bias9-11,20,22, palpation of the “lateral pterygoid
area”, though part of the screening evaluation (RDC/TMD6), was replaced by palpation of the deep
portion of masseter, in order to maintain the 20 sites proposed in RDC protocol, as documented in previous studies1,21,23.
Fo l l o w i n g t h e c l i n i c a l e x a m i n a t i o n , a n experimental chewing exercise was performed, + 8 (2002). The
test was performed with the same interval time, though with a different chewing material.
During the sessions of the chewing test, the subjects were seated comfortably in a dental chair, in an upright position and with their heads leaning back on the headrest. Before the chewing test (P0), the participants were asked to indicate their pain intensity on a Visual Analog Scale (VAS), which ranged from 0 mm (“no pain”) to 100 mm (“the <= > ?@H on a separate piece of paper in order to avoid bias of previous VAS records.
With the aid of an algometer, the PPT of the Q= QX= anterior (AT), medium (MT) and posterior temporalis (PT) muscle was also established bilaterally before the test (PPT0). With a rate of application of about 0.5 kg/cm2/s, the pressure was applied until it
became painful. At this point, the participant was instructed to push a hand-held button attached to the algometer, so the amount of pressure was automatically recorded by the device.
SP, Brazil) for 9 min at the preferred side. After that, individuals were instructed to hold their jaws at a rest position (lips together and teeth apart) for additional 9 min, completing the total period test of 18 min.
VAS was recorded again after 3, 6, and 9 min (P3, P6, and P9, respectively) after the beginning of the experiment, and during the rest period at 12, 15 and 18 min (P12, P15, and P18, respectively), while PPT measurements were taken at times 9 (PPT9) and 18 (PPT18).
The Kolmogorov-Smirnov test was used to verify homogeneity in all groups (P<0.05). The student’s
t test (parametric data) and Mann-Whitney test (non-parametric data, P<0.05) were used to verify and MFP groups regarding VAS and PPT. ANOVA for repeated measures and Tukey’s test (parametric data) and Friedman’s test followed by the Student-Z [ Q\]$$"= Q data) were used to verify intragroup differences in different moments of PPT records. The statistical analysis was performed using the SigmaStat 2.0 Q^ H H H ^ CA, USA).
RESULTS
Patients with MFP presented the following values of VAS (present pain: 47.79±22.27 mm; mean pain in the last six months: 50.34±2.03 mm, and maximal pain in the last six months: 67.93±19.34 mm). They had a mean active mouth opening of 45.90±10.95 mm and a mean number of sensitive palpation sites of 8.37±4.73 mm. On the other hand, control group had no pain on the VAS; 45.07±6.55 mm of mean active mouth opening; and a mean number of sensitive palpation sites of $#$_$`{
the differences in VAS pain intensity and in mean number of sensitive palpation sites (p<0.001). opening (p=0.334).
Chewing test
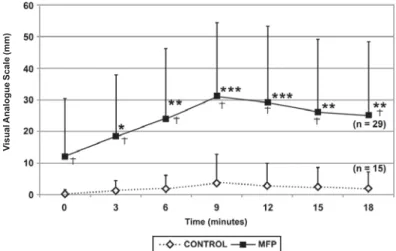
At P9, patients with MFP reported a mean pain increase of 18.79 mm, while controls had an increase of 3.33 mm in VAS records. None of the patients with MFP reported pain reduction, 7 (24%) reported no change in pain (MFP NCP), and 22 (76%) reported an increase (MFP IncP). Within the MFP IncP patients, the mean increase of pain at P9 was 23.59 mm. However, at P12, two additional patients experienced an increase in pain, elevating the percentage of this subgroup to 82.76% (24 subjects) and reducing the percentage of patients who had no change in pain (MFP NCP) to 17.24% (5 subjects). For the control group, 13 (87%) patients had no change in pain and only 2 subjects (13%) experienced pain increase at P9. Data concerning Q?@H= ~ in both groups at the different measurement points are presented in Figure 1.
When applied a Friedman repeated measures ANOVA on ranks on VAS scores of both groups, no statistical difference was found in the control group along the whole experiment (exercise and rest) (Figure 1). Conversely, the MFP group showed a clear increase on pain intensity from P0 up to P9. From this point, a slight decrease in the intensity levels was revealed, but not enough to recover to pre-exercise levels (Figure 1).
pain intensity (P0) between MFP NCP and MFP IncP intensity between these subgroups was found after chewing (p=0.002).
Analysis of covariance of pain levels during
Figure 1- Pain intensity during the chewing test of patients with myofascial pain (MFP) and control subjects. * the same between groups at the same intervals time (intergroup analysis)
V
isual
the chewing experiments yielded the following: a QX'
P=0.002) and for time (p<0.001), but not for activity (chewing or rest). Also a significant interaction between group, activity and time (p]$$!= effect of the chewing activity on the pain level in both groups over time, but do not indicate a Q!=X' group, the pain increased 18.79 mm at P9 and recovered to levels above (13.00 mm) the pre-exercise levels.
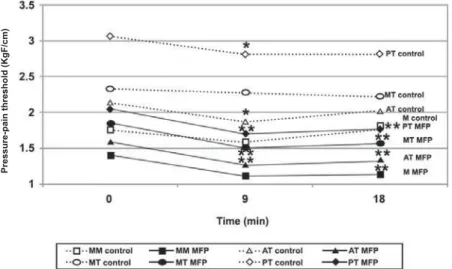
'' MFP than in controls at all recording sites and at all the times (PPT0 to PPT18). Figure 2 shows PPT ~ $ !Q''$ and 18, respectively) of each muscular site of MFP and control group. Data from right and left sides were pooled because PPTs obtained bilaterally in the jaws have been shown to be correlated15. In the
PPT9 were observed only in anterior and posterior temporalis. For the MFP group, PPT9 values were @ period (PPT18), however, the PPT values remained (PPT0) (Figure 2).
Among the patients with MFP, 18 (62.07%) started the exercise with VAS pain between 0 and 5 mm (MFP P0=0). In order to evaluate the weight between MFP P0=0 and those who started with VAS higher than that were made:
Intergroup evaluation: The MFP P0=0 patients showed PPT0 values significantly higher than those who started exercise with EAV greater than 0 (MFP>0); and similar to pre-exercise PPTs of control group. After chewing, MFP P=0 patients '' ''!
X''$ $ group for all recording sites.
Intragroup evaluation: Regarding the masseter muscle, MFP P0=0 showed a pattern similar to X' '$ $ '' At PPT18, the values remained low in comparison to pre-exercise levels. For the AT, MT and PT, MFP '$]$ '' at PPT 18 the values had a trend to recover to PPT0 values, and ended up at intermediate levels between PPT0 and PPT9. Regarding the MFP P>0 subgroup, the PT presented a similar pattern to the M, with PPT18 remaining lower than PPT0. Both the AT and MT showed a tendency of the PPT18 to recover to the PPT0 level, with intermediate levels between PPT0 and PPT9.
X''$]$ despite the elevated PPT0 (similar to controls), presented a particular reaction to the exercise, with a more accentuated decrease in PPT than controls (PPT9 MFP P0=0<PPT control). Even after rest, MFP P0=0 continued to have reduced PPT in relation to the control group.
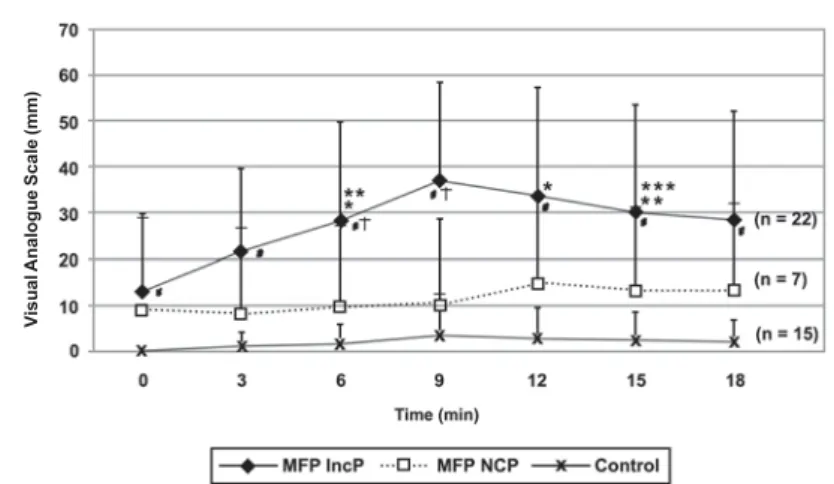
Seven patients with MFP did not present any change in VAS pain (MFP NCP) at P9. Out of those, six presented P0=0 and one had P0= 59 mm (Figure {=~ '' between patients with MFP who had no change in pain versus who had increase in pain.
Intergroup evaluation
PPT 0: The PPT0 of MFP NCP patients were similar to MFP IncP (exception made for the posterior temporalis); and lower than the control group for all muscle sites.
PPT9: At all muscles sites, but the anterior X' Z' '' higher than MFP IncP. Moreover, except the MT and
Figure 2-!! "!#$#! %&' /;
"!< ! ;; "!< !%& %%= >%"= >?"= >"=
'X'Z''' the control group (Figure 3). It means that PPT9 of MFP NCP were in between the control group and MFP IncP.
PPT18:After rest (PPT 18), MPF NCP showed PPT X'' than the control group at all muscle sites but the PT (Figure 4).
Intragroup evaluation
With the exception made for the MT, which PPT9 both subgroups presented similar PPTs evolution pattern along the whole experiment, i.e., PPT9 ''$ ''! lower than PPT0 and similar to PPT9 (Figure 4). That means that, regardless of VAS evolution, the MFP group experienced a decrease of PPT after the exercise, and 9 min of rest are not enough to recover it to pre-exercise levels.
The discriminative ability of the test to distinct patients from controls was demonstrated by a $` $
likelihood ratio (LR+) of 5.69 (CI95: 1.992–31.012), and a negative likelihood ratio (LR-) of 0.28 (CI95: 0.128–0.515). A pre-test probability of 66% (0.66), post-test probability to LR+ of 0.92 (92%) and to LR- of 0.35 (35%) were also found, while the odds ratio (OR) was 20.37. It means that the risk of a person who report increase in pain to have MFP is 0.92 (92%), while the risk of a person who do not change in pain with this protocol to have MFP is 0.35 (35%). Therefore, the relative risk is 2.62. The Chi-square was 15.590 (p=0.000078).
DISCUSSION
Despite the small sample size, the experimental and control groups clearly demonstrated different responses after the experimental chewing. The increase in pain intensity in the MFP group along the chewing exercise was significantly higher when compared to the healthy controls. This fact highlights ultimate differences in pain behavior upon function between healthy subjects and patients with MFP.
Figure 3- Pain during chewing test of patients with myofascial pain who reported a pain increase (MFP IncP), x no change in pain (MFP NCP) an control subjects
V
isual
Analogue Scale (mm)
Figure 4- Pressure-pain threshold (PPT) during chewing test [patients with myofascial pain who reported a pain increase %& E G ! %& HJ/ %%= > %"= >?"= temporalis; PT= posterior temporalis
Gavish, et al.8 (2002) and Dao, Lund and
Lavigne5 (1994) showed mean pain increases of
28.3 e 32 mm, respectively (values above the smallest detectable difference12). In the present
study, this pattern was of 23.59 mm. Differences in the pre-test pain VAS may explain that difference. While the present study obtained mean initial values of VAS of 12.03±18.27 mm (18 patients with pre-exercise VAS=0), Dao, Lund and Lavigne5 (1994)
had 35.2±2.7 mm (all patients with EAV>0) and Gavish, et al.8 (2002) 25.06±26.42 mm.
The frequency of patients which experienced variations in pain intensity during functional exercise was pointed out by earlier studies, as followed: increase in pain (48.3%5 and 84%8); no
change in pain (20%5 and 10%8); and reduction in
pain (31.7%5 e 6%8). In the present study, 76%
of the sample experienced pain increase, and 24% reported no change. None of the individuals are in accordance to Gavish, et al8 (2002) and
could be explained due to similar inclusion criteria, which excluded patients with cervical trigger points and arthralgia. Dao, Lund and Lavigne5 (1994)
hypothesized that the reaction to exercise may be related to the pre-exercise pain level, since the patients who presented a decrease in pain had a level Q""_#$ mm) than those who had an increase in pain (27.5±3.1 mm). Again, the mean low pre-exercise pain level observed in this study could be responsible for the absence of this occurrence. Undoubtedly, this feature limits the comparison with other studies. A more comprehensive sample with patient subgroups for pain intensity (low, mild and = of Dao, Lund and Lavigne5 (1994). Also, to avoid
confounding factors, the present study ruled out individuals with any sign of referred pain due to trigger points, as well as those that had taken any analgesic medication within 24 h prior to the experiment. Thus, a more homogenous sample of patients with MFP with mild (n=18) and moderate (n=11) pain levels was composed.
Among the control subjects, only 2 showed increased VAS after the exercise, while the remaining 13 reported no change in pain intensity. Farella, et al.7 (2001), who reported no change on
VAS in healthy subjects after 40 min of chewing on a soft gum.
Silva, et al.19 (2005) demonstrated cut-off
values of PPT to each of muscular sites evaluated in the present study. They found 1.5, 2.47, 2.75, and 2.77 kgf/cm2 to the superficial masseter
(belly), and the anterior, middle, and posterior $ In the present study all pre-exercise mean PPTs of
patients with MFP were below those cut-off values (1.40, 1.60, 1.85, and 1.94 kgf/cm2 respectively).
However, mean pre-exercise PPTs of control subjects to anterior and middle temporalis stayed just below them (2.13 and 2.32 kgf, respectively), X'
At chewing completion (PPT9), all PPTs of patients with MFP were lower than baseline (PPT0), whereas PPT only for the anterior and posterior temporalis, with subsequent recovery to similar PPT0 levels at ''! of Christensen, et al.4 (1996) and Farella, et al.7
(2001) who gave further evidence that the human jaw muscles in healthy subjects recover quickly after prolonged gum chewing, demonstrating that the amount of masticatory loading did not affect muscle tenderness in healthy subjects.
Based on PPT evolution of the control group, MFP NCP and MFP IncP, it could be assumed that the pain/PPT behavior during the exercise in patients with MFP seems to be associated to the pre-exercise pain (VAS) and PPT levels. Nevertheless, it is not Dao, Lund and Lavigne5 (1994) due to differences
in pre-exercise pain levels.
After chewing (P9), MFP NCP patients, showed a more similar pattern to MFP IncP than to the control group. Despite of this similarity, MFP NCP patients showed PPT9 values statistically greater than MFP IncP. This fact may be explained by the differences ''$ ' (p=0.012 for PT, 0.057 for MM; and 0.051 for AT). The differences in PPT9 values between MFP NCP and IncP patients could be also due to pre-exercise PPT values. Patients with mild VAS pain tend to present a mild VAS pain reaction on to exercise and those with moderate VAS pain trend do present, also, a moderate reaction to exercise. Similarly, the PPT0 values seem to be the main factor to the tenderness exacerbation during function.
Pain stimulation or exacerbation in patients with MFP due to chewing is well demonstrated as one of the most important characteristics of musculoskeletal pain. McMillan and Blasberbg15
Q!#= with MFP. Farella, et al.7 (2001) described that the
exercise-induced pain and fatigue has been related to ischemia and to accumulation of metabolic waste products. Indeed, it has been shown that during ~ may be hampered, probably due to an increased intramuscular pressure and nipping of the vessels entering the muscle. However, Nielsen, et al.18
the anterior temporalis and masseter muscles less often and with lower activity.
The sensitization of muscle nociceptors is probably the peripheral mechanism underlying local tenderness and the pain upon function of a pathologically altered muscle, related to the release of endogenous substances, such as prostaglandin and bradykinin. Central mechanisms also contribute for this event in chronic pain patients, as very well documented16,17.
Despite the presence of some patients with MFP who did not change in pain to exercise, this protocol presented an OR value greater than the majority of combined orthopedic tests in a previous study14. Those authors studied the discriminative
ability of six orthopedic tests and combinations to distinguish different subtypes of TMD (myogenous and arthrogenous). For this reason, it is not possible make any direct comparison with our OR values.
The sensitivity of this test was higher than the minimal acceptable level (0.75) reported by Widmer, Lund and Feine24 (1990). However, the
specificity remained just below the minimum acceptable values of 0.9024
present study (LR and OR) indicate an adequate discriminative ability of this protocol to distinguish patients with MFP from healthy controls. However further studies with a more representative sample of patients with MFP with low, moderate and severe intensities of pain are necessary.
CONCLUSIONS
evidence that: 1) There are at least two subtypes of patients with MFP who can be expected to respond differently to experimental chewing, either with an increase in pain or not; 2) Probably because of different reactions to exercise within the MFP group, this protocol showed an adequate discriminative ability; and 3) The pre-exercise pain/PPT levels ~ '' to exercise in patients with MFP with mild and moderate pain.
ACKNOWLEDGEMENTS
The authors wish to thank the Conselho Nacional de Desenvolvimento Científico e Tecnológico - Z' Q+ 111914/2004-3 to Shigueharu Yassuda).
REFERENCES
1- Bodere C, Tea SH, Giroux-Metges MA, Woda A. Activity of masticatory muscles in subjects with different orofacial pain conditions. Pain. 2005;116(1-2):33-41.
2- Christensen LV. Facial pain and internal pressure of masseter muscle in experimental bruxism in man. Arch Oral Biol. 1971;16:1021-31.
3- Christensen LV. Jaw muscle fatigue and pains induced by experimental tooth clenching: a review. J Oral Rehabil. 1981;8(1):27-36.
4- Christensen LV, Tran KT, Mohamed SE. Gum chewing and jaw muscle fatigue and pains. J Oral Rehabil. 1996;23(6):424-37. 5- Dao TTT, Lund JP, Lavigne GJ. Pain responses of experimental chewing in myofascial pain patients. J Dent Res. 1994;73(6):1163-7.
6- Dworkin SF, LeResche L, Fricton JR, Hollender L, Huggins KH, Mohl ND, et al. Research diagnostic criteria for temporomandibular critique. J Craniomandibular Dis Fac Oral Pain. 1992;6(4):301-55. 7- Farella M, Bakke M, Michelotti A, Martina R. Effects of prolonged gum chewing on pain and fatigue in human jaw muscles. Eur J Oral Sci. 2001;109(2):81-5.
8- Gavish A, Winocur E, Menashe S, Halachmi M, Eli I. Experimental chewing in myofascial pain patients. J Orofac Pain. 2002;16(1):22-8.
9- Jensen R, Olesen J. Reaction paper to chapters 10 and 11. In: Sessle B, Bryant P, Dionne R, editors. Temporomandibular disorders and related pain conditions. Seattle: IASP Press; 1995. p. 193-8.
10- Jensen R, Rasmussen BK, Pedersen B, Lous I, Olesen J. Cephalic muscle tenderness and pressure pain threshold in a general population. Pain. 1992;48(2):197-203.
11- Johnstone D, Templeton M. The feasibility of palpating the lateral pterygoid muscle. J Prosthet Dent. 1980;44(3):318-23. 12- Kropmans TJB, Dijkastra PU, Stegenga B, Stewart R, Bont LGM. Smallest detectable difference in outcome variables related to painful restriction of the temporomandibular joint. J Dent Res. 1998;78:784-9.
13- Kurita H, Ohtsuka A, Kurachina K, Kopp S. Chewing ability as a parameter for evaluating the disability of patients with temporomandibular disorders. J Oral Rehabil. 2001;28(5):463-5. 14- Lobbezoo-Scholte AM, Steenks MH, Faber JAJ, Bosman F. Diagnostic value of orthopedic tests in patients with temporomandibular disorders. J Dent Res. 1993;72:1443-53. 15- McMillan AS, Blasberg B. Pain-pressure threshold in painful jaw muscles following trigger point injection. J Orofac Pain. 1994;8(4):384-90.
16- Mense S. Considerations concerning the neurobiological basis of muscle pain. Canad J Physiol Pharmacol. 1991;69(5):610-6. 17- Mense S, Simons DG. Muscle pain: understanding its nature diagnosis and treatment. Baltimore: Lippincott Williams & Wilkins; 2001.
18- Nielsen IL, McNeill C, Danzig W, Goldman S, Levy J, Miller AJ. Adaptation of craniofacial muscles in subjects with craniomandibular disorders. Am J Orthod Dentofacial Orthop. 1990;97(1):20-34.
19- Santos-Silva R, Conti P, Lauris J, Silva R, Pegoraro L. Pressure pain threshold in the detection of masticatory myofascial pain: an algometer-based study. J Orofac Pain. 2005;19(4):318-24. 20- Stratmann U, Mokrys K, Meyer U. Clinical anatomy and palpability of the inferior lateral pterygoid muscle. J Prosthet Dent. 2000;83:548-54.
21- Svensson P, Bak J, Troest T. Spread and referral of experimental pain in different jaw muscles. J Orofac Pain. 2003;17(3):214-23. 22- Türp J, Minagi S. Palpation of the lateral pterygoid region in TMD - where is the evidence? J Dent. 2001;29(7):475-83. 23- Visscher CM, Lobbezoo F, Naeije M. Comparison of algometry and palpation in the recognition of temporomandibular disorder pain complaints. J Orofac Pain. 2004;18(3):214-9.