Journal of Interdisciplinary Medicine 2019;4(2):77-86
CORRESPONDENCE
Monica Tarcea
Department of Community Nutrition University of Medicine, Pharmacy, Science and Technology
Str. Gheorghe Marinescu nr. 38 540139 Târgu Mureș, Romania Tel: +40 744 791 967
E-mail: monica.tarcea@umftgm.ro
ARTICLE HISTORY
Received: February 22, 2019 Accepted: April 16, 2019
Perception of Healthy Eating
among Romanian Adults
Oana-Cristina Cînpeanu
1, Monica Tarcea
2, Paul Cojan
3, Daniel Iorga
3, Peter Olah
4, Raquel P.F. Guiné
51 “Dr. Gheorghe Marinescu” County Hospital, Târnăveni, Romania
2 Department of Community Nutrition and Food Safety, University of Medicine, Pharmacy, Science and Technology, Târgu Mureș, Romania 3 Mureș County Public Health Authority, Târgu Mureș, Romania
4 Department of Informatics and Biostatistics, University of Medicine, Pharmacy, Science and Technology, Târgu Mureș, Romania 5 CI&DETS/CERNAS Research Centres, Polytechnic Institute of Viseu, Portugal
DOI: 10.2478/jim-2019-0008 ABSTRACT
Background: Totaling about 60% of all causes of death, chronic illnesses are the main cause
of global mortality. Unhealthy behaviors, such as unbalanced eating or insufficient physical activity, can trigger metabolic changes, manifested by hypertension, high blood sugar, hy-perlipidemia, obesity. These changes are grouped into the category of metabolic risk factors. Over time, these factors can cause cardiovascular diseases associated with a high mortality rate. Aim of the study: To evaluate the perception of healthy eating in a Romanian population.
Material and methods: We applied a validated online questionnaire aimed to investigate
peo-ple’s attitude towards diet and their motivation regarding food consumption in ten countries, based on an international project. For the present paper, we evaluated a Romanian sample of 821 adult respondents. Results: Most of the subjects (82.82%) were from an urban area, and 68.94% were women. Regarding the prevalence of chronic diseases, 3.53% of participants had cardiovascular disease, 6.69% had high cholesterol levels, 7.18% were obese, and 6.57% were suffering from high blood pressure. Significant correlations have been identified be-tween calorie count, excessive sugar and salt consumption, gender variables, cardiovascular disease, obesity, and high blood pressure. Also, tradition is very important in relation to eating behaviors, being highly correlated with obesity. The general direction of answers was correct, even if half of the questionnaire items were formulated in a ‘negative’ way, and disagreement is needed for a consistent response with a correct perception of healthy diets. The overall perception of healthy eating was consistent with scientific information in the field.
Conclu-sion: Women are generally better informed than men regarding healthy eating. Also, there
is a possible conflict between traditional food-related cultural values and modern nutritional guidelines based on scientific information.
Keywords: healthy food, chronic diseases, diet, cardiovascular diseases, obesity
Oana-Cristina Cînpeanu • Str. Victor Babeș nr. 2,
545600 Târnăveni, Romania. Tel: +40 265 446 161
Paul Cojan • Str. Gheorghe Doja nr. 34, 540342 Târgu
Mureş, Romania. Tel +40 265 260 695
Daniel Iorga • Str. Gheorghe Doja nr. 34, 540342
Târgu Mureş, Romania. Tel +40 265 260 695
Peter Olah • Str. Gheorghe Marinescu nr. 38, 540139
Târgu Mureș, Romania. Tel: +40 265 215 551
Raquel P.F. Guiné • Av. Cor. José Maria Vale de
Andrade s/n,Campus Politécnico Santa Maria, 3504-510 Viseu, Portugal. Tel: +351 232 480 700
INtROduCtION
A balanced diet with a healthy nutritional intake is a protective factor against all forms of malnutrition and most non-communicable diseases (NCDs) including cardiovascular diseases, diabetes, stroke, and various types of cancer.1,2
On the other hand, an unhealthy diet, combined with an insufficient level of physical activity, is a major risk to the health of the person. In order to reduce this risk, a healthy diet is required, even before conception.3 Breastfeeding
supports the healthy development of children, improving their cognitive development and reducing the risk of over-weight and obesity, as well as that of developing NCDs during adulthood.4
For a healthy life, caloric intake should be kept in bal-ance with energy consumption. Studies show that fat in-take should be kept below 30% of the total caloric inin-take in order to avoid overweight. It is also advisable to consume predominately unsaturated fats at the expense of saturated ones and to avoid industrial trans fats as much as possible.5
One of the diseases associated with an unhealthy diet is type 2 diabetes, which can be prevented or its onset de-layed by maintaining a healthy diet and an adequate lev-el of daily physical activity, by maintaining body weight within normal limits, and by avoiding smoking. Regular screening, along with treatment measures for associated complications, are also part of the management of type 2 diabetes.6
A healthy diet involves reducing sugar consumption be-low 10% of the total caloric intake; additional health bene-fits can be achieved by reducing sugar consumption below 5%.7 Salt consumption is also important in maintaining a
healthy diet; studies show that optimum salt intake is less than 5 g per day. Keeping salt intake below this level con-tributes to preventing the onset of high blood pressure (HBP) and implicitly to reducing the risk of cardiovascular diseases and stroke in adults.8,9
As part of a series of global efforts to achieve a healthy life, the World Health Organization (WHO) has set the goal to reduce salt consumption by 30%, and to halt the upward trend in the incidence of diabetes and obesity in adolescents and adults and to reduce the prevalence of overweight in children by 2025.10
Both individual and population health are influenced by a number of genetic, environmental, social, and behavioral factors. The latter have a direct influence on health and are the easiest to change.11 Modern lifestyle has induced
certain behavioral patterns related to nutrition, physical activity, and the consumption of harmful substances that contribute to the emergence of health risk factors such as HBP, high cholesterol, or excess weight. These risk factors lead to the onset of cardiovascular disease or various can-cers, thus increasing premature mortality. These two types of diseases are the predominant cause of premature death in Europe. Furthermore, eating behavior disorders and an unhealthy lifestyle facilitate the onset of a wide range of
NCDs, thus affecting the quality of life of the entire popu-lation.
Eating behavior, and lifestyle in general, are also in-fluenced by the cultural, social, and economic patterns of the micro- and macro-groups a person belongs to. Ac-cording to studies conducted in Western Europe, in recent decades, economic growth seems to have induced an im-provement in lifestyle only within a socio-economically disadvantaged population, suggesting that these groups are in a position to more easily adopt a series of behaviors that lead to a healthier life.12
WHO studies show that the increasing rate of global mortality is associated with a number of major risk fac-tors such as HBP, high blood glucose, insufficient physical activity, and smoking (active or passive).13 Contemporary
diet is not one that can be considered healthy, and there is a certain degree of awareness regarding this in the general population, most people acknowledging that many foods in the daily basket contain large amounts of food addi-tives. Most of the chicken meat currently on the market has a high content of estrogenic hormones, which repre-sents a risk factor for the appearance of uterine cancer in girls and breast cancer in boys. Much of the food currently consumed globally is genetically modified. This leads to changes in the genetic matrix of the human population, which causes a number of hormonal disturbances among children, including an increase in the prevalence of infant obesity.14–16
Due to genetic changes in wheat and the use of food ad-ditives, currently marketed bread does not contain enough nutrients. The high level of gluten in flour is associated with the appearance of several conditions such as irritable bowel syndrome, intestinal inflammation, malabsorption, various deficiencies, or various types of anemia. The high starch content of genetically modified wheat makes a large amount of bread consumed by the population lead to the occurrence of conditions such as overweight, obesity, de-pression, and high triglyceride levels.
Food preparation can also adversely affect consumer health. Frying foods in oils used for a long period of time leads to their contamination with carcinogenic and even neurotoxic substances.
One of the most visible effects of our unhealthy contem-porary lifestyle is the increasing prevalence of obesity, and fast food contributes significantly to this phenomenon. This type of diet is rich in saturated fats and salt, contribut-ing to an increased risk of cardiovascular disease among consumers.
The aim of this study was to evaluate the perception of healthy eating in a Romanian population. There is a
wide range of information on this topic on various com-munication channels (internet, newspapers, magazines etc.), and not all are necessarily based on scientific evi-dence. Also, Romanian tradition promotes a high-calo-rie, sugar-rich diet, with a large amount of food at the main meals. In this context, it is of interest to evaluate the perception of people in our country of healthy eating by investigating the extent to which this perception is in accordance with modern scientific evidence of the field of dietetics.
In addition to a general assessment, we consider that it is also of interest to investigate population subgroups, selected according to a number of food-related criteria. Women’s eating habits differ from those of men, an ur-ban diet is not similar to that in rural areas, and the level of education can also influence the perception of a healthy lifestyle.
MAtERIAL ANd MEtHOdS
We used a validated complex questionnaire comprised of 26 questions aimed at investigating people’s attitude to-wards diet and their motivation regarding food consump-tion in ten countries. The quesconsump-tionnaire was developed in a project coordinated by the CI&DETS Research Center of the Polytechnic Institute of Viseu, Portugal (PROJ/ CI&DETS/2016/0008: EATMOT).
For the present paper, we used the results obtained in Romania, by applying the questionnaire to 821 respon-dents in 2018. All participants were adults, and they an-swered the questionnaire voluntarily, after informed con-sent. The application of the questionnaire was done online, respecting the anonymity of the subjects who participated in the study.
The data thus obtained has been centralized and con-verted into a spreadsheet format using a convenient coding of the answers provided by the participants.
Sections 1–4 of the questionnaire collected demograph-ic data, while sections 16–20 focused on the perception of healthy food by investigating the extent to which this per-ception is in accordance with modern scientific evidence regarding diet. The questions addressed the presence of chronic diseases among participants and their perception of possible links between diet and chronic diseases, their perception of healthy eating in general, and the sources of information they use in relation to healthy eating. This information was supplemented by general information regarding gender, level of education (gymnasium, high school, or college/university), and living environment (ur-ban, subur(ur-ban, or rural).
Regarding the three relevant sections of the question-naire, Section 16 aimed to gather information about pos-sible chronic diseases the study participants were suffering of. They were asked to answer the question “Do you suffer from any chronic disease?”. We focused on four conditions present among the answers: cardiovascular disease, high cholesterol, hypertension, and obesity.
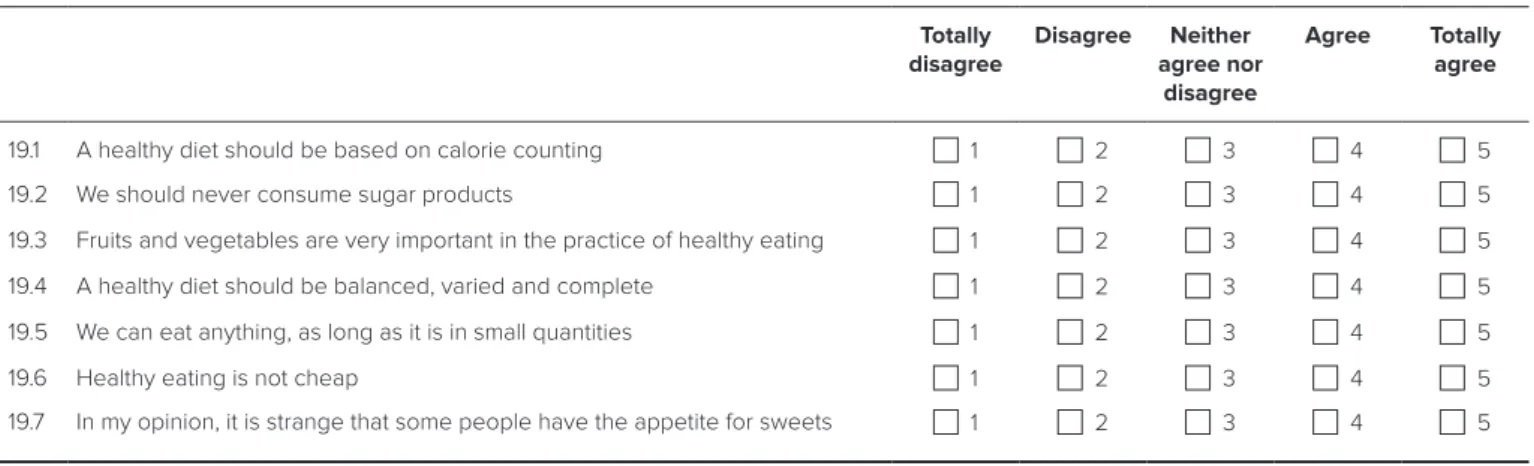
Section 19 of the questionnaire included 10 questions regarding the respondents’ perception of healthy eating. A 5-level Likert scale was used to collect the answers, which were coded with numbers from 1 to 5, 1 for ‘to-tal disagreement’ and 5 for ‘to‘to-tal agreement’. The neutral point of the scale was score 3, which suggests a non-in-volvement with the subject. The questions were formu-lated in a ‘positive’ or in a ‘negative’ way: questions where the correct answer was represented by a score higher than 3 or answers such as ‘agree’ or ‘strongly agree’, were considered to be ‘positive’ (questions 3, 4, 5, 6, and 9).
TABLE 1. Section 19 of the questionnaire (respondents’ perception of healthy eating)
19. Please indicate, on the scale below, between ‘Totally Disagree’ and ‘Totally Agree’, your opinion on the following statements
Totally disagree Disagree Neither agree nor disagree Agree Totally agree
19.1 A healthy diet should be based on calorie counting 1 2 3 4 5
19.2 We should never consume sugar products 1 2 3 4 5
19.3 Fruits and vegetables are very important in the practice of healthy eating 1 2 3 4 5
19.4 A healthy diet should be balanced, varied and complete 1 2 3 4 5
19.5 We can eat anything, as long as it is in small quantities 1 2 3 4 5
19.6 Healthy eating is not cheap 1 2 3 4 5
Conversely, questions where the correct answer was rep-resented by a score lower than 3, or ‘disagreement’ or ‘to-tal disagreement’, were considered to be ‘negative’ (ques-tions 1, 2, 7, 8, and 10). Question 8, “Do you believe that tradition is very important for a healthy nourishment?”, could be interpreted as ‘positive’ or ‘negative’ depending on the country or region where the questionnaire was ap-plied. For Romania, given the fact that most traditional dishes are rich in saturated fats or sugars, we considered this item to be ‘negative’.
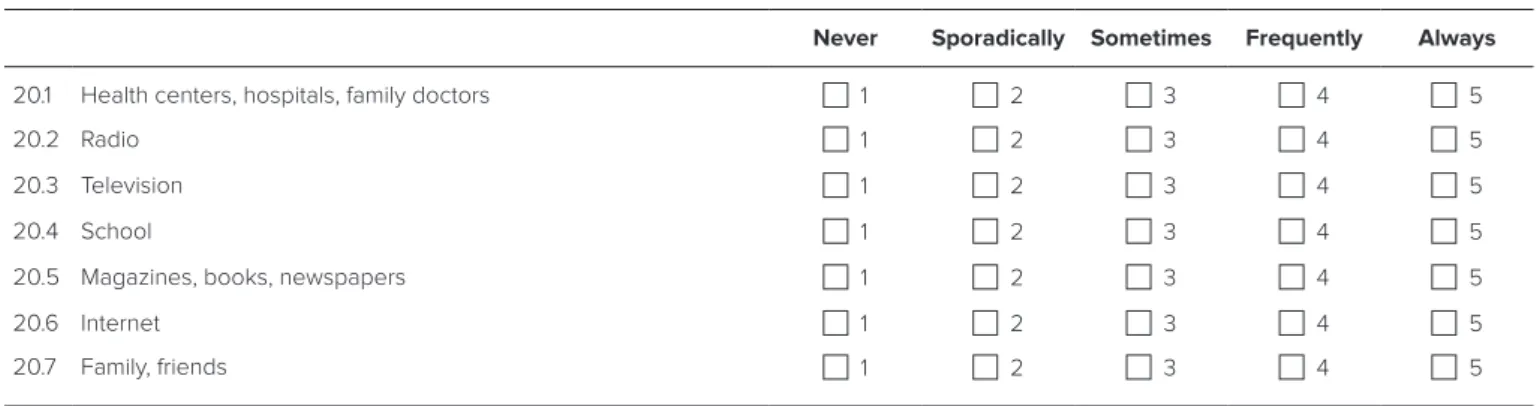
Section 20 aimed to gather information about informa-tion sources predominantly used by participants to obtain information on healthy eating. The question asked in these section was: “Where do you usually find information about adopting a healthy diet?”. A 5-level Likert scale coded with numbers from 1 to 5 (1 for ‘never’ and 5 for ‘always’) was used to collect the answers.
To analyze the responses gathered with the question-naires, we used several descriptive statistical indicators. Thus, the average and the standard deviation of the scores obtained for each question in sections 19 and 20 were cal-culated.
We also sought to investigate the possible impact of the following respondent-related factors: respondent gen-der (male, female), education level (general school, high school, university), living environment (urban, suburban, rural), and the presence of chronic diseases or conditions (cardiovascular diseases, high cholesterol level, obesity, HBP).
Average response scores and standard deviations were calculated for each of the above groups. In order to identify significant relationships between the variables we studied, we used the contingency tables and the Chi-square test. The significance threshold used was 5%, the differences being considered significant for p <0.05. Cramer’s V test was used to assess the strength of statistical significance.
Data centralization was done using Microsoft Excel 2013. Statistical processing was performed using IBM SPSS Sta-tistics v.20 (IBM Corp., Armonk, NY, USA).
RESuLtS
Socio-demographic data
The total number of respondents was 821. Of these, 255 (31.05%) were men and 566 (68.94%) women. Regard-ing the level of education, 9 (1%) respondents finished elementary school, 173 (21.07%) were high school gradu-ates, and 639 (77.83%) had higher education. Most of the participants, 680 (82.82%) came from urban areas, 114 (13.88%) from rural areas, and 27 (3.28%) from a suburban environment.
As far as the prevalence of chronic diseases is concerned, 29 of the participants stated that they suffered from cardio-vascular disease, 55 participants had high cholesterol lev-els, 59 were obese, and 54 suffered from HBP (Figure 1).
TABLE 2. Section 20 of the questionnaire (sources of information on healthy eating) 20. Where do you usually find information about adopting a healthy diet?
Never Sporadically Sometimes Frequently Always
20.1 Health centers, hospitals, family doctors 1 2 3 4 5
20.2 Radio 1 2 3 4 5
20.3 Television 1 2 3 4 5
20.4 School 1 2 3 4 5
20.5 Magazines, books, newspapers 1 2 3 4 5
20.6 Internet 1 2 3 4 5 20.7 Family, friends 1 2 3 4 5 15% 28% 30% 27% Cardiovascular disease High cholesterol Obesity Hypertension
FIGURE 1. The prevalence of chronic diseases in the study
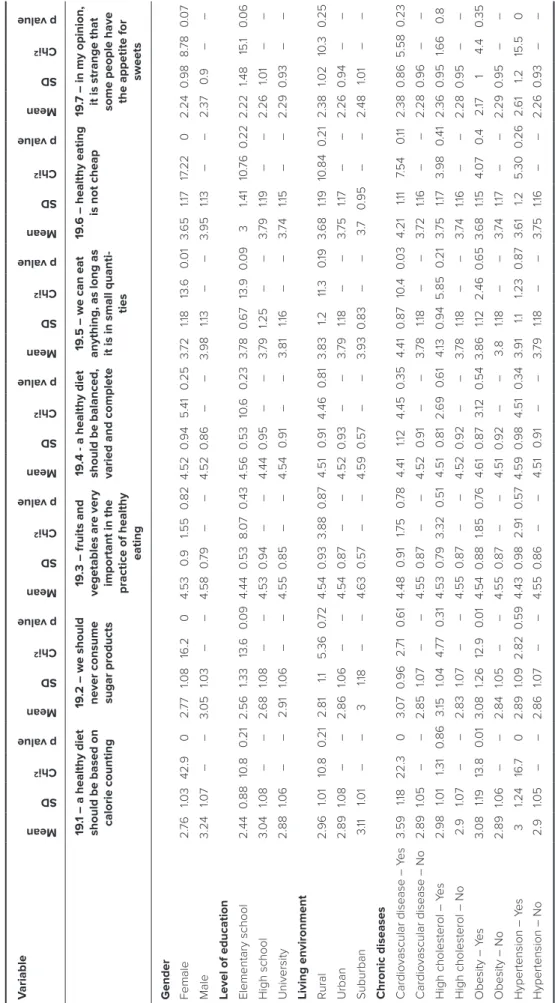
T
ABLE 3.
The link between questions in section 19 (perception of healthy eating) and different variables
V ariable Mean SD Chi 2 p value Mean SD Chi 2 p value Mean SD Chi 2 p value Mean SD Chi 2 p value Mean SD Chi 2 p value Mean SD Chi 2 p value Mean SD Chi 2 p value 19 .1 – a healthy diet
should be based on calorie counting
19
.2 – we should
never consume sugar products
19
.3 – fruits and
vegetables are very important in the practice of healthy
eating
19
.4 - a healthy diet
should be balanced, varied and complete
19
.5 – we can eat
anything, as long as it is in small quanti
-ties
19
.6 – healthy eating is not cheap
19
.7 – in my opinion, it is strange that some people have the appetite for
sweets Gender Female 2. 76 1.03 42.9 0 2. 77 1.08 16.2 0 4.53 0. 9 1.55 0 .82 4.52 0 .94 5.41 0 .25 3. 72 1.18 13. 6 0.0 1 3. 65 1.17 17 .22 0 2.24 0 .98 8. 78 0.0 7 Male 3.24 1.07 – – 3. 05 1.03 – – 4.58 0 .7 9 – – 4.52 0 .86 – – 3.98 1.13 – – 3.95 1.13 – – 2.37 0. 9 – – L
evel of education Elementary school
2.44 0 .88 10 .8 0 .21 2.56 1.33 13. 6 0.0 9 4.44 0 .53 8. 07 0 .43 4.56 0 .53 10.6 0 .23 3. 78 0.6 7 13.9 0.0 9 3 1.41 10 .76 0 .22 2.22 1.48 15. 1 0.0 6 High school 3. 04 1.08 – – 2. 68 1.08 – – 4.53 0 .94 – – 4.44 0 .95 – – 3. 79 1.25 – – 3. 79 1.19 – – 2.26 1.01 – – University 2.88 1.06 – – 2.91 1.06 – – 4.55 0 .85 – – 4.54 0 .91 – – 3.81 1.16 – – 3. 74 1.15 – – 2.29 0 .93 – –
Living environment Rural
2.96 1.01 10 .8 0 .21 2.81 1.1 5.36 0 .7 2 4.54 0 .93 3.88 0 .87 4.51 0 .91 4.46 0 .81 3.83 1.2 11.3 0 .19 3. 68 1.19 10 .84 0 .21 2.38 1.02 10 .3 0 .25 Urban 2.89 1.08 – – 2.86 1.06 – – 4.54 0 .87 – – 4.52 0 .93 – – 3. 79 1.18 – – 3. 75 1.17 – – 2.26 0 .94 – – Suburban 3. 11 1.01 – – 3 1.18 – – 4. 63 0 .57 – – 4.59 0 .57 – – 3.93 0 .83 – – 3 .7 0 .95 – – 2.48 1.01 – –
Chronic diseases Cardiovascular disease – Y
es 3.59 1.18 22.3 0 3. 07 0 .96 2. 71 0.6 1 4.48 0 .91 1.75 0 .7 8 4.41 1.12 4.45 0 .35 4.41 0 .87 10 .4 0.0 3 4.21 1.11 7.54 0 .11 2.38 0 .86 5.58 0 .23 Cardiovascular disease – No 2.89 1.05 – – 2.85 1.07 – – 4.55 0 .87 – – 4.52 0 .91 – – 3. 78 1.18 – – 3. 72 1.16 – – 2.28 0 .96 – – High cholesterol – Y es 2.98 1.01 1.31 0 .86 3. 15 1.04 4. 77 0 .31 4.53 0 .7 9 3.32 0 .51 4.51 0 .81 2. 69 0.6 1 4. 13 0 .94 5.85 0 .21 3. 75 1.17 3.98 0 .41 2.36 0 .95 1.66 0. 8 High cholesterol – No 2.9 1.07 – – 2.83 1.07 – – 4.55 0 .87 – – 4.52 0 .92 – – 3. 78 1.18 – – 3. 74 1.16 – – 2.28 0 .95 – – Obesity – Y es 3. 08 1.19 13.8 0.0 1 3. 08 1.26 12.9 0.0 1 4.54 0 .88 1.85 0 .7 6 4. 61 0 .87 3. 12 0 .54 3.86 1.12 2.46 0.6 5 3. 68 1.15 4. 07 0. 4 2. 17 1 4.4 0 .35 Obesity – No 2.89 1.06 – – 2.84 1.05 – – 4.55 0 .87 – – 4.51 0 .92 – – 3.8 1.18 – – 3. 74 1.17 – – 2.29 0 .95 – – Hypertension – Y es 3 1.24 16. 7 0 2.89 1.09 2.82 0 .59 4.43 0 .98 2.91 0 .57 4.59 0 .98 4.51 0 .34 3.91 1.1 1.23 0 .87 3. 61 1.2 5.30 0 .26 2. 61 1.2 15.5 0 Hypertension – No 2.9 1.05 – – 2.86 1.07 – – 4.55 0 .86 – – 4.51 0 .91 – – 3. 79 1.18 – – 3. 75 1.16 – – 2.26 0 .93 – –
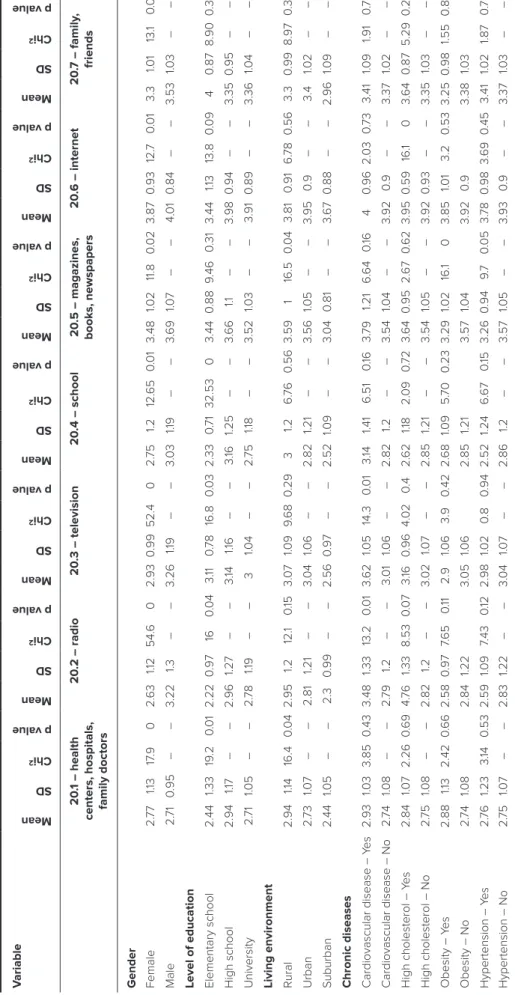
T
ABLE 4.
The link between questions in section 20 (sources of information on healthy eating) and different variables
V ariable Mean SD Chi 2 p value Mean SD Chi 2 p value Mean SD Chi 2 p value Mean SD Chi 2 p value Mean SD Chi 2 p value Mean SD Chi 2 p value Mean SD Chi 2 p value 20 .1 – health
centers, hospitals, family doctors
20 .2 – radio 20 .3 – television 20 .4 – school 20 .5 – magazines, books, newspapers 20 .6 – internet 20 .7 – family , friends Gender Female 2. 77 1.13 17 .9 0 2. 63 1.12 54. 6 0 2.93 0 .99 52.4 0 2. 75 1.2 12. 65 0.0 1 3.48 1.02 11.8 0.0 2 3.87 0 .93 12. 7 0.0 1 3.3 1.01 13. 1 0.0 1 Male 2. 71 0 .95 – – 3.22 1.3 – – 3.26 1.19 – – 3. 03 1.19 – – 3. 69 1.07 – – 4. 01 0 .84 – – 3.53 1.03 – – L
evel of education Elementary school
2.44 1.33 19 .2 0.0 1 2.22 0 .97 16 0.0 4 3. 11 0 .7 8 16.8 0.0 3 2.33 0 .7 1 32.53 0 3.44 0 .88 9 .46 0 .31 3.44 1.13 13.8 0.0 9 4 0 .87 8.90 0 .35 High school 2.94 1.17 – – 2.96 1.27 – – 3. 14 1.16 – – 3. 16 1.25 – – 3. 66 1.1 – – 3.98 0 .94 – – 3.35 0 .95 – – University 2. 71 1.05 – – 2. 78 1.19 – – 3 1.04 – – 2. 75 1.18 – – 3.52 1.03 – – 3.91 0 .89 – – 3.36 1.04 – –
Living environment Rural
2.94 1.14 16.4 0.0 4 2.95 1.2 12. 1 0 .15 3. 07 1.09 9.6 8 0 .29 3 1.2 6. 76 0 .56 3.59 1 16.5 0.0 4 3.81 0 .91 6. 78 0 .56 3.3 0 .99 8.97 0 .34 Urban 2. 73 1.07 – – 2.81 1.21 – – 3. 04 1.06 – – 2.82 1.21 – – 3.56 1.05 – – 3.95 0. 9 – – 3.4 1.02 – – Suburban 2.44 1.05 – – 2.3 0 .99 – – 2.56 0 .97 – – 2.52 1.09 – – 3. 04 0 .81 – – 3. 67 0 .88 – – 2.96 1.09 – –
Chronic diseases Cardiovascular disease – Y
es 2.93 1.03 3.85 0 .43 3.48 1.33 13.2 0.0 1 3. 62 1.05 14.3 0.0 1 3. 14 1.41 6.51 0 .16 3. 79 1.21 6. 64 0 .16 4 0 .96 2. 03 0 .7 3 3.41 1.09 1.91 0 .7 5 Cardiovascular disease – No 2. 74 1.08 – – 2. 79 1.2 – – 3. 01 1.06 – – 2.82 1.2 – – 3.54 1.04 – – 3.92 0. 9 – – 3.37 1.02 – – High cholesterol – Y es 2.84 1.07 2.26 0.6 9 4. 76 1.33 8.53 0.0 7 3. 16 0 .96 4. 02 0. 4 2. 62 1.18 2. 09 0 .7 2 3. 64 0 .95 2. 67 0.6 2 3.95 0 .59 16. 1 0 3. 64 0 .87 5.29 0 .26 High cholesterol – No 2. 75 1.08 – – 2.82 1.2 – – 3. 02 1.07 – – 2.85 1.21 – – 3.54 1.05 – – 3.92 0 .93 – – 3.35 1.03 – – Obesity – Y es 2.88 1.13 2.42 0.6 6 2.58 0 .97 7. 6 5 0 .11 2.9 1.06 3.9 0 .42 2. 68 1.09 5. 70 0 .23 3.29 1.02 16. 1 0 3.85 1.01 3.2 0 .53 3.25 0 .98 1.55 0 .82 Obesity – No 2. 74 1.08 2.84 1.22 3. 05 1.06 2.85 1.21 3.57 1.04 3.92 0. 9 3.38 1.03 Hypertension – Y es 2. 76 1.23 3. 14 0 .53 2.59 1.09 7.43 0 .12 2.98 1.02 0. 8 0 .94 2.52 1.24 6. 67 0 .15 3.26 0 .94 9 .7 0.0 5 3. 78 0 .98 3. 69 0 .45 3.41 1.02 1.87 0 .7 6 Hypertension – No 2. 75 1.07 – – 2.83 1.22 – – 3. 04 1.07 – – 2.86 1.2 – – 3.57 1.05 – – 3.93 0. 9 – – 3.37 1.03 – –
Perception of healthy eating
In the section assessing the perception of healthy eating, average response rates and abnormalities within each group were calculated according to the criteria of inter-est of the study: gender, level of education, living envi-ronment, and the presence of one of the targeted chronic diseases (cardiovascular disease, high cholesterol, obesity, HBP).
Question 19.1 – “A healthy diet should be based on calo-rie counting”, has statistically significant links (p <0.05) between gender, cardiovascular disease, obesity, and hy-pertension.
Question 19.2 – “We should never consume sugar prod-ucts”, identified significant links between gender and obe-sity.
Questions 19.3 and 19.4 – “Fruits and vegetables are very important in the practice of healthy eating” and “A healthy diet should be balanced, varied and complete”, showed no significant links between the variables covered in this study.
Question 19.5 – “We can eat anything, as long as it is in small quantities”, showed significant links between gender and cardiovascular diseases.
Question 19.6 – “Healthy eating is not cheap”, identified significant links between this question and gender.
Question 19.7 – “In my opinion, it is strange that some people have the appetite for sweets”, identified significant links between this question and hypertension.
Sources of information on healthy eating
Section 20 of the questionnaire aimed to gather data re-garding preferred sources of information on healthy eat-ing. For each item in this section, the average response rates and deviations in each group of participants were calculated according to the criteria of interest in the study: gender, level of education, living environment, and the presence of one of the targeted chronic diseases (cardio-vascular disease, high cholesterol, obesity, HBP).
Item 20.1 – “Health centers, hospitals, family doctors” – Significant links were found between this item, female gender, level of education, and rural environment.
Item 20.2 – “Radio” – Statistically significant links have been identified between radio listeners, female gender, level of education, and cardiovascular disease.
Item 20.3 – “Television” – Significant links have been identified between this item, female gender, level of educa-tion, and cardiovascular disease.
Item 20.4 – “School” – Significant links between school, female gender, and level of education were identified.
Item 20.5 – “Magazines, books, newspapers” – Signifi-cant data were registered between this item, female gen-der, obesity, and hypertension.
Item 20.6 – “Internet” – We found significant differenc-es between internet preferencdifferenc-es, female gender, and high cholesterol levels.
Item 20.7 – “Family, friends” – We had a significant com-paring data between this item and female gender (Table 2).
dISCuSSIONS
Analyzing the response score averages for each question, we observed some general trends in the respondents’ per-ception of healthy eating and their preferences for infor-mation sources on the subject. Thus, in Section 19 of the questionnaire, the general direction of the answers was in line with the ‘direction’ in which the questions were for-mulated: ‘positive’ questions (3, 4, 5, 6, and 9) obtained average scores above the neutral value of 3, and ‘negative’ questions (1, 2, 7, 8, and 10) obtained averages below 3.
Analyzing the results obtained for the different groups of participants, we note that there were significant differ-ences between answers to a series of questions. In the fol-lowing, we will detail some of these differences, while try-ing to argue the reasons for their occurrence.
In Section 19 of the questionnaire, assessing the respon-dents’ perception of healthy eating, the response scale has a neutral point between the ‘Agree’ or ‘Disagree’ op-tions, corresponding to the ‘three’ score in our coding. In this context, the significant differences between the age scores of the different groups for which the two aver-ages are located on both sides of the neutral value 3 are particularly interesting. In these situations, the average of a group’s responses tends towards an ‘agreement’ with the content of the question, while the average of the other group’s responses tends to a ‘disagreement’.
For the question “A healthy diet should be based on calorie counting”, there was a significant difference be-tween the average of the answers given by women (2.76) and men (3.24). Women tend to disagree with this state-ment, while men tend to agree with it. We can attribute this difference to the fact that in Romania, the preparation of household food is made mostly by women, therefore they are better informed regarding healthy eating than men. Women tend to be more involved in nutrition issues, have a better knowledge of food and nutrition, are more prone to follow a diet, and are more likely to perceive hav-ing to lose weight.17 Other significant differences that place
two groups on two opposite parts of the neutral point of the scale were found in respondents suffering from
cardio-vascular disease (3.59) vs. respondents who did not suffer from this type of disease (2.89), as well as obese (3.08) vs. non-obese (2.9) respondents. These differences may oc-cur as a result of the diets prescribed for the participants suffering from these two conditions. These diets probably involve a reduction in caloric intake, which justifies the concern of the two groups in this direction.
In case of “We should never eat sugar products”, simi-larly to the previous question, there were also significant differences between women and men (2.77 vs. 3.05), and between obese and non-obese respondents (3.08 vs. 2.84). We consider the potential causes to be similar: the fact that women are better informed on healthy eating and the ef-fects of prescribed diets for obese patients.18
For questions “Fruits and vegetables are very impor-tant in the practice of healthy eating” and “A healthy diet should be balanced, varied and complete”, no significant differences were found between the studied groups. All of the groups have achieved averages over 4, indicating their members’ agreement with the statements in question. The two statements coincide with the main messages trans-mitted in the media (radio, television, and the Internet) through programs promoting healthy eating,and the high scores obtained suggest that these messages have an im-pact on the perception of the population.19
In the case of the question “We can eat anything, as long as it is in small quantities” there were significant differenc-es between the averagdifferenc-es of women’s and men’s rdifferenc-esponsdifferenc-es, as well as of respondents’ with and without a cardiovascu-lar disease. The averages of the four groups were all above the neutral point, showing their consent with the asserted claim. This type of message, regarding the control of the quantities of food consumed, also occurs in campaigns promoting healthy eating, but not so often as the previous two messages. This is reflected in the averages of the scores obtained, which are lower than the averages calculated for questions 19.3 and 19.4.
The question “Healthy eating is not cheap” also shows a significant difference between women and men, but the averages denote the agreement of both groups with the assertion (3.65 and 3.95, respectively). There are two ob-servations to be made regarding this question. First, re-spondents with elementary school as their highest form of education got an average of only 3.00, which overlaps with the neutral answer ‘neither agree nor disagree’. We assume these are very young participants, who are not yet involved in the economic management of the diet. Second, the aver-age of respondents suffering from a cardiovascular disease (4.21) is the only one over 4.00 of all groups (although the difference is not statistically significant compared to
re-spondents without a cardiovascular disease). We can inter-pret this high value as it relates to the cost of recommended diets for this type of affection.20
Regarding the question “In my opinion, it is strange that some people have appetite for sweets”, there were no differences that would place the groups in antagonistic positions. There was a significant difference between re-spondents with and without hypertension, but both values denote disagreement with the statement (2.61 vs. 2.26, re-spectively). All groups expressed their disagreement with the statements, as shown by their scores below 3.
To the question “I think tradition is very important for a healthy diet”, most of the groups obtained average scores that disagree with this statement. There is, however, a no-table exception. There was a statistically significant differ-ence between obese and non-obese respondents, which places the two groups in antagonistic positions. Thus, obese participants obtained an average of 3.10, indicating to some extent an agreement with the statement, while non-obese participants obtained an average of 2.69, indi-cating disagreement with the statement. In this context, we can interpret the result as being related to the cultural values of our country, which influence eating behavior to-wards a hypercaloric diet. This type of cultural value most likely makes its effects felt before the diagnosis of obese patients. It may also conflict with the recommendations made by dietitians to this type of patient.21
In case of the “I think biologically produced foods are healthier” item, all groups of study participants have agreed with the statement. There was a statistically signifi-cant difference between the averages of women’s and men’s responses (3.91 vs. 4.00, respectively), but both values are well above the neutral point, denoting the agreement of both groups with this item. In this case, we can also sider that this type of information effectively reaches con-sumers through media channels.
In case of the item “We should never drink fat products”, there were three significant differences between score av-erages, which place certain groups in antagonistic posi-tions over this claim. Women obtained a score that denotes disagreement with this item (2.49), while men obtained a slightly higher average than the neutral value (3.09), the difference being statistically significant. We can attribute this difference to the greater awareness of women in the field of nutrition in the context of their predominant role in the preparation of the family diet.
Significant differences also occurred between cardio-vascular patients (3.55) and those who were not diagnosed with this type of disease (2.64), as well as between respon-dents with high cholesterol (3.02) and responrespon-dents with
normal cholesterol (2.65). A strict diet is recommended for these two conditions, the recommendation being made by a physician. Generally, fat reduction is recommended without providing detailed information about the type of fat to be avoided. From here, a non-discriminatory percep-tion of these types of patients can arise over dietary fats, a perception reflected in the answers to this item of the questionnaire.
Also, there were significant differences between obese (2.32) and normal-weight respondents (2.70), as well as between respondents with hypertension (2.44) and re-spondents with normal tension (2.69). However, averages values denote the disagreement of these groups with the statement. These types of illnesses are usually chronic, re-quiring longer diets, and we can assume that this enables patients to be better informed on healthy eating, possibly even dieting.
In Section 20 of the questionnaire, regarding the re-spondents’ preferred sources of information on healthy eating, we can see that the main sources of information are the Internet, magazines, family and friends, and television. Analyzing the differences in score averages among the different groups of respondents, we can see that men are more informed through radio and television than women, similar results being obtained in patients with and without cardiovascular diseases. Out of all the assessed sources of information, the Internet has obtained the highest average scores. Given that the questionnaire was completed exclu-sively online, we can consider that the respondents had a common profile: above average education, from urban areas, and with access to the internet – which can also be considered a bias.
A healthy diet is a priority for reducing chronic diseas-es, including obesity, diabetdiseas-es, cardiovascular disease, and many cancers. This is particularly important for socio-ec-onomically disadvantaged populations with limited access to healthy diets and a higher risk of disease. The availability and cultural acceptability of healthy foods are obstacles to promoting a healthy diet.22 Documented evidence
sug-gests that women are more inclined to buy environmen-tally friendly foods than men and also tend to adopt behav-iors aimed at improving and/or maintaining a good health status, compared to men.23
In today’s society, with ‘fast’ lifestyles where people hardly seem to find the time to do everything they wish to, the demand for convenience foods has grown. Many factors can justify this growing trend, such as changes in household structure, intensification of female employ-ment, response of the food industry, marketing campaigns and advertisements, availability of kitchen technology
compatible with cooked or pre-cooked meals, individual-ism, lack of time, or poor cooking skills.24–27
CONCLuSIONS
The overall perception of healthy eating in the Romanian population we studied is consistent with scientific informa-tion and appears to be influenced by the mainstream messag-es that are transmitted through media channels. This shows that this type of communication and messages have an impact on the perception of the population. In the future, these digi-tal health interventions could be used to provide more de-tailed information about a healthy diet, for better outcomes.
Our results suggest that women are generally better in-formed than men regarding healthy eating. It has also been shown that there is a possible conflict between traditional food-related cultural values and modern guidelines based on scientific information in the field of diet.
Data from certain categories of patients reveal the ten-dency to follow the diet recommended for the conditions they are suffer from. This may be due to a lack of more de-tailed information on certain aspects of healthy eating. In-creasing the number of dietitians to reach a critical mass, as well as a greater presence of these specialists in the public health system could correct this deficiency.
CONfLICt Of INtERESt
Nothing to declare.
ACkNOwLEdGEMENt
This work was prepared in the ambit of the multinational project fiber from CI&DETS research center (IPV - Viseu, Portugal) with reference PROJ/CI&DETS/2014/0001.
EtHICAL AppROvAL
The patients signed a written informed consent, and the study procedures were performed according to the ethical principles stated in the Declaration of Helsinki. The study was also approved by the Ethics Committee of CI&DETS, reference no. 03/2015.
REfERENCES
1. Mozaffarian D. Dietary and Policy Priorities for cardiovascular disease,
diabetes, and obesity – a comprehensive review. Circulation. 2016;133:187-225.
2. World Health Organization. Diet, nutrition and the prevention of chronic diseases. Report of joint WHO/FAO expert consultation. WHO
Technical Report Series, No 916. https://www.who.int/dietphysicalactivity/ publications/trs916/intro. (14 February 2019)
3. Stephenson J, Heslehurst N, Hall J, et al. Before the beginning: nutrition and lifestyle in the preconception period and its importance for future health. Lancet. 2018;391:1830-1841.
4. Greer FR, Sicherer SH, Burks AW. Effects of early nutritional interventions on the development of atopic disease in infants and children: the role of maternal dietary restriction, breastfeeding, timing of introduction of complementary foods and hydrolyzed formula. Pediatrics. 2008;121:183-191. 5. Liu AG, Ford NA, Hu FB, Zelman KM, Mozaffarian D, Kris-Etherton PM. A
healthy approach to dietary fats: understanding the science and taking action to reduce consumer confusion. Nutr J. 2017;16:53.
6. Sami W, Ansari T, Butt NS, Ab Hamid MR. Effect on a diet on type 2 diabetes mellitus: a review. Int J Health Sci (Qassim). 2017;11:171-177. 7. Azairs-Braesco V, Sluik D, Maillot M, Kok F, Moreno LA. A review of total
& added sugar intakes and dietary sources in Europe. Nutr J. 2017;16:6. 8. Katz DL. The sodium debate: more or less about more or less. Integr Med
(Encinitas). 2014;13:29-31.
9. Ha SK. Dietary salt intake and hypertension. Electrolyte Blood Press. 2014;12:7-18.
10. World Health Organization. Salt reduction. https://www.who.int/news-room/fact-sheets/detail/salt-reduction. (15 February 2019)
11. Higgins S. Behavior change, health, and health disparities: an introduction. Prev Med. 2014;68:1-4.
12. Short S, Mollborn S. Social determinants and health behaviors: conceptual frames and empirical advances. Curr Opin Psychol. 2015;5:78-84. 13. World Health Organization. Mortality and burden of disease attributable
to major risks. https://www.who.int/healthinfo/global_burden_disease/ GlobalHealthRisks_report_full.pdf.
14. Pandita A, Sharma D, Pandita D, Pawar S, Tariq M, Kaul A. Childhood obesity: prevention is better than cure. Diabetes Metab Syndr Obes. 2016;9:83-89.
15. Badau A, Badau D, Serban C, Tarcea M, Rus V. Wellness integrative profile 10 (WIP10) – an integrative educational tool of nutrition, fitness, and health. J Pak Med Assoc. 2018;68:882-887.
16. Rus VA, Ruta FD, Salcudean M, Tarcea M, Serban C, Avram C, Simion I, Benedek T. Adherence to the DASH-style Diet and the presence of Cardiovascular risk factors in adults from Tirgu Mures, Romania. Journal of Interdisciplinary Medicine. 2018;3:134-140.
17. Manippa V, Padulo C, Laan LN, Brancucci A. Gender differences in food choice: effects of superior temporal sulcus stimulation. Front Hum Neurosci. 2017;11:597.
18. Bissonnette-Maheux V, Provencher V, Lapointe A, et al. Exploring women’s beliefs and perception about healthy eating blogs: a qualitative study. J Med Internet Res. 2015;17:e87.
19. Appleton K, Hemingway A, Saulais L, et al, Increasing vegetable intakes: rationale and systematic review of published interventions. Eur J Nutr. 2016;55:869-896.
20. Khalatbari-Soltani S, Marques-Vidal P. Not as bad as you think: a comparison of the nutrient content of best price and brand name food products in Switzerland. Prev Med Rep. 2016;3:222-228.
21. Tarcea M, Fazakas Z, Szucs V, et al. Mean dietary fiber intake of Romanian adults – results of a survey questionnaire. Rev Chim (Bucharest). 2017;68:2083-2087.
22. Rao M, Afshin A, Singh G, Mozaffarian D. Do healthier foods and diet patterns cost more than less healthy options? A systematic review and meta-analysis. BMJ Open. 2013;3:e004277.
23. MacBride-Stewart S, Gong Y, Antell J. Exploring the interconnections between gender, health, and nature. Public Health. 2016;141:279-286. 24. Scholliers P. Convenience foods. What, why, and when. Appetite.
2015;94:2-6.
25. Verriet J. Ready meals and cultural values in the Netherlands, 1950-1970. Food & History. 2013;11:123-153.
26. Sheely M. Global adoption of convenience foods. Amer J Agricult Econ. 2008;90:1356-1365.
27. Brunner TA, Horst K, Siegrist M. Convenience food products. Drivers for consumption. Appetite. 2010;55:498-506.