doi:10.5194/nhess-12-1481-2012
© Author(s) 2012. CC Attribution 3.0 License.
and Earth
System Sciences
Climate trends and behaviour of drought indices based on
precipitation and evapotranspiration in Portugal
A. A. Paulo1,2, R. D. Rosa1, and L. S. Pereira1
1CEER-Biosystems Engineering, Institute of Agronomy, Technical University of Lisbon, Portugal 2Escola Superior Agr´aria de Santar´em, Portugal
Correspondence to: L. S. Pereira (lspereira@isa.utl.pt)
Received: 4 January 2012 – Revised: 19 March 2012 – Accepted: 20 March 2012 – Published: 16 May 2012
Abstract. Distinction between drought and aridity is cru-cial to understand water scarcity processes. Drought in-dices are used for drought identification and drought sever-ity characterisation. The Standardised Precipitation Index (SPI) and the Palmer Drought Severity Index (PDSI) are the most known drought indices. In this study, they are com-pared with the modified PDSI for Mediterranean conditions (MedPDSI) and the Standardised Precipitation Evapotran-spiration Index (SPEI). MedPDSI results from the soil wa-ter balance of an olive crop, thus real evapotranspiration is considered, while SPEI uses potential (climatic) evapotran-spiration. Similarly to the SPI, SPEI can be computed at various time scales. Aiming at understanding possible im-pacts of climate change, prior to compare the drought in-dices, a trend analysis relative to precipitation and tempera-ture in 27 weather stations of Portugal was performed for the period 1941 to 2006. A trend for temperature increase was observed for some weather stations and trends for decreasing precipitation in March and increasing in October were also observed for some locations. Comparisons of the SPI and SPEI at 9- and 12-month time scales, the PDSI and Med-PDSI were performed for the same stations and period. SPI and SPEI produce similar results for the same time scales concerning drought occurrence and severity. PDSI and Med-PDSI correlate well between them and the same happened for SPI and SPEI. PDSI and MedPDSI identify more severe droughts than SPI or SPEI and identify drought occurrence earlier than these indices. This behaviour is likely to be re-lated with the fact that a water balance is performed with PDSI and MedPDSI, which better approaches the supply-demand balance.
1 Introduction
Drought is a natural feature of climate and occurs in almost all climatic regions with varying frequency, severity and du-ration (Wilhite, 1993). It can be defined as a temporary im-balance of water availability consisting of a persistent lower than average precipitation of uncertain frequency, duration and severity, of unpredictable or extremely hard to predict occurrence, resulting in diminished water resources avail-ability (Pereira et al., 2009). Drought is both a hazard and a disaster; a hazard because it is an accident of unpredictable occurrence, part of the naturally variable climate system; dis-aster because it corresponds to the failure of the precipitation regime, causing the disruption of the water supply to the nat-ural and agricultnat-ural ecosystems as well as to other human activities. Drought definitions are many and often are related with specific drought impacts on economic activities, ecosys-tems, and society and water management issues (Dracup et al., 1980; Yevjevich et al., 1983; Wilhite and Glantz, 1987; Tate and Gustard, 2000). Differences in perception is a main problem of water management for drought (Grigg and Vla-chos, 1990). There is a delay between precipitation fail-ure and both the perception of drought and drought effects, shorter for crops and vegetation at their critical growth peri-ods and longer for subsurface reservoirs. The drought onset is slow and difficult to perceive as a true drought initiation. Often, drought ending is also slow and drought effects persist after the causes have vanished. High temperatures and high evapotranspiration rates can aggravate drought effects.
Unlike drought, aridity is a permanent climatic feature cor-responding to an imbalance in water availability consisting in low average annual rainfall, with high spatial and tem-poral variability resulting in overall low moisture and low carrying capacity of the ecosystems (Pereira et al., 2009). Aridity may be expressed through climatological indices,
often defined through a precipitation/evapotranspiration ra-tio (Arora, 2002; UNEP, 1992). The long-term average of the aridity indices computed on a yearly basis quantifies the degree of climatic dryness of a region. However, those ra-tios can be computed on a monthly basis to define a drought index, e.g. the RDI (Tsakiris et al., 2007). Vicente-Serrano et al. (2010b) used precipitation minus potential evapotran-spiration (P–ET) to assess yearly changes in the degree of aridity, which they referred as aridification.
Drought indices evaluate the departure of climate variables in a given time interval (month, season or year) from the “normal” conditions and are used as monitoring tools and op-erational indicators for water managers. Several drought in-dices have been developed, most of them based only on pre-cipitation, some based on precipitation and evapotranspira-tion (ET), and others referring to runoff and vegetaevapotranspira-tion condi-tions (Heim, 2002). Keyantash and Dracup (2002) evaluated the performance and tractability of the most used drought in-dices, whereas Mishra and Singh (2010) reviewed drought concepts and compared drought indices.
The Palmer Drought Severity Index, PDSI (Palmer, 1965) and the Standardized Precipitation Index, SPI (McKee et al., 1993, 1995), are widely used in drought monitoring and have been tested worldwide. The Standardised Precipita-tion EvapotranspiraPrecipita-tion Index (SPEI) includes precipitaPrecipita-tion and potential evapotranspiration (PET) in its formulation; it may express the water supply-demand relation and may ac-commodate climate change influences (Vicente-Serrano et al., 2010a). Differently, the MedPDSI, which is a modifi-cation of the PDSI for Mediterranean conditions, was devel-oped to adopt an updated formulation of the water balance and to consider real evapotranspiration instead of PET, thus approaching better the behaviour of natural and man-made ecosystems in terms of water supply-demand (Pereira et al., 2007; Pereira and Rosa, 2010).
This study aims at assessing the behaviour of the SPI, SPEI, PDSI and MedPDSI indices throughout Portugal and comparing them using data from several weather stations lo-cated in regions with different aridity. Moreover, to better understanding results, precipitation and temperature trends in Portugal in the period 1941–2006 were investigated.
2 Material and methods 2.1 Data
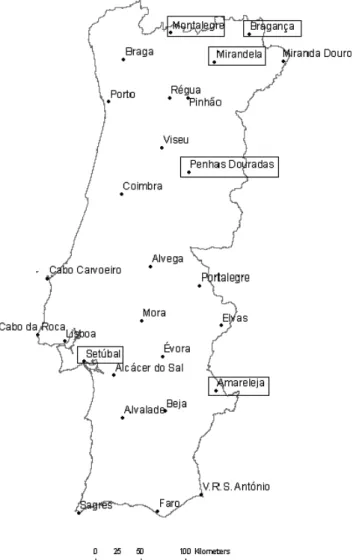
This study was applied in Portugal, using monthly records of precipitation and maximum and minimum air temperature from 27 weather stations belonging to the state meteorolog-ical agency, IM, concerning the common period 1941–2006 (Fig. 1).
Fig. 1. Locations of the weather stations with identification of those
used as examples in this paper.
The quality of annual precipitation records was investi-gated through non-parametric tests. Randomness, homo-geneity and absence of trends were tested using the Kendall autocorrelation test, the Mann-Kendall trend test, and the homogeneity tests of Mann-Whitney for mean and variance (Helsel and Hirsch, 1992). When the hypothesis of homo-geneity fails (significance level 0.05), each month of the se-ries was corrected by the method of cumulative residuals (de-scribed by Allen et al., 1998) using as reference nearby ho-mogeneous data sets and considering a confidence level of 80 % (Rosa et al., 2010b). The missing data for either pre-cipitation or the maximum and minimum temperature were estimated from nearby stations using either linear regression or MOVE linear models (Hirsch, 1982; Vogel and Stedinger, 1985; Helsel and Hirsch, 1992), which preserved the vari-ance and order statistics of the completed series when more than 5 % values were missing (Rosa et al., 2010b).
Table 1. Coordinates and altitude of the weather stations used in this study, respective aridity index and precipitation and temperature trends.
Stations Latitude Longitude Altitude Aridity Precipitation trend Mean temperature trend Index (mm yr−1) (◦C yr−1) 1941–2006 Mar Oct Aug Dec Year Alcacer do Sal 38.38 −8.52 51 0.409 −0.883 0.885 0.025 0.015 Alvalade 37.95 −8.40 61 0.377 −0.700 Alvega 39.47 −8.05 51 0.484 −1.114 1.160 Amareleja 38.22 −7.22 192 0.347 −0.746 0.581 0.013 0.029 0.020 Beja 38.02 −7.87 246 0.415 −1.009 0.552 0.018 0.018 0.012 Braga 41.55 −8.40 190 1.286 −1.518 1.577 0.023 0.016 Braganc¸a 41.80 −6.73 691 0.637 −0.742 0.693 0.026 0.019 0.016 Cabo Carvoeiro 39.35 −9.40 32 0.856 −0.597 0.840 0.018 0.015 0.010 Cabo da Roca 38.78 −9.50 142 0.700 0.870 0.033 0.021 0.019 Coimbra/Bencanta 40.20 −8.42 107 0.715 −0.900 1.135 0.022 0.015 Elvas 38.88 −7.15 208 0.391 −1.005 0.020 0.025 0.017 Evora 38.57 −7.90 309 0.543 −1.277 0.020 0.011 Faro Aeroporto 37.02 −7.97 7 0.450 −0.789 0.011 Lisboa (Geofisico) 38.72 −9.15 77 0.696 −0.998 0.912 0.016 0.012 Miranda do Douro 41.52 −6.28 693 0.494 −0.548 0.900 0.024 0.010 Mirandela 41.52 −7.20 250 0.364 −0.500 0.700 Montalegre 41.82 −7.78 1005 1.547 −1.406 2.088 0.030 0.028 0.021 Mora 38.93 −8.17 110 0.435 −1.012 0.012 Penhas Douradas 40.42 −7.55 1380 2.080 −2.150 1.464 0.015 Pinhao (Santa Barbara) 41.17 −7.55 130 0.453 −0.756 0.846
Portalegre 39.28 −7.42 597 0.797 −1.293
Porto−Serra do Pilar 41.13 −8.60 93 1.206 −1.070 1.343 0.025 0.022 0.014 Regua 41.17 −7.80 65 0.660 −1.251 0.039 0.026 0.025
Sagres 37.00 −8.95 25 0.547 0.043 0.014
Setubal 38.52 −8.90 35 0.571 −1.100 1.014 0.025 0.014 Vila Real de S. Antonio 37.18 −7.42 7 0.389 −0.597 0.019 0.011 Viseu 40.67 −7.90 443 0.886 −1.450 0.033 0.025 0.022
2.2 Methods
Trends in monthly, seasonal and annual precipitation and mean air temperature were investigated through the Mann-Kendall original and modified trend test (Hamed and Rao, 1998), which accounts for temporal autocorrelation and has already been applied in drought indices trend detec-tion (Sousa et al., 2011). A significance level of 0.05 was adopted. When significant, the magnitude of the existing trend was estimated with the Sen slope estimator (Sen, 1968; Helsel and Hirsch, 1992; Huth and Pokorn´a, 2004).
Various aridity indices were developed, mainly relating potential evapotranspiration (PET) and precipitation (P). Us-ing the UNEP index (UNEP, 1992), regions were classified from hyper-arid to humid; however different classification limits may be used according to the selected PET equation, which refers to specific objectives of aridity quantification (Arora, 2002). The UNEP aridity index, given by the aver-age of annual P/PET ratio over several years, was computed for the 27 weather stations in the period 1941–2006 (Ta-ble 1). PET was estimated from the Penman-Monteith
ref-erence ET computed with the temperature approach (Allen et al., 1998). The locations were then classified as semi-arid (0.2 < P/PET <= 0.5), sub-humid (0.5 < P/PET < = 0.75) or humid (P/PET > 0.75).
In this study, the drought indices SPI, SPEI, PDSI, and MedPDSI are compared. The SPI is based on the probability distribution of the precipitation, usually the two-parameter gamma distribution (McKee et al., 1993). It only needs pre-cipitation as input data, can be computed in multiple time scales, and is a normalised index allowing comparability over time and space. The SPI has been applied successfully in Portugal for drought identification (Paulo and Pereira, 2006) and prediction of drought class transitions (Paulo and Pereira, 2008; Moreira et al., 2008).
The SPEI is based on the probability distribution of the difference P–PET cumulated over different time scales and is normalised following the SPI drought classification (Vicente-Serrano et al., 2010a). The authors chose the L-moment parameter estimation and the log-logistic distribution as the one that best fits cumulated P–ET for 3 to 18 month time scales. Its possible sensitivity to climate change was the
Fig. 2. Scatterplots of SPI-9, MEDPDSI and PDSI vs. SPEI-9month in Amareleja, Set´ubal and Montalegre computed for the period 1941–
2006.
reason for its consideration in this study. The difference P– PET is referred to as a climatic water balance, where monthly PET was computed with the Thornthwaite equation (Thorn-thwaite, 1948).
The PDSI (Palmer, 1965) is based on the supply-and-demand concept of the soil water balance applied to a two-layer soil model using monthly precipitation and PET data. The index bases upon the calculation of the moisture depar-ture between actual precipitation and the precipitation ex-pected to occur for the average conditions of the climate, which implies performing a monthly water balance and the calibration of local monthly coefficients for the various terms of the soil water balance. In addition, the calibration of the index is required at local or regional level. The PDSI val-ues depend upon the available soil water capacity (AWC) of
the underlying layer, on the PET method when different of the original Thornthwaite equation, and on the calibration procedures adopted (Alley, 1984; Karl, 1986). Good results have been obtained with the method worldwide. However, the method has limitations as pointed out by several authors (e.g. Alley, 1984; Guttman, 1997; Heddingaus and Sabol, 1991). The limitations relate to the soil water balance proce-dure, the impacts of selecting a given PET equation, the em-pirical equation used to obtain the moisture anomaly index, the empirical coefficients of the recursive equations relating the moisture anomaly index with the three intermediate in-dices that express the severity of a wet/dry category, and the backtracking procedure to choose the actual PDSI from one of the three indices.
Table 2. Pearson correlation coefficient between monthly values of drought indices in selected stations representing different climates
(1941–2006).
Climatic region and Semi-arid Sub-humid Humid
location Amareleja Mirandela Setubal Braganc¸a Montalegre Penhas Douradas
Aridity index 0.347 0.364 0.571 0.637 1.547 2.080 MedPDSI PDSI 0.876 0.929 0.813 0.938 0.941 0.960 SPEI-9 0.801 0.831 0.765 0.777 0.747 0.732 SPEI-12 0.792 0.801 0.734 0.729 0.689 0.684 SPI-9 0.809 0.838 0.763 0.759 0.741 0.733 SPI-12 0.799 0.803 0.733 0.708 0.679 0.683 PDSI SPEI-9 0.825 0.851 0.757 0.802 0.763 0.751 SPEI-12 0.823 0.840 0.741 0.758 0.698 0.695 SPI-9 0.793 0.821 0.759 0.779 0.752 0.750 SPI-12 0.791 0.810 0.741 0.733 0.685 0.692 SPI-12 SPEI-12 0.941 0.953 0.970 0.980 0.991 0.995 SPI-9 SPEI-9 0.931 0.949 0.966 0.978 0.990 0.994
To overcome some of these limitations and to improve adherence of the index to regional conditions, the original method was modified to develop a new index well adapted to Mediterranean conditions, the MedPDSI (Pereira et al., 2007). The soil water balance is performed with the model ISAREG (Liu et al., 1998), thus replacing the former two-layer computation by a soil that represents an agricultural soil cropped with a rainfed olive orchard. The reference ET (ETo)defined by the FAO Penman-Monteith equation is used and is computed from the maximum and minimum tempera-ture (Allen et al., 1998). Non-stressed crop ET (ETm) is com-puted with an appropriate crop coefficient (Kc)as ETm=Kc ETo. The value of Kc is that for rainfed olives and varies for each month and with the available soil water and rainfall (Pereira et al., 2007; Pereira and Rosa, 2010a). The soil wa-ter balance model computes the real evapotranspiration, ETa as follows: ETa=ETm in non-stress conditions, i.e. when the soil water is above a non-stress threshold; ETa<ETm and ETadecreases as the soil loses water when the soil wa-ter content is below the non-stress threshold (Pereira et al., 2007). The procedures used for computation of the indices follow those described by Alley (1984) and Karl (1986) as analyzed by Rosa et al. (2010a). The calibration for both PDSI and MedPDSI consisted in the computation of the cli-matic characteristic and the empirical coefficients of the re-cursive equations relating the moisture anomaly index with the final drought index. The climatic characteristic was esti-mated following Ntale and Gan (2003). The recursive equa-tions were calibrated locally for both humid and dry condi-tions (Rosa et al., 2010b).
The comparison of pairs of drought indices used graphic approaches and descriptive statistics such as an inter-comparison of indices relative to each location using the Pearson correlation coefficient (Chambers et al., 1983; Draper and Smith, 1998).
3 Results
3.1 Trend analysis for precipitation and temperature To better understand the behaviour of the SPI, SPEI, PDSI, and MedPDSI indices throughout Portugal, and sprecifically to verify if drought indices using PET instead of real ET could be adequate to foresee impacts of climate change, a trend analysis for monthly precipitation and temperature was performed for all weather stations in the period 1941–2006. In addition, an aridity index was calculated for all stations and the same period. The most relevant trends for precipi-tation and mean temperature, along with the the aridity in-dex, are presented in Table 1; the coordinates and altitude of the weather stations are also given there. Results for pre-cipitation are contrasting, with decreases in March and in-creases in October. No annual trends were found and sea-sonal trends were not evident. The decreasing trend in March is statistically significant in 25 out of the 27 stations anal-ysed, with a median value of −1.0 mm yr−1. The larger neg-ative trends were observed for northern humid locations; the largest (−2.2 mm yr−1)was identified for Penhas Douradas, the station with highest altitude, 1380 m. In October, a sig-nificant positive trend was identified in 17 out of 27 stations, ranging 0.6 to 2.1 mm yr−1, with highest values for north-ern locations. The larger trend was observed for Montalegre (2.1 mm yr−1), in a mountainous area of the North. These findings are in agreement with former studies, e.g. de Lima et al. (2010) and Sousa et al. (2011).
For the mean annual temperature, a positive significant trend was detected in 21 out of 27 stations, with a median value of 0.014◦C yr−1. No spatial trends were observed. The highest increase was observed for R´egua, located in the dry region of Port wine production. The months with highest increases are August and December, while the lowest were
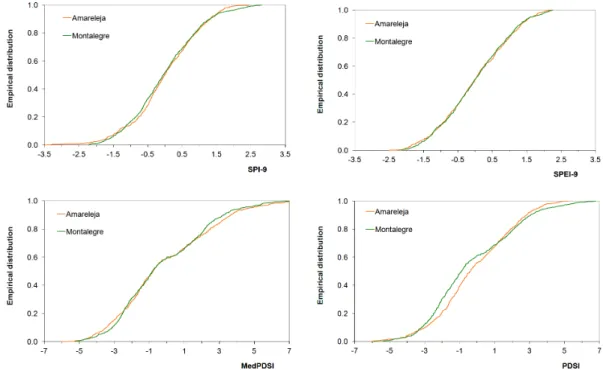
Fig. 3. Empirical distributions of SPI-9, SPEI-9, MedPDSI and PDSI in Amareleja (semi-arid) and Montalegre (humid) computed for the
period 1941–2006.
observed for the spring and autumn months. In August a positive significant trend was found in 17 out of 27 stations, with a median value of 0.025◦C yr−1.
The aridity index varies from 0.347 at Amareleja up to 2.080 at Penhas Douradas, thus revealing that a locations’ climate varies from semi-arid to humid. Most locations have a sub-humid climate. No significant relations were found be-tween the aridity index and the climate trends observed. For better developing the analysis of drought indices’ behaviour, the stations selected for presentation in this paper refer to Amareleja and Mirandela (semi-arid), Setubal and Braganc¸a (sub-humid), and Montalegre and Penhas Douradas (humid), as shown in Fig. 1.
3.2 Drought indices comparison
As expected, the MedPDSI and the PDSI are highly corre-lated (Table 2). The correlation between SPI and SPEI in a given time scale is also high. When considering the relation between MedPDSI or PDSI and SPI or SPEI, there is a better correlation for the 9-month rather than for the 12-month time scale. The correlation coefficients between PDSI(MedPDSI) and SPI(SPEI) are higher for semiarid locations than for hu-mid ones. This may be due to the fact that SPI and SPEI are normalized indices while PDSI and MedPDSI are influenced by the climate since they result from a soil water balance. Thus, there is not symmetry in the frequencies of negative or positive values of these indices, and this asymmetry is higher for humid climates, which causes their correlation with the normalized SPI and SPEI to decrease. This is influenced by
the way PDSI and MedPDSI are calibrated: when calibration focuses on the wettest and driest events, as in this application, the asymmetry is expected to increase; if they are calibrated to satisfy a symetric distribution, the asymmetry decreases and the correlation coefficients may become larger.
Scatter plots of SPI vs. SPEI in a 9-month time scale, MedPDSI vs. SPEI-9 and PDSI vs. SPEI-9 are presented in Fig. 2 for Amareleja (semi-arid), Setubal (sub-humid), and Montalegre (humid). The drought severity classifica-tion is the same for PDSI and MedPDSI, whose scale is approximately twice that adopted for SPI and SPEI. When comparing SPI and SPEI, it can be observed that scatter-ing decreases from the most dry location (Amareleja) to the wettest one (Montalegre), i.e. the similitude between SPI and SPEI monthly values is higher for humid conditions. This was also verified by Raziei et al. (2011). What is re-markable is that extreme negative values of SPI, indicative of high drought severity, do not have a correspondence in SPEI values, which are hardly lower than −2 (Fig. 2). It was observed, mainly for humid locations like Montalegre (Fig. 2), that the relationship between SPI and SPEI (for 9 and 12 months time scale) is not linear but takes an S shape, thus indicating that the values referring to both very wet and very dry conditions are not identified by values much above 2 or much below −2. This relates to the fact that the vari-able of interest in SPEI is P–PET, which behaves differently from P, the variable of interest in SPI. In addition, the dis-tribution functions used may influence the results as anal-ysed by Sienz et al. (2011) relative to SPI. The relationships
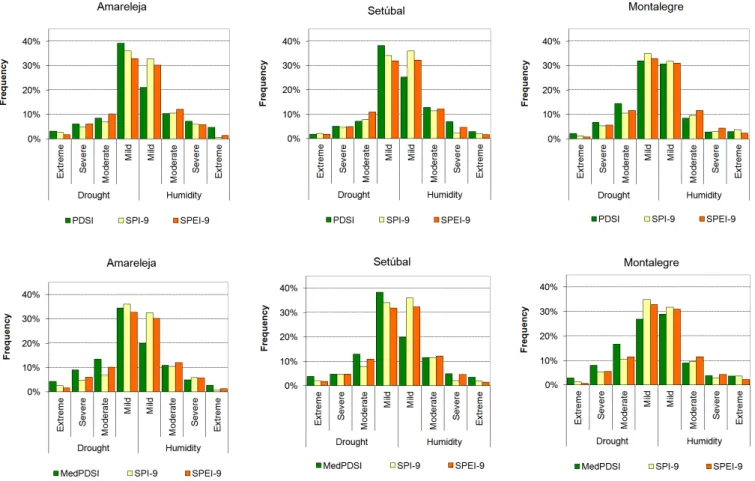
Fig. 4. Frequency of time (%) in each dry or wet category of MedPDSI, PDSI, SPEI-9, and SPI-9 in Amareleja, Set´ubal and Montalegre,
1941–2006.
between MedPDSI or PDSI and SPEI-9 show a large scat-tering (Fig. 2) due to the backtracking procedure of com-putation of the drought severity index, mainly for the mild drought or humid states (−2 < MedPDSI < 2). Despite this dispersion making it more difficult to interpret the scatter plots, it is apparent that there is also less correspondence be-tween the lower and higher values of the PDSI (MedPDSI) and those of SPEI, thus similar to what was observed when comparing SPEI and SPI. The results comparing SPI with PDSI and MedPDSI (not shown herein) show a similar scat-tering due to the backtracking calculation procedure but do not evidence this behaviour relative to lower and higher val-ues of the indices (Rosa et al., 2010a). The empirical distri-bution of the drought indices (Fig. 3) for Montalegre (humid) and Amareleja (semi-arid) confirm that the values referring to both very wet and very dry conditions are not identified by SPEI in the same way as they are identified by SPI, PDSI, and MedPDSI. The number of values much above 2 or below
−2 in the case of SPI, or much above 4 or below −4 in the case of PDSI and MedPDSI, is clearly larger than those for SPEI above 2 or below −2. The results for the other stations are similar.
The empirical distributions in Fig. 3 also show differences between the semi-arid Amareleja and the humid Montale-gre, with SPI identifying fewer extremely severe droughts at Montalegre and fewer very wet occurrences at Amareleja. Similar results are shown for PDSI and MedPDSI. However, the empirical distribution curves of these indices are differ-ent from those of SPI (Fig. 3), particularly for index val-ues between −2 and 2, due to the referred backtracking ef-fects. Differently, the empirical distribution relative to SPEI-9 shows a similar behaviour for Amareleja and Montalegre, i.e. the index does not show sensitivity to climate differences (contrary to what has been observed for Iran, Raziei et al., 2011). This could be considered an advantage as a normal-ized index, but is not considering that the index may be less reactive under the perspective of supply-demand, which ap-parently was the reason for its development.
The frequency of time in each dry or wet category, ex-pressed as the percentage of months in a given category, is shown in Fig. 4 for Amareleja, Set´ubal, and Montalegre com-paring the PDSI and the MedPDSI with both SPEI-9 and SPI-9. It is apparent from these results (confirmed for other loca-tions not shown here) that the SPI and SPEI, since they are normalized indices, tend to have about the same frequencies
Fig. 5. Time series of SPEI-9 and MedPDSI (1941–2006) and of SPI, SPEI, PDSI, and MedPDSI in selected locations during the severe
Table 3. Results of the Mann-Kendall trend test applied to MedPDSI and SPEI.
MedPDSI SPEI
Trend test p value Trend test p value statistic* statistic Alcacer do Sal 0.553 0.580 −0.334 0.738 Alvalade −1.959 0.050 −0.9 0.368 Alvega −2.125 0.034 −0.532 0.595 Amareleja −1.538 0.124 −1.506 0.132 Beja −0.769 0.442 −1.053 0.292 Braga −0.437 0.662 −0.651 0.515 Braganc¸a −2.059 0.040 −1.546 0.122 Coimbra/Bencanta 1.478 0.140 0.142 0.887 Elvas −1.727 0.084 −2.27 0.023 Evora −2.490 0.013 −2.242 0.025 Faro Aeroporto −0.077 0.938 −0.243 0.808 Lisboa (Geofisico) 1.112 0.266 −0.447 0.655 Mirandela −0.210 0.833 0.413 0.679 Miranda do Douro −0.869 0.385 −0.277 0.781 Montalegre 0.387 0.698 0.068 0.946 Mora −3.210 0.001 −2.491 0.013 Penhas Douradas −2.424 0.015 −1.891 0.059 Pinhao (Santa Barbara) 0.935 0.350 0.419 0.675 Portalegre 0.675 0.500 −1.132 0.257 Porto-Serra do Pilar 2.358 0.018 0.968 0.333 Regua −0.498 0.618 −2.038 0.042 Setubal −1.378 0.168 −0.674 0.501 Vila Real de S. Antonio −1.527 0.127 −2.587 0.010 Viseu −0.974 0.330 −0.209 0.834 * When the p-values < 0.05, there is a significant trend for droughts’ severity to increase if the statistics are negative; otherwise, to decrease.
for dry and wet conditions while the PDSI and MedPDSI have shown a higher frequency in dry categories, mainly for the semiarid locations. However, the behaviour of PDSI and MedPDSI can be influenced by calibration. This may con-sist of a disadvantage of PDSI (MedPDSI). A greater num-ber of extreme and severe drought/wet months are identified with the PDSI and, mainly, the MedPDSI rather than with the SPEI or SPI. These results reflect the fact that those indices are obtained from monthly soil water balances, thus consid-ering real ET instead of PET, and show the effects of the bal-ance supply-demand better than just computing anomalies in precipitation or P–PET.
The time variation of the indices SPEI-9 and MedPDSI along the period 1941–2006 is presented in Fig. 5 for the six selected locations; on the right are the courses of SPI-9, SPEI-9, PDSI, and MedPDSI just for the drought of 2004– 2006, that struck the entire country quite severely. The com-parison between SPEI-9 and MedPDSI shows that generally there are few discrepancies between both indices throughout these 66 yr, but lower and higher values are generally iden-tified by MedPDSI and, particularly, drought conditions are identified first by MedPDSI. This indicates that MedPDSI may identify a presumable drought on-set earlier, which is
an advantage for prediction of drought class transitions to be used for drought warning. However, the analysis pre-sented here does not allow us to say that true drought on-sets were identified first. In case of the drought of 2004– 2006, there is evidence that both indices SPI and SPEI had similar time dynamics, while PDSI and MedPDSI evolved also as a different pair. Differences between pairs are influ-enced by their different scale categories. However, PDSI and MedPDSI reacted more evidently than SPI and SPEI to the precipitation anomaly because they were computed by a soil water balance. This condition looks particularly interesting when drought monitoring includes agriculture among the ob-jectives of drought warning.
A Mann-Kendall trend analysis was performed for Med-PDSI and SPEI-9 (Table 3). Results for MedMed-PDSI show more cases where the test statistics are significant, with 5 cases where droughts tend to aggravate and one case con-trary to that trend, Porto, a humid location in the North and close to the Atlantic Ocean. Results for SPEI show 4 cases where droughts tend significantly to aggravate. Only two of those cases are common to both indices, ´Evora and Mora. Identified but not significant opposed trends were ob-served for Alc´acer, Lisboa, Mirandela, and Portalegre. It is
worth noting that, as observed for PDSI (Hu and Willson, 2000), MedPDSI is sensitive to temperature (and precipita-tion) trends as identified in Table 1. Moreover, the results obtained agree with trends observed by Sousa et al. (2011).
4 Conclusions
Monthly and annual trends in precipitation and mean temper-ature from 27 weather stations spread over Portugal and the period 1941–2006 were investigated. Significant trends for annual temperature increase were detected in most locations although not exceeding 0.25◦C per decade; monthly trends were not detected for spring and autumn months and higher increases were observed for August and December. Signif-icant but small trends for precipitation decrease in March were detected in 25 out of 27 stations. Differently, an in-crease was detected in October in 17 stations and no annual trends were found. It can be concluded that observed changes are small overall.
Various drought indices were analysed focusing possi-ble trends on droughts’ occurrence or severity: SPI, using precipitation only, SPEI, using P–ET, and PDSI and Med-PDSI that adopt a soil water balance to detect anomalies in the supply-demand balance. A comparison was performed among semi-arid, sub-humid, and humid locations. Corre-lations between pairs of indices have shown that MedPDSI and PDSI correlate well, as well as SPI and SPEI; the former show good correlations with SPI and SPEI at a 9-month time scale. Analysing the frequency of time in dry or wet cate-gories and the time evolution of drought indices, results show that the MedPDSI and the PDSI identify severe and extreme droughts more frequently than the SPI or SPEI. However, be-cause they are not normalised indices, PDSI and MedPDSI are shown to be negatively biased; this fact relates with their calibration using data from extreme dry and wet events and not searching for a probabilistic balance between dry and wet events.
The SPEI identifies fewer extreme dry and wet values than the other indices. Drought on-set is presumably identified earlier with the PDSI and, mainly, with the MedPDSI. A trend test applied to both the MedPDSI and SPEI data has shown coherent results when comparing both indices. It is worth noting that MedPDSI has been shown to be sensitive to changes in temperature and precipitation that occurred dur-ing the last 66 yr. Despite MedPDSI requirdur-ing further sta-tistical tests and a deeper analysis on alternative calibration procedures (e.g. self calibration), the results allow hypothe-sizing that PDSI and MedPDSI are likely to identify better the supply-demand dynamics and that they may be of great interest for drought warning applications, aiming namely at agriculture.
Acknowledgements. Data relative to weather stations were
pro-vided by the Institute of Meteorology, Lisbon. Edited by: J. A. Santos
Reviewed by: two anonymous referees
References
Allen, R. G., Pereira, L. S., Raes, D., and Smith, M.: Crop Evap-otranspiration, Guidelines for Computing Crop Water Require-ments, Irrigation and Drainage Paper 56, FAO, Rome, 300 pp., 1998.
Alley, W. M.: The Palmer Drought Severity Index: limitations and assumptions, J. Clim. Appl. Meteor., 23, 1100–1109, 1984. Arora, V. K.: The use of the aridity index to assess climate change
effect on annual runoff, J. Hydrol., 265, 164–177, 2002. Chambers, J. M., Cleveland, W. S., Kleiner B., and Tukey, P. A.:
Graphical Methods for Data Analysis, Chapman and Hall, New York, 1983.
de Lima, M. I. P., Carvalho, S. C. P., de Lima, J. L. M. P., and Coelho, M. F. E. S.: Trends in precipitation: analysis of long annual and monthly time series from mainland Portugal, Adv. Geosci., 25, 155–160, doi:10.5194/adgeo-25-155-2010, 2010. Dracup, J. A., Lee, K. S., and Paulson, E. D.: On the definition of
droughts, Water Resour. Res., 16, 297–302, 1980.
Draper, N. R. and Smith, H.: Applied Regression Analysis, John Wiley & Sons Inc., 1998.
Grigg, N. S. and Vlachos, E. C. (Eds.): Drought Water Manage-ment, Colorado State University, Fort Collins, 1990
Guttman, N. B.: Comparing the Palmer drought index and the stan-dardised precipitation index, J. Am. Water Res. Assoc., 34, 113– 121, 1997.
Hamed, K. H. and Rao, R. A.: A modified Mann Kendall test for autocorrelated data, J. Hydrol. 204, 182–196, 1998.
Heddinghaus, T. R. and Sabol, P.: A Review of the Palmer Drought Severity Index and where do we go from here?, in: Proceedings of the 7th Conference on Applied Climatology, American Mete-orological Society, 242–246, 1991.
Heim, R. R.: A review of twentieth-century drought indices used in the United States, Bull. Am. Meteor. Soc., 83, 1149–1165, 2002. Helsel, D. R. and Hirsch, R. M.: Statistical Methods in Water
Re-sources, Elsevier, Amsterdam, 1992.
Hirsch, R. M.: A comparison of four streamflow record extension techniques. Water Resour. Res., 18, 1081–1088, 1982.
Hu, Q. and Willson, G. D.: Effects of temperature anomalies on the Palmer Drought Severity Index in the Central United States, Int. J. Climatol., 20, 1899–1911, 2000.
Huth, R. and Pokorn´a, L.: Parametric versus non-parametric esti-mates of climatic trends, Theor. Appl. Climatol., 77, 107–112, 2004.
Karl, T. R.: The sensitivity of the Palmer Drought Severity Index and Palmer’s Z-Index to their calibration coefficients including potential evapotranspiration, J. Clim. Appl. Meteor., 25, 77–86, 1986.
Keyantash, J. and Dracup, J. A.: The quantification of drought: an evaluation of drought indices, B. Am. Meteor. Soc., 83, 1167– 1180, 2002.
Liu, Y., Teixeira, J. L., Zhang, H. J., and Pereira, L. S.: Model validation and crop coefficients for irrigation scheduling in the
North China Plain, Agr. Water Manage., 36, 233–246, 1998. McKee, T. B., Doesken, N. J., and Kleist, J.: The relationship of
drought frequency and duration to time scales, in: 8th Confer-ence on Applied Climatology, 17–22 January, Anaheim, CA, 179–184, 1993.
McKee, T. B., Doesken, N. J., and Kleist, J.: Drought monitoring with multiple time scales, in: 9th Conference on Applied Clima-tology, Am. Meteor. Soc., Boston, 233–236, 1995.
Mishra, A. K. and Singh, V. P.: A review of drought concepts, J. Hydrol., 391, 202–216, 2010.
Moreira, E. E., Coelho, C. A., Paulo, A. A., Pereira, L. S., and Mexia, J. T.: SPI-based drought category prediction using log-linear models, J. Hydrol., 354, 116–130, 2008.
Ntale, H. K. and Gan, T. Y.: Drought indices and their application to east Africa, Int. J. Climatol., 23, 1335–1357, 2003.
Palmer, W. C.: Meteorological Drought, Research Paper No. 45, US Department of Commerce Weather Bureau, Washington, DC, 1965.
Paulo, A. A. and Pereira, L. S.: Drought concepts and characteriza-tion. Comparing drought indices, Water Int., 31, 37–49, 2006. Paulo, A. A. and Pereira, L. S.: Stochastic prediction of drought
class transitions, Water Resour. Manage., 22, 1277–1296, 2008. Pereira, L. S. and Rosa, R. D.: O ´ındice de Palmer modificado
para clima Mediterrˆanico (MedPDSI), 1. Desenvolvimento, in: Gest˜ao do Risco em Secas, M´etodos, Tecnologias e Desafios, edited by: Pereira, L. S., Mexia, J. T., and Pires, C. A. L., Edic¸˜oes Colibri e CEER, Lisboa, 15–34, 2010.
Pereira, L. S., Rosa, R. D., and Paulo, A. A.: Testing a Modifi-cation of the Palmer Drought Severity Index for Mediterranean Environments, in: Methods and Tools for Drought Analysis and Management, edited by: Rossi, G., Vega, T., and Bonaccorso, B., Springer, Dordrecht, 149–167, 2007.
Pereira, L. S., Cordery, I., and Iacovides, I.: Coping with Water Scarcity. Addressing the Challenges, Springer, Dordrecht, 382 pp., 2009.
Raziei, T., Bordi, I., Pereira, L. S., and Sutera, A.: Detecting im-pacts of a changing climate on drought characteristics in Iran, in: Water Engineering and Management in a Changing Environ-ment, edited by: Cancellieri, A. and Rossi, G., (VIth EWRA Int. Symp., Catania, Italy), Quaderni CSEI Catania, III Serie, Vol. 6, CD-Rom, 2011.
Rosa, R. D., Pereira, L. S., and Paulo, A. A.: O MedPDSI, uma modificac¸˜ao do ´ındice de Palmer para clima mediterrˆanico, 2, Aplicac¸˜ao ao pa´ıs, in: Gest˜ao do Risco em Secas, edited by: Pereira, L. S., Mexia, J. T., and Pires, C. A. L., M´etodos, Tec-nologias e Desafios, Edic¸˜oes Colibri e CEER, Lisboa, 35–58, 2010a.
Rosa, R. D., Paulo, A. A., Matias, P. G., Esp´ırito Santo, M. F., and Pires, V. C.: Tratamento da qualidade das s´eries de dados clim´aticos quanto a homogeneidade, aleatoriedade e tendˆencia e completagem de s´eries de dados, in: Gest˜ao do Risco em Se-cas, edited by: Pereira, L. S., Mexia, J. T., and Pires, C. A. L., M´etodos, Tecnologias e Desafios, Edic¸˜oes Colibri, CEER, 119– 139, 2010b.
Sen, P. K.: Estimates of the regression coefficient based on Kendall’s tau, J. Am. Stat. Assoc., 63, 1379–1389, 1968. Sienz, F., Bothe, O., and Fraedrich, K.: Monitoring and
quantify-ing future climate projections of dryness and wetness extremes: SPI bias, Hydrol. Earth Syst. Sci. Discuss., 8, 10635–10677, doi:10.5194/hessd-8-10635-2011, 2011.
Sousa, P. M., Trigo, R. M., Aizpurua, P., Nieto, R., Gimeno, L., and Garcia-Herrera, R.: Trends and extremes of drought indices throughout the 20th century in the Mediterranean, Nat. Haz-ards Earth Syst. Sci., 11, 33–51, doi:10.5194/nhess-11-33-2011, 2011.
Tate, E. L. and Gustard, A.: Drought definition: a hydrological per-spective, in: Drought and Drought Mitigation in Europe, edited by: Vogt, J. J. and Somma F., Kluwer, Dordrecht, 23–48, 2000. Thornthwaite, C. W.: An approach toward a rational classification
of climate, Geogr. Rev., 38, 55–94, 1948.
Tsakiris, G., Pangalou, D., and Vangelis, H.: Regional drought as-sessment based on the reconnaissance drought index (RDI), Wa-ter Resour. Manage., 21, 821–833, 2007.
United Nations Environment Programme (UNEP): World Atlas of Desertification, 1992.
Vicente-Serrano, S. M., Begueria, S., and L´opez-Moreno, J. I.: A multiscalar drought index sensitive to global warming: The Stan-dardized Precipitation Evapotranspiration Index, J. Climate, 23, 1696–1718, 2010a.
Vicente-Serrano, S. M., Lasanta, T., and Gracia, C.: Aridification determines changes in forest growth in Pinus halepensis forests under semiarid Mediterranean climate conditions, Agr. Forest Meteorol., 150, 614–628, 2010b.
Vogel, R. M. and Stedinger, J. R.: Minimum variance streamflow record augmentation procedures, Water Resour. Res., 21, 715– 723, 1985.
Yevjevich, V., Cunha, L. V., and Vlachos, E. (Eds.): Coping with Droughts, Water Resources Publications, Littleton, Colorado, 1983,
Wilhite, D. A.: Drought Assessment, Management, and Planning: Theory and Case Studies, Natural Resource Management and Policy Series, Vol. 2, Kluwer, 1993.
Wilhite, D. A. and Glantz, M. H.: Understanding the drought phe-nomenon: the role of definitions, in: Planning for Drought, edited by: Wilhite, D. A., Easterling, W. E., and Wood, D. A., Vestview Press, Boulder, CO, 11–27, 1987.