Faculty of Engineering of the University of Porto
Analysis of metallic foams with meshless
methods: a homogenisation technique
Damián González de Chávez Pérez
Thesis submitted to the Faculty of Engineering of the University of Porto as
a requirement to obtain the MSc degree in Computational Mechanics.
Under the supervision of
Professor Jorge Américo Oliveira Pinto Belinha
and
Professor Renato Manuel Natal Jorge
Porto, September 2018
II
Abstract
This project aims to study and obtain the expressions that define the mechanical properties of an aluminium cell with different relative densities. The goal is to allow the extrapolation of these properties for large scale models, as a core, namely for sandwich structures.
Preliminary research was done to decide the lower level that composes the foam structure, that is, the cell. Regarding the objective of the thesis, there are four important questions that need to be answered. The first one is to know how the mechanical properties behave with the variation of the relative density. The second one, to compare the behaviour of FEM – a mesh-based method - with that of meshless methods such as RPIM, and NNRPIM, when applied under the same situations. Third, to compare the behaviour of the mechanical properties of a sandwich beam structure at different relative densities within its core. Fourth, to compare the results for a sandwich beam structure under increasing relative densities from the inside to the outside part of the beam, for each numerical method applied.
In order to obtain the behaviour of the aluminium cells, elastic and elastoplastic simulations were carried out, applying a displacement to the top of the cell and with the boundary conditions as being confined and non-confined. The beam case study employed the characteristics of a cantilever beam, meaning it was embedded on one end and with a displacement in the free end. The numerical simulations were performed using the FEM, RPIM, with two different formulations, and the NNRPIM.
The technique applied to obtain the mechanical properties was a ‘homogenisation
technique,’ that allows, with a simple procedure, to group all of the properties obtained in
each node in a single property for all of the cellular solid. The results obtained using homegenisation were compared to those obtained using an interest point.
After 400 simulations, the graphics that represent the behaviour of Young’s modulus, the tangent modulus and the Poisson’s coefficient were produced as a function of the relative density for the confined and non-confined cases. Also, the yield stress was obtained as a function of the relative density. Through these graphics, it was possible to obtain the properties for a range of relative densities between 0.4 and 0.7. This property was applied in the core of the sandwich structure.
In view of the results, it was possible to conclude that the difference between the methods is not relevant. Furthermore, similarities between the FEM and the NNRPIM results and between the RPIM with the first and second formulation were observed. Also, having holes in the cell structure and treating it under meshed and no-meshed aproaches produces the same results.
The main conclusion reached was that the properties obtained in the interest point present better results than the ones obtained with the homogenisation technique.
The behaviour of the cases with relative densities outside the range between of 0.4 and 0.7 is considered undefined with the techniques used and the results obtained in this study.
III
Resumo
Este projecto pretende estudar e obter as expressões que definem as propriedades mecânicas de uma célula de alumínio com diferentes densidades relativas. A meta é permitir a extrapolação destas propriedades para modelos a uma escala maior, no seu interior, nomeadamente para estruturas tipo-sanduíche.
Após um trabalho preliminar de pesquisa, decidiu-se começar pelo nível mais baixo em termos da composição da estrutura da espuma, isto é, a célula.
No que respeita aos objectivos da tese, há quatro questões importantes às quais dar resposta. O primeiro consiste em saber como as propriedades mecânicas se comportam com a variação da densidade relativa. O segundo objectivo é comparar o comportamento dos métodos numéricos FEM, RPIM e NNRPIM, quando ulizados em situações idênticas. Em terceiro lugar, pretende-se comparar o comportamento das propriedades mecâncias de uma estrutura tipo sanduíche com difentes densidades relativas dentro do seu núcleo. O quarto objectivo é comparar os resultados para uma viga em sanduíche sob densidades relativas crescentes, do interior para o exterior e para cada método numérico aplicado.
Para se obter o comportamento das células de alumínio,foram realizadas simulações elásticas e elastoplásticas, aplicando-se um deslocamento no topo da célula, com condições – fronteira confinadas e não-confinadas. Para o estudo de caso com a viga de alumínio, foram utilizadas as características de uma viga cantiléver, isto é, embutida numa extremidade e com deslocamento na extremidade livre. As simulações numéricas foram realizadas utilizando os métodos FEM, o RPIM com duas formulações diferentes e o NNRPIM.
A técnica aplicada para se obterem as propriedasde mecânicas foi a da homogenização, que permite, com um procedimento simples, o agrupar de todas as propriedades obtidas para cada nó num única propriedade para a globalidade do sólido celular. Os resultados obtidos com a homogeneização foram comparados com os obtidos utilizando a abordagem ao ponto de interesse.
Após 400 simulações, os gráficos que representam o comportamento do Módulo de Young, do Módulo tangente e do Coeficiente de Poisson foram construídos em função da densidade relativa para os casos confinados e não-confinados. Além disso, a tensão de cedência foi obtida em função da densidade relativa. Através destes gráficos, foi possível obter-se as propriedades para uma gama de densidades relativas entre 0.4 e 0.7. Esta propriedade foi aplicada no núcleo da estrutura sanduíche.
Tendo em conta os resultados, foi possível concluir que a diferença entre os métodos utilizados não é relevante. Adicionalmente, observaram-se também semelhanças entre os resultados do FEM e do NNRPIM e entre ambas as formulações para o RPIM. Além disso, tratar uma estrutura celular com orifícios segundo uma abordagem com malha e sem malha produz os mesmos resultados.
A principal conclusão conseguida neste estudo foi a de que as propriedades obtidas através da abordagem ponto de interesse apresentam melhores resultados do que com a técnica da homogeneização.
IV
Considera-se também que o comportamento dos casos em que as densidades relativas estão fora do intervalo 0.4 a 0.7 é indefinido com as técnicas utilizadas e para os resultados obtidos neste estudo.
V
Acknowledgements
To my parents, Male and Juan, who have supported me in the awkward moments, always showing me positivism and much love despite being separated by distance and knowing that it is never easy to be far from home.
A special acknowledgement to my supervisor, Professor Jorge Belinha who, from the beginning of the master awoke in me the interest for the study of computational mechanics and pushed me to improve myself, to overcome my obstacles and tobecome a more complete and autonomous person.
To my best friend since I arrived in Porto, Nina Costa, who always explained to me that she was available for anything I would need. For guiding me and showing me how the faculty worked and of course, for the great moments that we spent during breaks at work. Also, I would like to include Cecília Carvalho, who was as a big sister to me. also contributing to great moments at the faculty.
To my laboratory team, Bruno Areias, Edwin Ocana, Leonardo Santana, Marco Marques for their help, support and teaching me, while creating an enjoyable work atmosphere.
Finally, to my colleagues of the master programme, which also allowed me to improve and increase my skills through the knowledge absorbed form each one.
VI
Institutional Acknowledgments and Funding
The author truly acknowledges the work conditions provided by the Applied Mechanics Division (SMAp) of the Department of Mechanical Engineering (DEMec) of the Faculty of Engineering of the University of Porto (FEUP), and by the MIT-Portugal project “MIT-EXPL/ISF/0084/2017”, funded by Massachusetts Institute of Technology (USA) and “Ministério da Ciência, Tecnologia e Ensino Superior - Fundação para a Ciência e a Tecnologia” (Portugal). Additionally, the authors gratefully acknowledge the funding of Project NORTE-01-0145-FEDER-000022 - SciTech - Science and Technology for Competitive and Sustainable Industries, cofinanced by Programa Operacional Regional do Norte (NORTE2020), through Fundo Europeu de Desenvolvimento Regional (FEDER).
Finally, the author acknowledges the synergetic collaboration with the Researchers of “Computational Mechanics Research Laboratory CMech-Lab” (ISEP/FEUP/INEGI), and its director, Prof. Dr. Jorge Belinha, and its senior advisors, Prof. Dr. Renato Natal Jorge and Prof. Dra. Lúcia Dinis.
VII
Table of Contents
Abstract... II
Resumo ... III
Acknowledgements ... V
Institutional Acknowledgments and Funding ... VI
Table of Contents ... VII
List of Figures ... X
List of Tables ... XIII
Chapter 1 ... 1
INTRODUCTION ... 1
Chapter 2 ... 3
CELLULAR SOLIDS ... 3
2.1. CELLS STRUCTURE ... 4 MANUFACTURING PROCESS ... 5 MINIMAL SURFACES ... 9 2-D Mechanical Behaviour ... 12 3-D Mechanical Behaviour ... 14 SIZE EFFECTS ... 18UNIAXIAL COMPRESSION AND TRACTION TEST ... 18
MATERIAL PROPERTIES ... 20
2.2. HONEYCOMB (2-D CELLULAR SOLID) ... 20
DEFORMATION MECHANISMS IN HONEYCOMB ... 21
IN-PLANE DEFORMATION ... 21
OUT-PLANE DEFORMATION ... 23
THE IN-PLANE AND OUT-OF-PLANE PROPERTIES OF HONEYCOMBS: UNIXIAL LOADING 23 2.3. TRIPLY PERIODIC MINIMAL SURFACE ... 27
2.4. ULTRALOW-DENSITY MATERIAL (SHELLULAR) ... 28
Chapter 3 ... 30
NUMERICAL METHOD: FORMULATION ... 30
3.1. Finite element method ... 30
Integration Points... 31 Shape Functions ... 32 3.2. Meshless method ... 34 Node Generation... 34 Integration Points... 34 Influence domain ... 35 Integration mesh ... 36
Natural Neighbours and Influence Cells ... 36
VIII
Natural Neighbours Radial Point Interpolation Method ... 40
Chapter 4 ... 43
SOLID MECHANICS FUNDAMENTALS ... 43
4.1. 3D CLASSICAL DEFORMATION THEORY ... 43
Continuum Formulation ... 43
Kinematics ... 43
Stress and Strain ... 44
Constitutive Equations ... 45
Static Equilibrium Equations ... 46
Boundary Conditions ... 46
4.2. STRONG AND WEAK FORM FORMULATION ... 47
Weak Form of Galerkin ... 47
Discrete System of Equations... 48
Stiffness Matrix ... 50
Natural Boundary Conditions ... 50
Essential Boundary Conditions ... 51
Strain, Stress and Displacement ... 51
Continuum procedure ... 52
4.3. YIELD CRITERION FOR SOLID AND CELLULAR MATERIALS ... 52
Yielding Criteria for Continuum Solid ... 54
von-Mises yield criteria ... 54
Tresca yield criteria ... 54
Hosford generalised yield criteria ... 54
Yielding Criteria for Cellular Solids ... 55
4.4. ELASTOPLASTIC ANALYSIS ... 58
Yield Criterion ... 59
Hardening rule ... 60
Plastic flow ... 60
Mathematical Expressions ... 61
Nonlinear Solution Algorithms ... 64
(a) Stress Returning Algorithm ... 64
(b) Nonlinear solution algorithm: Modified Newton-Raphson (KT0), (KT1) and (KTALL). ... 65
Chapter 5 ... 68
NUMERICAL METHOD: BACKGROUND ... 68
5.1. FINITE ELEMENT METHOD ... 68
FINITE ELEMENT METHOD IN CELLULAR SOLIDS ... 69
Homogenisation and the Unit Cell Method ... 69
Micromechanical Finite Element Models of Cellular Solids ... 70
Open and Closed Cell Foams ... 71
New numerical methods for Cellular Solids ... 75
5.2. MESHLESS METHOD ... 76
Relevant Meshless Methods ... 77
Chapter 6 ... 79
IX
6.1. 2D MODELING OF THE CELLULAR SOLID ... 79
Material properties ... 80
Meshing procedure ... 80
6.2. ELASTIC ANALYSIS. ... 81
Calculation of Young’s modulus and Poisson’s coefficient homogenised. ... 82
Variation of the properties as a function of the relative density ... 83
6.3. ELASTOPLASTIC ANALYSIS. ... 85
Trial parameter ... 85
Elastoplastic results ... 87
Chapter 7 ... 91
CANTILEVER BEAM COMPOSED BY ALUMINIUM FOAM. ... 91
7.1. ELASTOPLASTIC ANALYSIS. ... 91
Chapter 8 ... 95
CONCLUSIONS ... 95
8.1. FURTHER IMPROVEMENTS ... 96
References ... 97
ANNEX 1: Cases of the study ... 107
X
List of Figures
Figure 1(a) A schematic illustration of the manufacture of an aluminium foam by the melt gas injection method (CYMAT and HYDRO processes) (b) CYMAT foam microstructure. (M.F.
Ashby, A.G. Evans, N.A. Fleck, L.J. Gibson, n.d.) ... 6
Figure 2 The process steps used in the manufacture of aluminium foams by gas-releasing particle decomposition in the melt (Alporas process) (a) Viscosity modification (b) foaming agent addition (c) isothermal foaming (d) cooling of foamed aluminium. (M.F. Ashby, A.G. Evans, N.A. Fleck, L.J. Gibson, n.d.)... 6
Figure 3 The sequence of powder metallurgy steps used to manufacture metal foams by gas-releasing particles in semi-solids (the Fraunhofer and the Alulight process) (a) Select ingredient and mix (b) Consolidation and extrusion (c) Shaped mold (d) Foaming. (M.F. Ashby, A.G. Evans, N.A. Fleck, L.J. Gibson, n.d.) ... 7
Figure 4 Investment casting method to manufacture open cell foams (DUOCEL process) (a) Preform (b)Burnout (c) Infiltrate (d) Remove mold material. (M.F. Ashby, A.G. Evans, N.A. Fleck, L.J. Gibson, n.d.) ... 8
Figure 5 Schematic illustration of the CVD process used to create open-cell nickel foams (INCO process) (a) Vapor deposition of Nickel (b) Burnout polymer (c) Sinter (Ligament densification). (M.F. Ashby, A.G. Evans, N.A. Fleck, L.J. Gibson, n.d.) ... 8
Figure 6 Kelvin cell (L. Gibson & Ashby, 1997) ... 9
Figure 7 Weaire and Phelan cell (Buffel, Desplentere, Bracke, & Verpoest, 2014) ... 9
Figure 8 Tetrahedra + Octahedra cell ... 10
Figure 9 Cube cell... 10
Figure 10 Rhombic Dodecahedron ... 10
Figure 11 Voronoi cell 2-D ... 11
Figure 12 Voronoi cell 3-D ... 11
Figure 13 Open-cell (left), Closed-cell (right) (L. Gibson & Ashby, 1997) ... 14
Figure 14 Stress-strain graphic representation of a compression test (L. Gibson & Ashby, 1997) ... 19
Figure 15 Stress-strain graphic representation of a traction test (L. Gibson & Ashby, 1997) ... 19
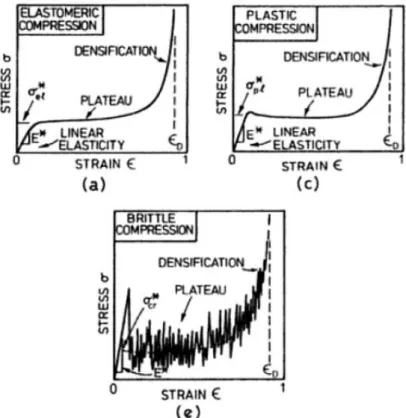
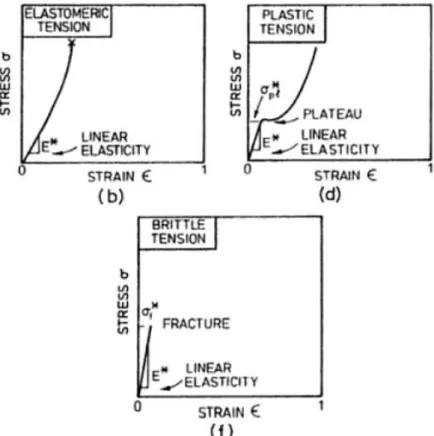
Figure 16 Compressive curve for honeycombs (a) elastomeric, (c) elastic-plastic and (e) elastic-brittle, (L.J. Gibson & Ashby, 1989). ... 21
Figure 17 Tension curve for honeycombs (b) elastomeric, (d) plastic and (f) elastic-brittle,(L.J. Gibson & Ashby, 1989). ... 22
Figure 18 Stress-strain curves for the axial (X3) loading of a honeycomb, (a) compression, (b) tension, (L.J. Gibson & Ashby, 1989). ... 23
Figure 19 Triply periodic minimal surface (TPMS) (Dalaq, Abueidda, Abu Al-Rub, & Jasiuk, 2016) ... 28
Figure 20 Configurations of (a) Microlattice and (b) Shellular with enlarged views of their unit cells, and configurations of single unit cells of (c) Microlattice, (d) a hollow octahedron truss PCM, and (e) a truncated conical shell as an idealized formation of. (M. G. Lee et al., 2016) ... 29
XI
Figure 21 Regular mesh (left) and irregular mesh (right) ... 30
Figure 22 - Examples of different types of 2D elements (Eaton, 2005). ... 30
Figure 23 Examples of different types of 3D elements (Eaton, 2005). ... 31
Figure 24 - Example quadrilateral "element" with 2x2 integration points ... 32
Figure 25 - 2D Pascal Triangle ... 32
Figure 26 Regular mesh (left) and irregular mesh (right) ... 34
Figure 27 (a) Fixed rectangular influence domain. (b) Fixed circular influence domain. (c) Flexible circular influence domain ... 36
Figure 28 – (a) Initial nodal set of potential neighbour nodes of the node 𝑛0. (b) First trial plane. (c) Second trial plane. (d) Final trial cell containing just the natural neighbours of node 𝑛0. (e). Node 𝑛0 Voronoï cell 𝑉𝑜. (f) Voronoï diagram (Jorge Belinha, 2014a) ... 37
Figure 29 - (a) Voronoï diagram (b) Delaunay Triangulation (c) Natural neighbour circumcircle (Jorge Belinha, 2014a) ... 38
Figure 30 – (a) 1st degree influence-cells (b) 2nd degree influence-cells (Jorge Belinha, 2014a) ... 39
Figure 31 Representation of a generic influence domain ... 40
Figure 32 3D solid with body and surface forces applied (Patarata, 2017) ... 44
Figure 33 Infinitesimal cubic volume with the six-independent stress component (Patarata, 2017) ... 44
Figure 34 Bilinear elastoplastic model (Moreira, 2013) ... 59
Figure 35 Hardening Rule: (a) Isotropic Hardening; (b) Kinematic Hardening; (c) Independent Hardening (Moreira, 2013) ... 60
Figure 36 Flow rule (normality principle)(Moreira, 2013) ... 61
Figure 37 Elastoplastic behaviour with hardening in a uniaxial test (J. A. Belinha, 2004a) 62 Figure 38 Backward-Euler scheme (Moreira, 2013) ... 64
Figure 39 (a) Incremental (Euler) solution scheme; (b) Newton-Raphson method(Moreira, 2013) ... 66
Figure 40 (a) Combined incremental and Newton-Raphson method; (b) Combination of the incremental predictor with modified Newton-Raphson iterations (KT1); (c) Initial stress method combined with an incremental solution (KT0) (Moreira, 2013) ... 67
Figure 41 Voxel mesh of PU foam (Maire et al., 2003) ... 72
Figure 42 Schematic representation of the meshing of a PVC foam cell with beam and shell (Fischer, Lim, Handge, & Altsẗdt, 2009) ... 73
Figure 43 Tetrahedral mesh of polyurethane foam (Youssef et al., 2005) ... 75
Figure 44 Aluminium cellular solid scheme ... 79
Figure 45 Cellular solid (mesh) (a) n=2, d=0.5 and no meshing holes (b) n=2, d=0.5 and meshing holes. ... 80
Figure 46 Scheme of a beam composed by a sandwich structure ... 81
Figure 47 (a) cellular solid with no discretised holes n=2, d=0.5 and confined (b) cellular solid with no discretised holes n=2, d=0.5 and non-confined (c) cellular solid with discretised holes n=2, d=0.5 and confined (d) cellular solid with discretised holes n=2, d=0.5 and non-confined ... 81
Figure 48 MATLAB elimination nodes code ... 82 Figure 49 (a) Variation of Young’s modulus as a function of the relative density for filled holes, non-confined study (b)Variation of Poisson’s coefficient as a function of the relative
XII
density for filled holes, non-confined study (c) Variation of the Young’s modulus as a function of the relative density for filled holes, confined study. ... 84
Figure 50 (a) Variation of Young’s modulus as a function of the relative density for empty holes, non-confined study (b)Variation of Poisson’s coefficient as a function of the relative density for empty holes, non-confined study (c) Variation of the Young’s modulus as a function of the relative density for empty holes, confined study. ... 85
Figure 51 Location of the interest point ... 85 Figure 52 Strain-Stress curve for Aluminium 2014 ... 86 Figure 53 Comparison between the numerical elastoplastic approximation methods applied using the default parameters. ... 86
Figure 54 Comparison between the numerical elastoplastic approximation method applied using the selected parameters. ... 87
Figure 55 Scheme force-displacement graphic ... 88 Figure 56 (a) Variation of the homogenous elastic modulus in the confined elastoplastic analyses (b) Variation of the homogenous elastic modulus in the non-confined elastoplastic analyses (c) Variation of the homogenous tangential modulus in the confined elastoplastic analyses (d) Variation of the homogenous tangential modulus in the non-confined elastoplastic analyses. ... 89
Figure 57 (a) Variation of the elastic modulus (interest point) in the confined elastoplastic analyses (b) Variation of the elastic modulus (interest point) in the non-confined elastoplastic analyses (c) Variation of the tangential modulus (interest point) in the confined elastoplastic analyses (d) Variation of the tangential modulus (interest point) in the non-confined elastoplastic analyses. ... 89
Figure 58 (a) Variation of the homogenous yield stress in the confined elastoplastic analyses (b) Variation of the homogenous yield stress in the non-confined elastoplastic analyses (c) Variation of the yield stress in the interest point and the confined elastoplastic analyses (d) Variation of the yield stress modulus in the interest point, and the non-confined elastoplastic analyses. ... 90
Figure 59 (a) Scheme of the cantilever beam with a homogenous aluminium foam core and a solid aluminium shell (b) Scheme of the cantilever beam with the different layers corresponding to the different values of the relative densities of the aluminium foam. ... 91
Figure 60 (a) force-displacement 0.4 relative density (homogenised) (b) force-displacement 0.4 relative density (interest point) (c) force-displacement 0.5 relative density (homogenised) (d) force-displacement 0.5 relative density (interest point) (e) force-displacement 0.6 relative density (homogenised) (f) displacement 0.6 relative density (interest point) (g) force-displacement 0.7 relative density (homogenised) (h) force-force-displacement 0.7 relative density (interest point) (i) displacement progressive relative density (homogenised) (j) force-displacement progressive relative density (interest point). ... 94 Figure 61 Comparison between the numerical method and the homogenous and interest point elastoplastic results for the values obtained increasing the maximum value imposed from four to eight and increase the number of increment from 15 to 20. ... 110
Figure 62 Comparison of the response in each numerical method when the relative density increase for the homogenous and interest point elastoplastic results. ... 111
XIII
List of Tables
Table 1 3-D surface properties. Planar faces (warped faces) (Christensen, 2000) ... 10
Table 2 2-D surface properties (Christensen, 2000). ... 10
Table 3 2-D Mechanical properties (Christensen, 2000) ... 12
Table 4 Elastic moduli and strength of foams (L.J. Gizbson, 1989) ... 15
Table 5 In-plane elastic moduli of honeycombs (L.J. Gibson, 1989) ... 23
Table 6 In-plane strength of honeycombs (L.J. Gibson, 1989) ... 25
Table 7 Out-of-plane properties of honeycombs (Lorna J. Gibson, 2005) ... 27
Table 8 - Gaussian quadrature coordinates and weights ... 31
Table 9 Yield criteria proposed in the literature to define the yield surface of solid foams (Shafiq, Ayyagari, Ehaab, & Vural, 2015). ... 56
Table 10 Circumference holes radius... 80
Table 11 Parameters for the calculation of the relative density ... 83
Table 12 Aluminium 2014 properties ... 85
Table 13 Elastoplastic simulation parameters ... 87
Table 14 Elastoplastic simulation parameter for the cantilever beam case ... 92
Table 15 Homogenised mechanical properties ... 92
1
Chapter 1
INTRODUCTION
The study of cellular solid is nowadays one of the most relevant fields for study in the engineering world, because of its wide range of physical and mechanical properties. Having the possibility to understand and reproduce the internal structures of a few natural cellular solids, which combine a high rigidity with a low relative density (e.g.: trabecular bone, wood, cork, sponges, wools, honeycomb), is really important in order to understand why these types of structures occur in nature. The work presented herein follows the knowledge provided by Lorna J.Gibson and Michael F.Ashby, who have extensively studied the behaviour of the cellular solids (L. Gibson & Ashby, 1997).
Nowadays, cellular solids have been reproduced in many areas such as human prostheses, sandwich structures and also significant structures as building materials and components. In order to understand these structures, it is necessary to begin the study at the cellular level. Cells present many different forms: regular and repetitive as the honeycomb, or irregular and random as the trabecular bone. Also, they may be closed or open. The main aspect is that every single cellular form in nature has a reason to be. Engineering must apply its knowledge to answer the question as to why that is the case.
These types of structures require proper mathematical models capable of simulating their behaviour. This is where these types of materials present their most challenging aspect. Suitable numerical methods included the Finite Element Method (FEM), (Ziennkiewicz & Taylor, 2005) and the Radial Point Interpolator Method (RPIM) or Natural Neighbour Radial Point Interpolator Method (NNRPIM), both meshless methods (Jorge Belinha, 2014b). Their ability to discretise the geometry of cellular solids and their computational efficiency allows to reproduce the behaviour of these types of structures.
Because of the broad world that the cellular solids present, this project had to be limited to understanding one single cell geometry, with a simple shape as a circle. The work focused on, varying the size and the number of the circle to reproduce the variation of the relative density in the same specimen.
This work aims to fulfill two different objectives. First, to obtain the mathematical model that represents the mechanical behaviour of the cell geometry with the variation of relative density with the elastic behaviour and the elastoplastic behaviour.The second objective is to compare the differences in the results from applying different numerical methods - such as FEM, and meshless (RPIM/NNRPIM).
2
Taking into account the first objective, having the models that define the behaviour of the cellular solid allow to apply their properties to any geometry, having the possibility to change the relative density along the solid. Focusing on the second objective, it will be possible to verify whether the meshless method presents better results than the FEM, knowing that both meshless methods are more flexible with regards to the geometry, an aspect that is essential in these types of structures.
This work is composed of seven chapters:
• The first chapter correspond with the introduction, where the principal concepts of the thesis are announced.
• The second chapter presents the bibliographic review, where a few of the fabrication processes are explained. The chapter also addresses how the understanding of cellular solids behaviour has been evolving, given the appearance of new and more robust mathematical models and the discovery of new cell structures.
• The third chapter explains how the two types of numerical methods will be used. The chapter presents the FEM (Finite Element Method) and meshless methods -RPIM (Radial Point Interpolator Method) and NNRPIM (Natural Neighbour Radial Point Interpolator Method). The formulation behind both types opf methods will be presented.
• The fourth chapter presents the fundamentals of solid mechanics , addressing the strong and weak form formulation, the yield criteria (continuum solid and cellular solid) and the elastoplastic fundamentals, along with their formulation as well. • The fifth chapter summarises the bibliographic review conducted for the numerical
methods applied and highlights how nowadays these methods already contribute to the understanding of cellular solids behaviour.
• The sixth chapter describes how the model for this work was done, which boundary conditions were applied, the simulations that were performed and the results that were obtained for the elastic and elastoplastic studies together with the graphics and the expressions of the behaviour of the models.
• The seventh chapter presents the study of a sandwich panel, and the elastoplastic results for the different cores as a function of the relative density, presented through the force-displacement graphics.
3
Chapter 2
CELLULAR SOLIDS
Cellular solids are a type of material that is characterised as such because of is internal structure: an assembly of porous cells with solid edges or faces, packed together so that they fill space. They have been known in their natural form for a very long time (trabecular bone, wood, cork, sponges, wools). These cells can be open or closed, and their dimensions can span over several order magnitudes, from nanometers to centimetres. Their microstructure has widely inspired engineers to produce highly porous engineering solids such as wool (glass or rock wool) and foam (metal, polymer and ceramic foams). Over the last 20-years, interest in these materials has grown. They have numerous interesting properties, qualifying them as multifunctional materials. Thanks to their low relative density and excellent mechanical properties, they can be uses as a lightweight sandwich core. Their high fracture strain, together with their damaging behaviour when compressed, induces a significant energy absorption capacity for packaging applications and shock absorbers. Their low thermal and acoustic conductivity are interesting for hear and sound insulation. The high-volume fraction of open porosity favours their use as filters and bone substitutes. Presently, these types of materials have a potential application in new fields, specifically in aeronautics and aerospace.
However, the highly porous nature of cellular solids induces experimental difficulties regarding 2D and 3D characterisation. Different morphological parameters, such as density distribution and cell and pore size, are difficult to measure because of sample preparation problems. To understand the application requirements, several design methods are adapted to generate the topology of highly porous composites, such as continuing improved material bounds approach for multiphase, multi-dimensional, isotropic/anisotropic and periodic/non-periodic composites with different physical properties and topology optimisation approach to material design. Frequently, this is performed within a finite element framework and typically involves large numbers of design variables, homogenisation or inverse homogenisation approaches in the design of microstructural materials, which has permitted an increased level of design capability and understanding of underlying material mechanisms.
Characterisation of cellular materials is an important process, allowing the examination of their physical and mechanical properties. While mechanical tests provide insight into material properties, they are not cost-effective and are time-consuming. Alternatively, mathematical and numerical models can assist the mechanical characterisation of such natural materials. This approach is more versatile, allowing refinement of the loading and environmental conditions to appreciate better both the ideal workings of the materials and to assess how the beneficial features of the material can be adapted to different engineering applications. Besides, the introduction of the material property measurements taking into account the material’s density, such as specific modulus or specific strength, will help to understand and to assess the performance of the cellular structural composites. In this context, computational topology design and characterisation have become a prevalent tool in the fields of the structural and material composition.
4
2.1.
CELLS STRUCTURE
The increasing interest in cellular materials is due to the possibility of combining the mechanical properties of the solid material with cellular microstructures. The result is a material with high specific strength with respect to the weight.
The main disadvantage of this type of material is the difficulty in obtaining models that reliably predict its properties, caused by the high complexity of foam geometry and its irregularity. Moreover, the foam presents a structure with a characteristic three-dimensional variability.
Macroscopic properties of a material such as elasticity, thermal conductivity or permeability are profoundly affected by its microstructure. Therefore, the design of modern high-performance materials requires insight into the microstructure of a given material as well as an understanding of its influence on physical properties. Geometric models are essential tools for studying these complex structure-property relations.
Using a model structure, the physical properties of the corresponding material are simulated. Repeated calculations with varying model parameters allow investigating how the material’s properties change with altering microstructure. Thus, instead of producing many sample structures and choosing the best one for a given application, recommendations for good candidates can be obtained by simulation. The increasing capability of simulation algorithms, as well as computer power, allows for higher precision in the simulation results. In return, this requires more and more sophisticated model structures and model-fitting procedures.
The challenge then becomes one of introducing the porosity in such a manner that the mechanical behaviour is optimised for that level of density. The microstructure of the porosity becomes the most important feature controling the macroscale mechanical behaviour. Much of the current and future research intimately relates to understanding and managing the morphological microstructure of the low-density material to achieve specific levels of performance.
The most widely known and used reference is that of L. Gibson & Ashby (1997) and L.J. Gibson (1989). These authors, through their body of work on cellular solids, could be called the pioneers of the modern era in this field. Historically, the interest in ultra-porous materials arose through the fluid side in general and through liquid-induced foams in particular. Cellular forms dominated by surface tension effects have been of interest and even fascination for a very long time going back to the formulation of the basic rules for geometric stability given by Maxwell & Plateau (1874). The modern side has had developments progressing in unison in both the fluids and the solids sides. The fluidic aspects of the subject include the behaviours of liquid foams, types of emulsions, suspensions and a variety of related forms. The solid type applications have already been mentioned. A. M. Kraynik (1998) has given an exceptional review of both, the fluids and the solids forms entitled. The present references should be supplemented with those from that source. Also, M. Kraynik & Warren (1994) have given a review of mechanical behaviour for cellular solids.
One of the principal aspects that has to be mentioned is the concept of minimal surfaces. Cellular forms admit a geometric characterisation regarding the surface content or surface per unit volume. Opening the subject in this manner will give the first differentiation between cellular structures that, ultimately, will be very useful.
5
MANUFACTURING PROCESS
Foams or cellular structures can be manufactured from any material such as metal, polymeror ceramic. The properties of metal foams and other cellular metal structures depend on the properties of the metal, the relative density and cell topology (Section 2.1.2). This work efocuses on metallic cellular solids, so the manufacturing process is going to be centred on this type of material.
Frequently, the process of obtaining is divided into four categories, depending on how they are processed. The foam is formed:
• By vapour phase deposition. • By electrodeposition.
• By processing during the liquid state. • From the liquid state.
Nowadays, the most common processes are:
• Bubbling gas through the metallic union in the liquid state.
• Using an agent that releases gas while decomposing, promoting the formation of foam.
• Consolidating a metal powder with an agent that promotes foam formation, followed by heating to activate the agent.
• “Investment casting.”
• Vapour phase deposition or electrodeposition of metal onto a polymer foam precursor, which is subsequently burned out, leaving cell edges with hollow cores.
Each one of these methods is applied to a specific group of materials, allowing for different relative densities and cells sizes.
Melt gas injection (air bubbling)
Pure liquid metals cannot easily be formed to foam by bubbling gas into them. This is because the resulting foam it is not stable long enough and collapses before the solidification of the metal. In order to solve this inconvenient, small, insoluble, or slowly dissolving particles, such as aluminium oxide or silicon carbide, are added. This increases the viscosity of the aluminium melt and prevents drainage in the bubble membrane, stabilising the foam. The following step is gas-injection through the metal. Several gases can be applied: air, carbon dioxide, oxygen and also water. Bubbles formed in this process tend to float to the melt surface, drain, and then begin to solidify rising to the metal foam, Figure 1.
The thermal gradient in the foam has the function to determine how long the foam remains liquid or semi-solid, and thus the extent of the drainage. Carefully controlling the gas injection process and the cooling rate of the foam allows the production of low relative density, closed-cell foams.
6
Figure 1(a) A schematic illustration of the manufacture of an aluminium foam by the melt gas injection method (CYMAT and HYDRO processes) (b) CYMAT foam microstructure. (M.F. Ashby, A.G. Evans, N.A. Fleck, L.J. Gibson, n.d.)
Gas-releasing particle decomposition in the melt
This process is the same in all the aspect to the one described above, with the exception that the gas is not injected in the melt. An agent of titanium hydride (𝑇𝑖𝐻2) is used.When the
titanium hydride is heated, it begins to decompose into 𝑇𝑖 and 𝐻2, releasing the gas.
The process begins with the addition of calcium to raise the viscosity when the metal is in liquid state. After that, the titanium hydride particles are added and mixed with the metal. Because of the quick decomposition of the particles, the hydrogen gas is rapidly produced, created bubbles and giving origin to the foam, Figure 2.
The process is controlled by the volume fraction of calcium and titanium hydride, by the cooling conditions and the overpressure. Also, it is possible to obtain closed cell foams, since the viscosity is high enough to prevent the link between the bubbles.
Figure 2 The process steps used in the manufacture of aluminium foams by gas-releasing particle decomposition in the melt (Alporas process) (a) Viscosity modification (b) foaming agent addition (c) isothermal foaming (d) cooling of foamed aluminium. (M.F. Ashby, A.G. Evans, N.A. Fleck, L.J. Gibson, n.d.)
7
Consolidation of a metal powder with an agent that promotes the formation of foam
This process employs a mixture of the metallic powder and the gas-releasing agent, 𝑇𝑖𝐻2,
as mentioned above. The mixture obtained is compacted and extruded, generating a solid that is made up of aluminium and 𝑇𝑖𝐻2 particles. This solid is placed inside a shaped mold and
heated. During the heating stage, the agent begins to decompose, releasing gas that expands the melt-solid and forms the foam, Figure 3.
Figure 3 The sequence of powder metallurgy steps used to manufacture metal foams by gas-releasing particles in semi-solids (the Fraunhofer and the Alulight process) (a) Select ingredient and mix (b) Consolidation and extrusion (c) Shaped mold (d) Foaming. (M.F. Ashby, A.G. Evans, N.A. Fleck, L.J. Gibson, n.d.)
Casting using a polymer or wax precursor as a template. “Investment casting.”
This process uses a polymeric foam, with open cells, as the mold for the metallic foam to be produced. The mold is coated with a ceramic slip and then sprayed with ceramic particles. This way, a ceramic shell is obtained. It acts as a negative of the foam that is intended to be made. The next step is to expose the ceramic shell to a thermal cooking cycle where the polymeric material decomposes, leaving the empty space for the introduction of the metal. After the solidification and cooling, the mold materials are removed leaving behind the metal equivalent of the original polymer foam, Figure 4.
8
Figure 4 Investment casting method to manufacture open cell foams (DUOCEL process) (a) Preform (b)Burnout (c) Infiltrate (d) Remove mold material. (M.F. Ashby, A.G. Evans, N.A. Fleck, L.J. Gibson, n.d.)
Metal deposition on cellular preforms
This process entails the same steps to produce the negative for the metal foam described above, where a polymeric foam is employed as a mold for the metal foam. The difference is that, in this process, the metal foam is directly introduced into the polymeric matrix instead of in the investment casting that uses a ceramic negative. This deposition is done by chemical vapour decomposition (CVD), by evaporation or by electrodeposition. The polymeric matrix is burned very rapidly, leaving only the metallic foam.
Figure 5 Schematic illustration of the CVD process used to create open-cell nickel foams (INCO process) (a) Vapor deposition of Nickel (b) Burnout polymer (c) Sinter (Ligament densification). (M.F. Ashby, A.G. Evans, N.A. Fleck, L.J. Gibson, n.d.)
9
MINIMAL SURFACES
The interest in minimal surfaces has existed for a very long time and has been deeply examined, mostly by mathematicians and physicists. The fundamental question is this: what is the repeating cellular form that subdivides space into cells, with the cells having a minimal surface area?. This traditional topic has been advanced into the modern developments and has become of high relevance in understanding the mechanical behaviour of cellular forms. Examining minimal surfaces begins the connection with the effect of microstructure variation, and this approach invests a high degree of order and logic into the proceedings.
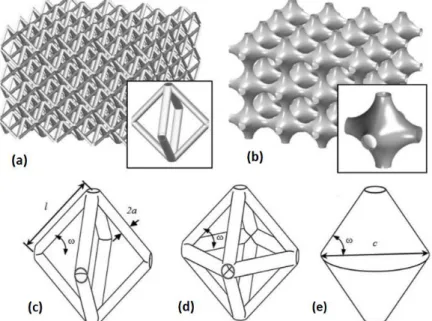
Lord Kelvin (1887), (Thomson, 2008), proposed a minimal surface cellular form and it stood uncontested for over 100 years. The proposed Kelvin cell is that of a truncated octahedron, the tetrakaidekahedron, containing 14 faces, eight hexagons and six squares, as illustrated in Figure 6. The form periodically fills 3-space and repeats.
Figure 6 Kelvin cell (L. Gibson & Ashby, 1997)
In a recent and much-recognised development, (D. Weaire and R. Phelan, 1994) have identified a form with a lower surface content than that of the Kelvin cell. This form contains combinations of two cell types, a 14-sided structure with faces of pentagons and hexagons combined with the 12-sided regular dodecahedron. The average number of sides of the Weaire-Phelan form is 13-1/2.
Figure 7 Weaire and Phelan cell (Buffel, Desplentere, Bracke, & Verpoest, 2014)
A nondimensional measure is needed to compare the surface content of different cell types. A convenient measure is given by
𝜁3𝐷=
𝐴 𝑉23
10
Where 𝐴 is the cell area and 𝑉 is the volume. When two or more cell types are involved, as with the Weaire-Phelan form, the values of 𝜁 is found by averaging on 𝜁3/2 with volume
weighting of the different cell types.
Table 1 3-D surface properties. Planar faces (warped faces) (Christensen, 2000)
Cell Faces (Average) 𝑨
𝑽𝟐/𝟑 Tetrahedra + Octahedra 5-1/3 6.234 Cube 6 6 Rhombic Dodecahedron 12 5.345 Weaire-Phelan 13-1/2 5.310 (5.290) Kelvin 14 5.315 (5.306) Figure 8 Tetrahedra + Octahedra cell
Figure 9 Cube cell Figure 10 Rhombic Dodecahedron
Table 1 presents the surface measure for different cellular forms that fill space. All cases have cubic symmetry, and this is the highest order symmetry that can be obtained by a space-filling periodic repeating cell pattern. The proximity of the Kelvin cell and the Weaire-Phelan cell make them ideal candidates for the study of mechanical properties. Also note that the values of 𝜁 in Table 1 are for planar faces. Allowing the faces to warp can reduce the surface area even a little further as shown by the values for the Kelvin cell and the Weaire-Phelan cell, taken from (D. Weaire and R. Phelan, 1994).
Table 2 2-D surface properties (Christensen, 2000).
Cell Sides (Average) 𝑳
𝑨𝟐/𝟑
Triangular 3 4.56
Square 4 4
Hex-Triang 4 3.95
Hexagonal 6 3.72
Star (Star + Hex) 8 4.56
The quest for minimal surface forms can go further. Polydisperse cell forms can be constructed and evaluated. The standard approach begins with either regular or random point placements, and this involves the construction of Voronoi cells,(A. M. Kraynik, 1998). The resulting forms can be taken in one step further by relaxing the geometry to obtain minimal
11
surfaces using the surface evolver program of Brakke (1992). It has been found that some polydisperse cell forms can have even slightly lower surface content than the forms in Table 1.
Figure 11 Voronoi cell 2-D Figure 12 Voronoi cell 3-D
Thus far, the three-dimensional case has been discussed. The corresponding two-dimensional case is equally well posed, although, historically, the significant interest in the three-dimensional case came first. Table 2 shows the two-dimensional cellular forms with the surface measure (surface per unit thickness) given by
𝜁2𝐷=
𝐿 𝐴12
(2.2) Where 𝐿 is the cell perimeter and 𝐴 is the cell area. The cell types are shown in Figure 6. In the cases where two cell forms are combined, the average 𝜁 is found by averaging 𝜁2 with area
weighting. The hexagonal cell has minimal surface content, as is well understood and
propagated as the ubiquitous ‘honeycomb’. Many other two-dimensional cellular forms could be considered even non-periodic but repeating forms such as the Penrose pattern (Penrose, 1979).
The term relative density is often used being:
𝜌∗ 𝜌𝑠
= 𝜌 𝜌𝑚
= (1 − 𝑐) (2.3)
With 𝜌 being the density of the low material form and 𝜌𝑚 being the density of the composing
material. Polymeric foams used for cushioning, packaging and insulation have relative densities that are usually between 0.05 and 0.2; cork is about 0.14, and most softwoods are between 0.15 and 0.40. As the relative density increases, the cell walls thicken and the pore space shrinks; above about 0.3 there is a transition from a cellular structure to one which is better considered as a solid containing isolated pores.
The required local minimal characteristics in two and three-dimensions are well understood. In 2-D, three cell sides must meet at 120º angles. In 3-D, four cell edges meet at tetrahedral angles, and three surfaces intersect at 120º angles to form the edges. A mathematically-related minimum length (not surface) problem has been formulated by Christensen (1996).
12
Table 3 2-D Mechanical properties (Christensen, 2000)
Microstructure 𝝁 𝑬𝒎 𝑲 𝑬𝒎 𝑬 𝑬𝒎 𝒗 Triangular 1 8(1 − 𝑐) 1 4(1 − 𝑐) 1 3(1 − 𝑐) 1/3 Hexagonal 3 8(1 − 𝑐) 3 1 4(1 − 𝑐) 3 2(1 − 𝑐) 3 1 Star Shaped 3 16(1 − 𝑐) 3 9 16(1 − 𝑐) 3 9 16(1 − 𝑐) 3 ½ GSCM 1 16(1 − 𝑐) 3 1 4(1 − 𝑐) 1 4(1 − 𝑐) 3 1
Holes, Triangle Pattern
𝑪𝑴= 𝝅 𝟑√𝟑 1 12𝐶𝑀 (1 − 𝑐 𝐶𝑀 )1/2 1 6𝐶𝑀 (1 − 𝑐 𝐶𝑀 )1/2 2 9𝐶𝑀 (1 − 𝑐 𝐶𝑀 )1/2 1/3
Holes, Hex Pattern
𝑪𝑴= 𝝅 𝟐√𝟑 1 9𝐶𝑀 (1 − 𝑐 𝐶𝑀 )3/2 1 12𝐶𝑀 (1 − 𝑐 𝐶𝑀 )1/2 4 9𝐶𝑀 (1 − 𝑐 𝐶𝑀 )3/2 1
These minimal surface forms are of high relevance to the mechanical performance problem because, in many cases, the methods of synthesis and manufacture are controlled by phase separation processes with surface tension being the controlling physical effect. Blown foams are the perfect example of this effect. The fundamental question to be answered is this: how do mechanical properties relate to these minimal surfaces, and how would the mechanical properties be affected by cellular forms that are far removed from the minimal surface forms? It is advantageous to begin the examination of mechanical behaviour with the two-dimensional case because the path to understanding is less complicated than for 3-D. Nevertheless, the 2-D case is of great interest and importance.
2-D Mechanical Behaviour
It is appropriate to begin with the 2-D microstructure that is shown in Figure 6 and Table 2. Two-dimensional properties refer to states of plane stress or plane strain. Much of the concern here will be with the case of 2-D isotropy since the state of isotropy is the backbone for understanding all types of behaviour. Hexagonal symmetry assures isotropy of the mechanical properties. Much of the work in this area was initiated by L. J. Gibson & Ashby (1982b). The subject is broadly covered in the book by L. Gibson & Ashby (1997).
Table 3 shows the model for the elastic modulus for different microstructures in the range where the volume fraction of the voids is almost at the limit beyond which material collapse occurs. Properties 𝜇, 𝐾, 𝐸 and 𝑣, are the effective 2-D plane stress shear modulus, bulk modulus, Young’s modulus, and Poisson’s ratio, respectively. The quantity (1 − 𝑐) is the volume fraction of material, which is taken to be very small compared with one, for 𝑐 → 1.
13
Gibson and Ashby first outlined the hexagonal case in Table 3. The triangular and star microstructure properties were given by Christensen (1995), (M.Naghdi, 2013). A great variety of behaviours are evidence in Table 3. Properties proportional to (1 − 𝑐) are recognised to be due to the direct extension or contraction of the material members, while properties proportional to (1 − 𝑐)3, at orders of magnitude of lower levels, are due to bending of the
material members. The triangular, hexagonal and star microstructure forms are probably the three classical forms delineating a variety of properties. Certainly, the first two are so standard as to be conventional, and the third may complete the different picture of different types of behaviour. Probably the properties form in Table 3 for the triangular case have been known for a very long time, but the original credit for these explicit formulas is unknown at this time. The GSCM case is that of the Generalized Self Consistent Method, (Richard M. Christensen, 1993), involving the packing of circular forms of a distribution of sizes. A few of these same cases, as well as others, are analysed and discussed by Torquato, Gibiansky, Silva, & Gibson (1998).
There is an unlimited number of physical arrangements that give isotropic behaviour. The consideration of anisotropic forms is now beginning to be considered in a manner that leads to applications. This is well illustrated by the work of Overaker, Cuitino & Langrana (1998). These authors have examined highly anisotropic 6-sided cellular forms involving re-entrant angles. They show that the negative Poisson’s ratio effect itself is highly anisotropic, with negative values only occurring concerning specific directions of loading relative to the microstructure. They discuss applications of such forms using the ‘anchoring’ effect related to negative Poisson’s ratios.
Consideration of strength is equally important as that of the stiffness and compliance properties. In the very low-density region, the buckling of the micro-material members is the dominant mechanism. This occurs not only in a state of compression but can occur in tension also. With regards to the periodic microstructure, the strength properties can be highly anisotropic, even when the symmetry is not available. This remains to be developed. Specific discussions of failure mechanisms and behaviour are given by L. Gibson & Ashby (1997).
The physical reality of most cellular forms is that they seldom conform to the idealised microstructure, due to manufacturing methods and tolerances and due to general aspects of usage. The corrupting influences include imperfect connectedness and non-aligned micro-member geometry. Grenestedt (1998), has performed a study on the effect of the ‘waviness’. It was shown that such imperfections, within the realistic range, have a sharply degrading impact upon properties. The implications of this are equally crucial to the three-dimensional case.
The most significant example of this class of materials is that of the honeycomb core for sandwich materials. As shown by Allen (1969), Noor (1996) and Vinson (1999), the core in sandwich construction can be a limiting factor for this type of design.
The in-plane strength and failure mechanisms of honeycomb materials have been extensively studied by Papka & Kyriakides (1998). In general, instabilities develop locally and spread with increased loading. The stress-strain curve typically exhibits a plateau region. These same authors also have studied cellular forms involving single size circular rings or cylinders packed in a hexagonal manner. The same general features of behaviour evolve in this case. The out of plane compression of these types of materials involves a kind of buckling followed by plastic deformation. Large amounts of energy can be absorbed during crushing, making such
14
forms ideal for crash protection. This important topic is accosted by Santosa & Wierzbicki (1998).
Returning to sandwich forms, there is an opportunity to develop different core material forms for various types of applications. For example, honeycomb does not easily conform to curved shapes, other types of cores are more suitable for this application.
3-D Mechanical Behaviour
The full-blown case of low-density materials in 3-D forms and applications is a vibrant, active and diverse field. In contrast to the 2-D case, a significant new distinction arises in the 3-D case. This is the circumstance of the open cell form versus the closed cell form. Both cases are of great importance and must be treated separately. At first consideration, it can be said that the open cell form favours strength, and the closed cell form favours stiffness, as idealisations. However, the problem is much subtler than that. Much depends on the technique and quality of manufacture, and often other design requirements take precedence, such as using closed cell forms to prevent moisture penetration.
Figure 13 Open-cell (left), Closed-cell (right) (L. Gibson & Ashby, 1997)
First, consider the open cell case. The relevant cell type to consider would be the Kelvin cell, a truncated octahedron. This has been done by Warren and Kraynik (1997). Several new ingredients arise in the 3-D case that do not exist in the 2-D case. First, for those materials that are synthesised by a phase separation process, there is a process sequence of forming minimal surface cell followed by evacuation of the material from the faces into an aggregation along the cell edges, leaving the open cell form. The consequence of this process is that the intersection of three Plateau borders forms the cross-section of the material members, (A. M. Kraynik, 1998), involving convex circular arcs or some approximation thereof. Another complication is that the micro-material members can not only undergo bending as in the 2-D case but can undergo torsion as well. It can be shown that the torsion effects are of the same order as the bending effects and cannot be neglected.
The Kelvin cell aggregation has cubic symmetry, with three independent elastic properties. Warren and Kraynik (Warren & Kraynik, 1997), show that the properties are almost isotropic, to within a few percents. In one of the most important results, they reveal the particular case in which the cubic properties form reduces precisely and identically to the case of isotropy. This case is that which occurs when the material members have a circular cross-section and when the material Poisson’s ratio is 𝑣𝑚= 0. In this case, their results give the isotropic bulk
15 𝑘 𝐸𝑚 =1 9(1 − 𝑐) (2.4) and 𝜇 𝐸𝑚 =4√2 9𝜋 (1 − 𝑐) 2≅1 5(1 − 𝑐) 2 (2.5)
The fact that this case involves cross-section members, rather than those with Plateau borders does not detract from its significance. The circular case can be taken as the base-line behaviour. The shear properties of the Plateau border case are considerably larger than the above value due to the increased bending and torsional rigidity. A. M. Kraynik (1998) discusses results for the cell types, such as the Weaire-Phelan cell and poly-disperse forms.
It is seen that the properties just stated involve the bulk modulus dominated by the direct mechanism of deformation, while the shear modulus is given by the bending (and torsion) mechanism. The situation is akin to that which occurred in the 2-D case, both cases with cell forms simulating the minimal surface cell.
As with the 2-D case, there is a behaviour that involves only the direct mechanism. This isotropic result was first given by Gent & Thomas (1959), as deduced, not from any particular cell type. The bulk modulus is the same as provided above, but the shear modulus and Young’s are given by 𝜇 𝐸𝑚 = 1 15(1 − 𝑐) (2.6) and 𝐸 𝐸𝑚 =1 6(1 − 𝑐) (2.7)
It should also be noted that Ko (1965) was one of the very early contributors to the field with studies of several cell types. L. J. Gibson & Ashby (1982a) analyse and discuss 3-D material behaviour regarding all properties involving the bending mechanism. Table 4 provides a summary of the different bending mechanics study by L.J. Gibson and Ashby.
Table 4 Elastic moduli and strength of foams (L.J. Gizbson, 1989)
Deformed cell Analysis Foam property
Solid cell Wall properties: Density 𝜌𝑠 Young’s modulus 𝐸𝑠 Yield strength 𝜎𝑦𝑠 Modulus of rupture 𝜎𝑓𝑠 𝜌∗ 𝜌𝑠 ∝ (𝑡 𝑙) 2 (2.8) 𝑙 ∝ 𝑡4
16 𝜎 ∝𝑃 𝑙2 ε ∝𝛿 𝑙 δ ∝𝑃𝑙 3 𝐸𝑠𝐼 𝐸∗ 𝐸𝑠 = 𝐶1( 𝜌∗ 𝜌𝑠 ) 2 ≈ (𝜌 ∗ 𝜌𝑠 ) 2 (2.9) 𝐺∗ 𝐸𝑠 = 𝐶2( 𝜌∗ 𝜌𝑠 ) 2 ≈ 3 8( 𝜌∗ 𝜌𝑠 ) 2 (2.10) 𝑣∗= 𝐶 3≈ 1 3 𝜎𝑒𝑙∗ ∝ 𝑃𝑐𝑟 𝑙2 𝑃𝑐𝑟∝ 𝐸𝑠𝐼 𝑙2 𝜎𝑒𝑙∗ 𝐸𝑠 = 𝐶4( 𝜌∗ 𝜌𝑠 ) 2 = 0.05 (𝜌 ∗ 𝜌𝑠 ) 2 (2.11) 𝜎𝑝𝑙∗ ∝ 𝑃∗ 𝑙2 𝑃∗∝𝑀𝑝 𝑙 𝑀𝑝∝ 𝜎𝑦𝑠𝑡3 𝜎𝑝𝑙∗ 𝜎𝑦𝑠 = 𝐶5( 𝜌∗ 𝜌𝑠 ) 3 2 = 0.3 (𝜌 ∗ 𝜌𝑠 ) 3 2 (2.12) 𝜎𝑐𝑟∗ ∝ 𝑃∗ 𝑙2 𝑃∗∝𝑀𝑓 𝑙 𝑀𝑓 ∝ 𝜎𝑓𝑠𝑡3 𝜎𝑐𝑟∗ 𝜎𝑓𝑠 = 𝐶6( 𝜌∗ 𝜌𝑠 ) 3 2 = 0.65 (𝜌 ∗ 𝜌𝑠 ) 3 2 (2.13)
17 𝜎𝑙𝑜𝑒 ∝𝜎1(𝜋𝑎) 1/2 (𝜋𝑙)1/2 ∝𝑀𝑓 𝑙3 𝑀𝑓 ∝ 𝜎𝑓𝑠𝑡3 𝐾𝑙𝑒∗ ∝ 𝜎𝑙(𝜋𝑎)1/2 𝐾𝑙𝑒∗ 𝜎𝑓𝑠 𝐶7(𝜋𝑙) 1 2(𝜌 ∗ 𝜌𝑠 ) 3 2 = 0.65(𝜋𝑙)12(𝜌 ∗ 𝜌𝑠 ) 3 2 (2.14)
Now consider closed cell forms. The work of Christensen (1998) has used the Generalized Self Consistent Method to obtain the following predictions for the isotropic bulk and shear moduli. 𝑘 𝐸𝑚 = 2 9(1 − 𝑣𝑚) (1 − 𝑐) (2.15) and 𝜇 𝜇𝑚 =1 3(1 − 𝑐) (2.16)
A. M. Kraynik (1998) has used and discussed finite element models to obtain results for the case of 𝑣𝑚= 0.49. These results for the Kelvin cell and the Weaire-Phelan cell are nearly
isotropic and in quite close agreement with the above analytical solution results. The shear moduli involve a direct resistance mechanism as shown by the (1 − 𝑐) dependence in contrast to the open cell case. It is quite interesting to note that the above analytical solution predicts the value for 𝜇/𝜇𝑚 to be independent of Poisson’s ratio 𝑣𝑚. This unexpected result could be
checked against numerical solutions. It is seen that the closed cell form, from the point of view of effective moduli, provides a much more efficient material utilisation than does the open cell form.
The large deformation properties of low-density material present a challenge. Budiansky & Kimmel (1987) considered forms appropriate for the behaviour of lung tissue. Zhu, Mills & Knott (1997) have studied open cell forms using the Kelvin cell and performing elastic type analyses with local material buckling at large compressive strains. They found a strong dependence of the nonlinear stress-strain curve upon the direction of deformation. Even though the form is nearly isotropic in the small strain range, there is no reason to expect any form of isotropy in the vast deformation range. Although typical stress-strain curves often show a plateau type behaviour at sufficiently large strains, A. M. Kraynik (1998) and Zhu et al. (1997) found a few cases in which no plateau region exists. Strength considerations are not extensively treated for these materials, and this represents a significant opportunity area. Compressive strength is the limiting condition due to bucking of the micro-material thickness will be much less in the closed cell form than in the open cell form, favouring the open cell form for strength. General considerations on the effect of imperfections as seen in Grenestedt (1998), are probably even more critical in the three-dimensional case than in 2-D.
18
Low-density material forms, both closed and open cell, are made with the full spectrum of material types, metals, polymers and ceramics. Polymers have been the traditional materials for these forms, but other materials are also rapidly progressing. A survey of opportunities with cellular metallic forms is given by Evans, (Anthony G. Evans, Hutchinson, & Ashby, 1998). Related studies by Evans, (A. G. Evans, Hutchinson, & Ashby, 1998), and Sugimura, Rabiei, Evans, Harte, & Fleck, (1999) have given detailed morphology characterisation using synchrotron X-ray tomography for aluminium open cell forms and shown the mechanical behaviour to be as predicted by the theoretical forms in the literature. It is likely that an extensive variety of forms and applications will emerge using all material types in cellular forms.
As mentioned in connection with two-dimensional behaviour, negative Poisson’s ratio effects can be induced by controlling the material microstructure. Choi & Lakes (1992) and Choi & Lakes (1995) have shown how the re-entrant angle form can produce these effects and how the effect can be employed. This is, in fact, an excellent example of how cellular materials can be designed to produce specific desired effects.
Up until this point, all low-density material types have been based upon specific cellular forms. This characteristic is not required; low-density forms can exist with no discernible cellular morphology. Aerogel materials are the perfect example of such forms. These materials exist in the ultra-low-density range, and the morphological characteristic is best described on a scale not too much larger than that of angstroms, with forms sometimes called a ‘string of pearls’. Mechanical characterisation of these materials has been given by Scherer, Smith, & Stein (1995).
Cellular forms would not be complete without mentioning the mechanics of bio-materials in general. However, this topic is too extensive, and it is not the central aspect of this work. More information on this topic is presented in Kinney & Ladd (1998) and Yang et al. (1998).
SIZE EFFECTS
One important characteristic that is essential to take into account is the mechanical properties upon which size depends. The stiffness of the sample depends significantly on relation between cell size and the size of the sample. The state of the surface as either homogenous or heterogeneous and the way how the surfaces are interconnected or loaded in the tests also have an influence..
In the case of the traction, compression and bending test, it has been verified that the measured modulus decreases when the size of the sample decreases. In the shear test, the opposite occurs, with decreasing sample sizes leading to increasing shear moduli.
UNIAXIAL COMPRESSION AND TRACTION TEST
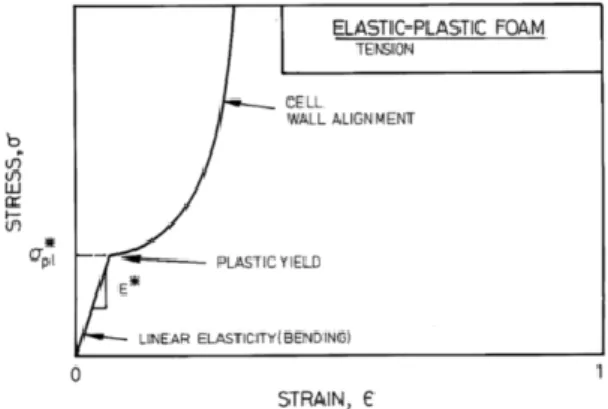
The tension curve deformation of an uniaxial compression test L. J. Gibson & Ashby (1989) is illustrated in Figure 14.
19
Figure 14 Stress-strain graphic representation of a compression test (L. Gibson & Ashby, 1997) It is possible to differentiate three characteristic zones. In the first zone, the material presents an elastic deformation, thereby exhibiting a linear evolution of stresses and strains. The internal distribution of the cells represents an essential influence in the deformations mechanisms. For foams with low density and open-cells, the elastic deformation occurs because of the bending of the cells unions. With respect to the increase in density, the contributions of the cells unions are more significant. In the case of closed-cells, the stiffness increases because of the contribution of the wall. The air compression inside the cells also plays a significant part in the stiffness increase in closed-cells.
The second zone corresponds to deformation with almost constant stress. This is because of the collapse of the cells. This type of collapse depends on the material being either fragile or plastic. The collapsing occurs when the stress exceeds acertain value, and it spreads in a plane perpendicular to the stress direction. The collapsed zone increases as far the strain increases. The plastic collapse in elastic-plastic foams results in a horizontal development in the stress-strain graphic. This is one of the principal characteristics of cellular materials, as it concerns energy absorption.
The third zone is related to the densification of the material. As the strain increases, the cell walls come in contact generating a rapid increase of the stress to the strain.
Figure 15 shows the values of the strain stress in a traction test L. J. Gibson & Ashby (1989).
Figure 15 Stress-strain graphic representation of a traction test (L. Gibson & Ashby, 1997) The initial response in the traction test is linearly elastic; this is because of bending of the cell walls. In ductile materials and as the strain increases, the cells walls suffer rotations, trying to align with the direction of the stress. These rotations generate an increment in the foam stiffness until fracturing occurs.
20
MATERIAL PROPERTIES
As mentioned above, the properties of cellular solids have two significant reliable parameters. There are those that describe the geometric structure of the foam- the size and shape of the cells. And there are parameters that define the intrinsic properties of the material of which the cells are made.
Regarding the composition of cellular solids, there are three large groups of materials: polymers, ceramics and metal.
Polymeric foams were the first developed into cellular solids. Their large energy absorption capacity enables them to be to used for packaging or for protection against shock (such as helmets). This explains a large number of recent studies on the compressive behaviour of this type of foams: PVC, polyurethane and polypropylene (for the 3D rendering of these materials). Polymer foams are also widely used as templates to process ceramic metal foams.
Ceramic foams are used in a wide range of applications: filters, solid oxide fuel cells, construction materials (cellular concrete plasterboards) and biomaterials. Many publications describe work with bone substitutes and attempt to compare their mechanical properties or focus on the interaction between bone substitutes and natural bones.
Metal foams constitute the relatively recent class of cellular solids. As polymeric foams, their lightness and energy absorption capacity is absorbing, but they can be used at higher temperatures. Moreover, cellular metals are stronger than cellular polymers and tougher than cellular ceramics. This combination of properties is very interesting in load-bearing applications (sandwich cores) or in applications that require shock absorption (automobile, helmet, packaging and cushions). Several authors have thus investigated the mechanical behaviour of aluminium alloy foams because of their set of interesting properties: low weight, high strength, ductility, corrosion, resistance, and recyclability. More recently, metallic materials based on other metals (copper alloy, nickel, steel and titanium) have also been investigated.
2.2.
HONEYCOMB (2-D CELLULAR SOLID)
The honeycomb of the bee, since it is a regular array of prismatic hexagonal cells, epitomises the two dimensional cellular solid. The term honeycomb is a way to describe any array with identical prismatic cells that nest together to fill a plane. The cells are usually hexagonal in section, just like they are in the bee’s honeycomb, but they can also be triangular, or square, or rhombic.
One of the reasons for studying honeycombs is that the results shed light on the mechanics of the much more complicated three-dimensional foams. Analysing foams is a challenging topic: the cell walls form an intricate three-dimensional network that distorts during deformation in ways that are hard to identify. In this aspect, honeycombs are much easier. Large-scale models can be made of rubber, metal or ceramic; and their deformations modes observed and classified. Because the honeycomb has a regular geometry, its deformations can be analysed more or less precisely with five equations that describe their properties. Finally, the results can be checked by experimental models.