i
i
F o r e s t
F o r e s t
Biogeosciences and Forestry
Biogeosciences and Forestry
Estimation of stand crown cover using a generalized crown diameter
model: application for the analysis of Portuguese cork oak stands
stocking evolution
Joana A Paulo, Sónia P Faias,
Célia Ventura-Giroux,
Margarida Tomé
A generalized non-linear tree crown diameter model was developed with the aim of allowing the computation of tree crown diameter over a large range of tree dimensions, and allowing its inclusion in forest growth and yield models. The model was formulated to provide biological meaning to the predicted va-lues. Due to the nested structure of the data analyzed (trees within stands), both mixed- and fixed-effect models were developed. Since tree crown diame-ter is not frequently measured in forest inventories, the validation of the mi-xed model was carried out by considering the population specific response. The results demonstrate that when the measurements required for the mixed model calibration are not available, the use of the fixed effect model results in less biased and more accurate estimates. The fixed model was applied to the data from the two last Portuguese National Forest Inventories (NFI) to analyze the change in stand crown cover and assess the stocking evolution of cork oak stands in Portugal between 1996 and 2006. Results showed an increase in the frequency of stands with crown cover lower than 20%, as well as a decrease in the frequency of stands with crown cover between 20 and 40%. Average crown cover values were significantly different in the two NFI, with a decrease from 28.0 to 26.5% over the considered period.
Keywords: Quercus suber, Stand Crown Cover, Tree Crown Diameter, Nonlinear Mixed Effects Model, Nonlinear Fixed Effects Model, Portuguese National Fo-rest Inventory
Introduction
Stand crown cover is an important varia-ble for the assessment of forest producti-vity and sustainability. Its computation re-quires the measurement or estimation of the tree crown diameter, which is time-consuming and cost expensive, and there-fore is not frequently measured in there-forest inventories. This has led to the develop-ment of generalized crown diameter mo-dels to this purpose (Gill et al. 2000, Con-des & Sterba 2005, Thorpe et al. 2010).
In the last decade, crown diameter mo-dels have been developed for cork oak (Quercus suber L.) by Paulo et al. (2002), Sánchez-González et al. (2007) and Paulo &
Tomé (2009). In particular, Paulo et al. (2002) developed a linear relation between diameter at breast height (dbh) and tree crown diameter (cw) with a limited data set collected on two typical low densities stands (varying from 67 to 97 tree ha.1).
From a biological standpoint, linear rela-tionships can only be applied to young stands, when both variables are in the li-near phase of the growth curve. In older stands, the relationship between diameter and crown width growth is no longer li-near. Therefore, the usage of linear models as done by Paulo et al. (2002) is considered not suitable for the application to a large geographical scale. A crown diameter
mo-del was developed by Sánchez-González et al. (2007) using a large data set from the second Spanish National Forest Inventory (NFI), where all trees with diameter at breast height above 7.5 cm were measu-red. Despite considering five alternative model functions (linear, parable, power, monomolecular and Hossfeld II), none of these was formulated in order to reflect biological characteristics, such as the exis-tence of an upper asymptote in the rela-tionship between diameter and crown width. The final selected model was a con-cave parabolic function which included the quadratic mean diameter under cork as independent variable and a value of zero for model interception. Due to its formula-tion, this model predicts, for some combi-nations of diameter at breast height and quadratic mean diameter, a decrease of tree crown diameter for larger diameters. Thus, this model also can not be conside-red suitable from a biological standpoint.
Despite several supporting measures for combating forest dieback across European Union countries (Requardt et al. 2009), cork oak tree mortality is currently increa-sing and is one of the main concerns for the future sustainability and productivity in Mediterranean oak woodlands. Its cause is likely due to the interaction of several bio-tic and/or abiobio-tic factors (Sousa et al. 2007). According to the Portuguese NFI, a
Universidade de Lisboa, Instituto Superior de Agronomia, Centro de Estudos Florestais, Forest Ecosystem Management under Global Change research group (ForChange), Tapada da Ajuda, 1349-017 Lisbon (Portugal)
@
@
Joana A Paulo ([email protected])Received: Feb 27, 2015 - Accepted: Jul 28, 2015
Citation: Paulo JA, Faias SP, Ventura-Giroux C, Tomé M (2015). Estimation of stand crown
cover using a generalized crown diameter model: application for the analysis of Portuguese
cork oak stands stocking evolution. iForest 9: 437-444. – doi: 10.3832/ifor1624-008 [online
2015-12-02]
Communicated by: Rupert Seidl
Research Article
Research Article
doi:
doi:
10.3832/ifor1624-008
10.3832/ifor1624-008
vol. 9, pp. 437-444
vol. 9, pp. 437-444
decrease in the stocking of stands has been recorded – from an average stand density of 85 to 65 trees ha-1 –, as well as in
stand basal area under cork – from 5.72 to 4.82 m2 ha-1 (DGF 2001, AFN 2010), with
con-sequent losses in cork production and car-bon sequestration (Paulo & Tomé 2010b, Coelho et al. 2012) that impact the Por-tuguese forests and economy. However, information is lacking on another variable that is important for the analysis of stand stocking, i.e., stand crown cover.
Cork oak stands are generally managed as agroforestry or silvopastoral areas, with crown cover traditionally used for defining stand stocking limits according to the ma-nagement objectives, i.e., cork, pasture and/or animal production (Natividade 1950,
Montero & Cañellas 2003).
The main objective of this research is the development of a generalized non-linear model for the tree crown diameter predic-tion that can be used for a large range of tree diameter values and that is biologically representative, in order to allow its inclu-sion in growth and yield models such as the SUBER model (Paulo & Tomé 2010a, 2010b, 2014, Paulo 2011, Paulo et al. 2011), NFI data sets and other plot types where the lower threshold of diameter at breast height (dbh) over cork is 2.5 cm. All candidate mo-dels were formulated to ensure biologically meaningful predictions, as suggested by Burkhart & Tomé (2012). The developed model will be applied to the data from the last two Portuguese NFI (DGF 2001, AFN
2010), allowing the assessment of the evo-lution of stands crown cover in Portuguese cork oak stands between 1996 and 2006.
Material and methods
Data collection
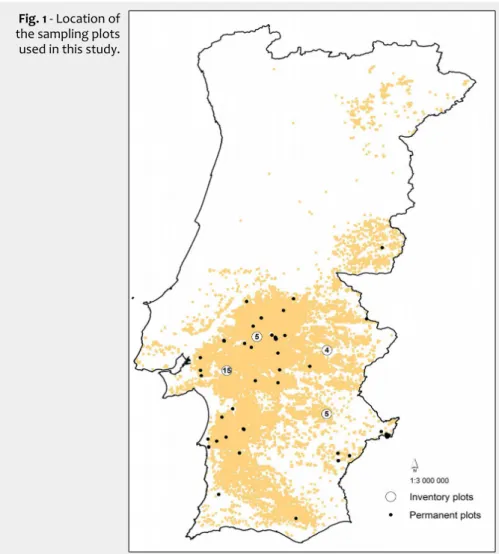
Tree crown diameter (cw) was computed at tree level as the average of crown radius measurements taken on the four main car-dinal points. The data set used to fit the tree crown diameter model consisted of 12 768 observations, measured on 320 per-manent plots spread over the distribution range of cork oak in Portugal. Permanent plots had a circular shape with an area of 2827 m2. A set of independent observations
was also used to validate the selected mo-del. This additional data set consists of 1373 observations taken at 29 forest inventory plots (circular plots of 2827 m2). All plots
were located in cork oak pure stands. Fig. 1 shows the distribution of the plots used in this analysis.
For both the above data sets the follo-wing stand parameters were calculated: number of trees per hectare (N), basal area (Gu), dominant diameter (dudom), domi-nant height (hdom) and quadratic mean diameter (dug). All stand variables related to tree diameter refer to diameter under cork (du in cm). This variable was com-puted by subtracting cork thickness (ct in mm) measured with a caliper on trees with mature cork (du = d - 2ct/10), or using the model presented by Paulo & Tomé (2014) for the estimation of dbh under cork in trees presenting virgin cork at breast height (undebarked trees). Only trees with dbh over cork > 7.5 cm were considered in the computation of the above stand varia-bles. This definition allows the application of the proposed model in future national forest inventory data analysis. Nonethe-less, the developed model can be applied to all trees over 2.5 cm of dbh over cork, as this threshold was used for tree measure-ments in the plots for both the fitting and the validation data sets. Due to the low average density of cork oak stands, domi-nant trees were defined as the 25 thickest trees per hectare (Paulo et al. 2015). The range of values characterizing the fitting and validation data sets is presented in Tab. 1.
A total of five distance-independent com-petition indexes were computed (Burkhart & Tomé 2012), namely: the ratio between the tree diameter under cork (du) and the dominant diameter (du_dudom), between du and the quadratic mean diameter (du_dug), and between du and the maxi-mum diameter (du_dumax). Additionally, two competition indexes (indicated as G>du1 and G≥du2) were computed as the
sum of the basal area of all trees with a diameter larger than the subject tree, and the sum of the basal area of all trees with a diameter greater than or equal to that of the subject tree, respectively.
Fig. 1 - Location of
the sampling plots used in this study.
Tab. 1 - Summary statistics of the data sets used for fitting and validate the models
developed in this study. (du): diameter at breast height under cork; (cw): crown diam-eter; (hdom): dominant height; (dudom): dominant diamdiam-eter; (dug): quadratic mean diameter; (N): number of trees per hectare; (Gu): basal area under cork.
Data set Value (m)cw (cm)du (cm)dug hdom(m) (ha)N (mGu2)
Fitting (n=12768) MinimumMean 0.44.7 20.70.6 18.53.9 2.19.1 2914 0.028.03 Maximum 19.8 128.9 57.3 18.2 929 30.12 Validation (n=1373) MinimumMean 0.24.9 21.90.6 10.818.8 7.28.5 37535 10.913.34 Maximum 21.5 112.7 48.5 11.9 792 39.11
iF
or
es
t
–
B
io
ge
os
ci
en
ce
s
an
d
Fo
re
st
ry
National Forest Inventories data
The NFI carried out in 1995-1996, desig-nated as IFN4 (DGF 2001), includes 371 measured plots, while the 2005-2006 NFI, designated as IFN5 (AFN 2010), includes 970 plots. Tree diameter at breast height was measured in both inventories, tree to-tal height was measured for dominant trees in IFN5 and tree crown diameter was measured in sample trees in IFN4. Their va-lues are published in official reports (DGF 2001, AFN 2010).
Crown diameter model fitting
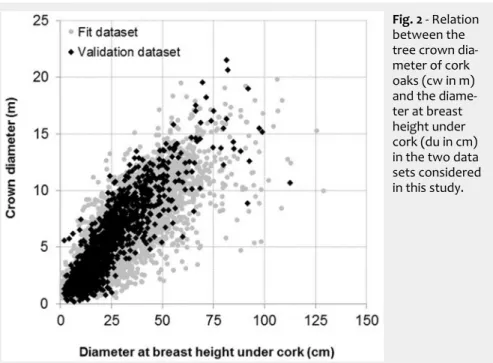
Candidate models for the relationship between tree height and diameter were obtained from the list proposed by Paulo et al. (2011). Among the 33 models original-ly proposed by Huang et al. (2000), Paulo et al. (2011) selected those increasing mo-notonically and showing an upper asymp-tote. The existence of an inflection point (Lei & Parresol 2001) was not considered compulsory, since the relation between tree diameter and tree crown variables did not show any inflection point. This is sup-ported by data measurements observed for both the fitting and the validation data sets (Fig. 2), as well as by previous reports for cork oak (Sánchez-González et al. 2007) and other species (Condes & Sterba 2005).
Some of the candidate functions had to be modified from their original form in order to ensure consistent values at the point (du, cw) = (0, cw0), where cw0 is a
positive value corresponding to the tree crown diameter when the individual tree reaches 1.30 m of total height. Since cw0
has to be estimated, such candidate mo-dels included an additional parameter as compared with their original formulation by Huang et al. (2000). No limits were con-sidered for the number of parameters to be included in the model.
Overall, ten candidate models were se-lected for further analyses (see Tab. S1 in Appendix 1). Fitting of the selected candi-date functions was carried out using the data from each plot and the nonlinear least squares (NLS) method implemented in the SAS® MODEL procedure (SAS Institute
2011a). To ensure meaningful estimates, on-ly plots with more than 30 observations were considered. The mean square error of prediction (MSEi) for plot i was calculated
for each candidate model as follows (eqn. 1):
where êij is the residual from the j-th tree in
the i-th plot and ni is the number of trees in
the i-th plot. The sum of MSE obtained for each plot (∑MSE) was computed for each function, and used as a criterion to select the best-fitting candidate model (Paulo et al. 2011). Additional criteria were the adjus-ted R-square (adj-R2) and mean square
error (MSE) obtained by fitting each
equa-tion to the complete fitting data set. Values predicted by the selected model for each plot were plotted against the observed stand variables for all the para-meters considered, as well as against the tree competition indexes values calculated for each corresponding plot and tree. In addition, regression analysis was carried out by ordinarily least squares, in order to identify which parameters of the model were mostly related to the stand variables and/or tree distance-independent competi-tion indexes. In order to avoid multicolli-nearity problems due to overparametriza-tion of the model, only variables largely correlated with the estimated coefficients were included (Paulo et al. 2011). After the model parameters have been expressed as a function of these variables, the model was finally refitted using the complete fit-ting data set, and the significance of coeffi-cients assessed by asymptotic t-tests.
Heteroscedasticity was frequently detec-ted by plotting the studentized residuals
versus the predicted values for each tree
variable. To overcome this problem, two alternative weight functions were tested. The weight functions were defined as (eqn. 2, eqn. 3):
where wij is the weight given to the
obser-vation, cwij is the predicted value of crown
diameter and i, j are the plot and tree indexes, respectively. The selection of the weight function was made based on the Akaike’s information criterion (AIC) and MSE values obtained. The model obtained at this stage was designated as the fixed effects model.
The fixed effects model was finally refit-ted using a mixed model approach
(Pin-heiro & Bates 2000). Due to the nested structure of the data (trees inside plots), random effects associated to the plot were tested on each of the fixed model parame-ters using the SAS® macro NLINMIX (SAS
Institute 2011b), and resulted in three alter-native mixed effects models, whose formu-lation differed in the parameter including the plot random effect. The selection of the best-fitting mixed-effect model was carried out based on the Akaike’s informa-tion criterion (AIC) and MSE values.
Evaluation of model performances
The evaluation of the predictive perfor-mance of the models (model validation) was carried out using the independent vali-dation data set on the following models: (i) the fixed-effect and (ii) the mixed-effect models developed in this study; (iii) the fixed-effect model proposed by Paulo et al. (2002); and (iv) the mixed-effect model de-veloped by Sánchez-González et al. (2007). The model proposed by Paulo & Tomé (2009) was not considered since its appli-cation is restricted to young trees.
The mixed effect model validation may be carried out considering the model popula-tion or subject specific response. The latter requires the measurements of the respon-se variable (crown diameter) in a subsam-ple of trees in the plot, a process called ca-libration procedure (Fang & Bailey 2001, Meng & Huang 2009). Since the models developed in this study were applied at data collected on forest inventories (where no measurements of tree crown diameter were made), the validation was carried out considering the population specific res-ponse. In this case, the mean responses were obtained with the fitted nonlinear mixed effects models by setting to zero the random effects. This allowed to test the usefulness of the inclusion of random parameters in the model in the case the calibration procedure was not applicable.
Fig. 2 - Relation
between the tree crown dia-meter of cork oaks (cw in m) and the diame-ter at breast height under cork (du in cm) in the two data sets considered in this study.
iF
or
es
t
–
B
io
ge
os
ci
en
ce
s
an
d
Fo
re
st
ry
MSEi=∑
j =1 nij ( ^eij) 2 ni−1 wij= 1 cwij 2 wij= 1 ecwijcw=25.123⋅e
(
−58.346+3.490 du
dug+ub
17.919+du
)
Model efficiency was calculated as the proportion of variation explained by the model (Ef – eqn. 4):
where ri is the residual for observation i; yi
is the tree crown diameter for observation
i, y̅ is the mean value of the tree crown diameter from all the observations and n is the number of observations in the valida-tion data set.
To evaluate the model bias, the mean value of residuals (Mr) was calculated as follows (eqn. 5):
and the mean of absolute residuals (Mar) was computed to evaluate the model pre-cision (eqn. 6):
The 5th and 95th percentiles (p5 and p95)
of the distribution of residuals were also computed. Models obtained from the ap-plication to the validation data set were also compared by plotting their predicted values in the same diagram in order to help assessing their predictive performances.
Analysis of stand stocking values in
Portuguese cork oak stands
To analyze pure cork oak stands stocking
from IFN4 to IFN5, tree crown diameter was estimated for each tree in the inven-tory plots using the model selected based on the criteria mentioned above. The pre-dicted tree crown diameters allowed to assess the stand crown cover, expressed as a percentage. For each of the IFN4 and IFN5 data sets, these values were grouped into classes with a 10% range. Due to the low frequency of stands with more than 50% of stand crown cover, all stands above this threshold were included in a single class. Using the IFN4 values as a reference, percent variation of each crown cover class was determined for the period 1996-2006 (IFN4 and IFN5).
The average stand crown cover of pure cork oak stands in Portugal was computed for the years 1996 and 2006. Crown cover mean values of the IFN4 and IFN5 plots were compared using a two-samples t-test. Equal variances of the two samples com-pared was verified by an F-test.
Results
Crown diameter model fitting
The full list of candidate models tested in this study is reported in Tab. S1 (Appendix 1). Models 1, 4 and 8 had the best good-ness-of-fit statistics and achieved conver-gence for all plots (Tab. 2). Models 4 and 8 performed slightly better than model 1, and were therefore considered for the fur-ther analyses.
The strongest relationships for model parameters were found between dominant height (hdom) in model 4 (parameters b and c) and du_dug competition index (i.e., the ratio between tree diameter and stand
quadratic mean diameter under cork) in model 8 (parameter b). In both models the parameter a, associated to the asymptote value, had the weakest relationship to any of the considered variables. As dominant height was not available in forest inventory data, model 8 (including the parameter b expressed as function of du_dug) was se-lected for the next stage. The fixed effects model was therefore defined as (eqn. 7):
cw=28.502⋅e
(
−66.436+4.201 du
dug
19.817+du
)
Since the selected model includes three parameters, a total of three alternative mi-xed effects models were tested, each mo-del including the random effect (ui) in one
of the parameters a, b or c. The inclusion of a random effect to parameter c caused the model not to converge, as well as the inclu-sion of more than one random effect in the model. After comparison of the AIC values for the three alternative mixed effect mo-dels, the mixed model including a random parameter in the parameter b (ub) was
selected. Hence, the random effect model was formulated as follows (eqn. 8):
Tab. 3 reports the parameter estimates and variance components for both fixed-and mixed-effect crown-diameter models.
Assessing predictive performances
Validation statistics were used for the comparison of the predictive performances of the fixed and random models developed here, as well as of the models proposed by Paulo et al. (2002) and Sánchez-González et al. (2007). The results of the validation step are presented in Tab. 4. The fixed ef-fects model developed in this study pre-sented very similar results to those obtai-ned using the model by Sánchez-González et al. (2007). Contrastingly, the model by
Tab. 2 - Fitting statistics obtained for candidate models 1, 4 and 8. Only the models for
which convergence was achieved in all plots are shown.
Model SMSE Adj-R² MSE
1 57.99 0.800 1.81
4 57.82 0.806 1.76
8 58.27 0.806 1.76
Tab. 3 - Parameter estimates and variance components for the selected models.
Stats Param Fixed Effects Model Mixed Effects Model
Estimate Pr>|t| Lower Upper Estimate Pr>|t| Lower Upper
Fixed Parameter a 28.5024 <0.0001 27.2894 29.7155 25.1226 <0.0001 24.0906 26.1546 b0 66.4364 <0.0001 63.0029 69.8699 58.3459 <0.0001 54.9818 61.71 b1 4.2013 <0.0001 3.7377 4.6649 3.4903 <0.0001 2.7093 4.2713 c 19.8168 <0.0001 18.9521 20.6816 17.9188 <0.0001 16.8642 18.9733 Variance of random effects - - - 28.0575 - 23.428 34.2169 Residual variance - 0.06374 - 0.06221 0.06534 0.04992 - 0.0487 0.05119
Tab. 4 - Validation statistics for the fixed and random models compared in this study.
Model Mr Mar p5 p95 EF Fixed effects -0.0101 1.1324 -2.1860 2.8087 0.794 Random effects ub -0.0410 1.1621 -2.2390 2.8416 0.785 Paulo et al. (2002) -0.5927 1.5187 -2.8931 2.8028 0.700 Sánchez-González et al. (2007) 0.0307 1.0939 -2.1879 2.5433 0.806
iF
or
es
t
–
B
io
ge
os
ci
en
ce
s
an
d
Fo
re
st
ry
Mr =∑
i=1 n ri n Ef =1−∑
i=1 n ri2∑
i =1 n (yi−¯y) 2 Mar =∑
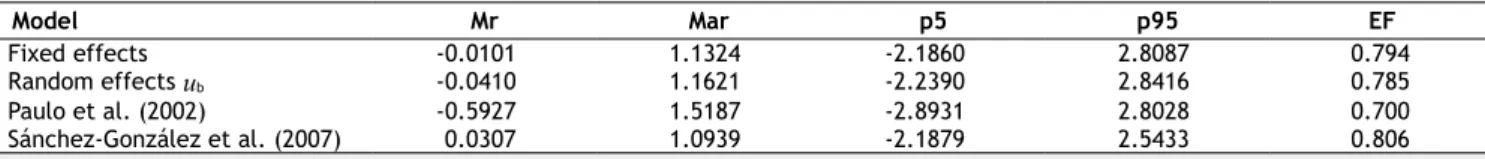
i=1 n |ri| nFig. 3 - Crown diameter predictions
using the validation data set. (a) The model by Paulo et al. (2002) vs. the model by Sánchez-González et al. (2007); (b) the fixed vs. the random effects models developed in this study; (c) the model by Sánchez-González et al. (2007) vs. the fixed effects model developed in this study; (d) the model by Sánchez-González et al. (2007) vs. the random effect model developed in this study.
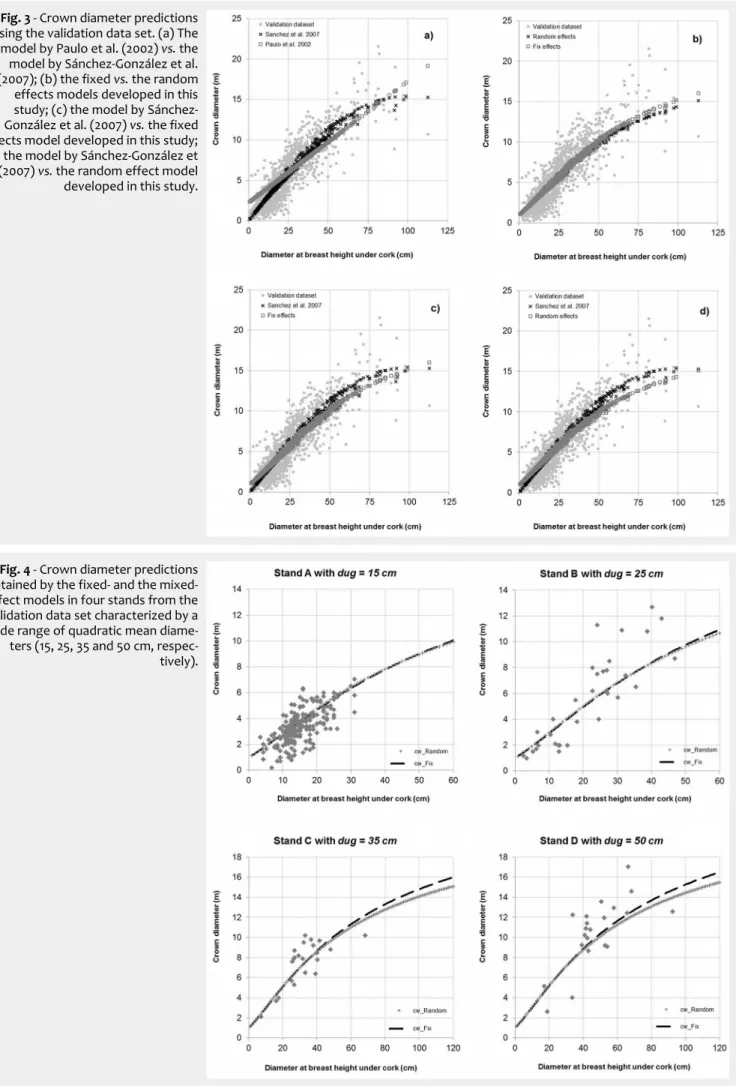
Fig. 4 - Crown diameter predictions
obtained by the fixed- and the mixed-effect models in four stands from the validation data set characterized by a wide range of quadratic mean diame-ters (15, 25, 35 and 50 cm, respec-tively).
iF
or
es
t
–
B
io
ge
os
ci
en
ce
s
an
d
Fo
re
st
ry
Paulo et al. (2002) showed the worst per-formances due to its linear formulation. Therefore, the fixed-effect model was se-lected for the analysis of cork oak stands stocking evolution.
The results of the validation step carried out for the models considered in this analy-sis are displayed in Fig. 3, where pairwise comparisons of their predicted values are shown: (a) the Paulo et al. (2002) model
versus the Sánchez-González et al. (2007)
model (Fig. 3a); (b) the fixed- versus the random-effects model developed in this study (Fig. 3b); (c) the Sánchez-González et al. (2007) versus the fixed effects model (Fig. 3c); and (d) the Sánchez-González et al. (2007) versus the random effect model proposed in this analysis (Fig. 3d).
The results of the application of the fixed-and rfixed-andom-effect models on four stfixed-ands from the validation data set are shown in Fig. 4. These stands were selected in order to better analyze the model performances over a wide range of quadratic mean dia-meters (15, 25, 35 and 50 cm, respectively).
Evolution of stand stocking values in
Portuguese cork oak
Average crown cover values of pure cork oak stands in Portugal were estimated to be 28.0% and 26.5% based on IFN4 and IFN5 data sets, respectively, resulting in a de-crease of the average value by 1.5% in the period 1996-2006. Such difference was sta-tistically significant after the application of the t-test (p<0.05). In addition, stands we-re grouped in 10% range classes of crown cover percentage, and for each class the difference in frequency between the IFN4 and the IFN5 was calculated (Fig. 5). The
differences between IFN4 and IFN5 ranged from 0.4-0.5% for high crown cover classes (> 40%) up to 4-5% for lower crown cover classes (10-40%).
Discussion
Crown diameter modeling
Although an asymptotic trend is expec-ted in the relationship between diameter at breast height and tree crown diameter, several authors observed a linear relation between the two mentioned variables (Ha-senauer et al. 1997, Condes & Sterba 2005, Sánchez-González et al. 2007, Paulo & To-mé 2009). This was also the case in this study, where a large range of values of tree diameter at breast height and crown dia-meter were analyzed (dbh up to 128.9 cm and cw up to 21.5 m). The underlying rea-son seems related to the size of trees included in the available data sets, that were far from their potential maximum growth. For example, Goes (1984) found monumental cork oak trees with dbh of 200 cm and more than 30 m crown radius, while Sánchez-González et al. (2007) re-ported a largest tree with dbh of 124.80 cm and a crown diameter of 17.45 m. This sup-port the hypothesis that the linear relation-ship between dbh and tree crown diameter observed in this study is due to the lack of old-growth, large trees in the available data sets.
Linear relationships are not considered suitable for the development of crown dia-meter models as they do not provide bio-logical meaning for parameter values or predicted values (Burkhart & Tomé 2012). This is particularly important when models
are applied to a large range of tree and stand values. In this study, model selection has been carried out by restricting the choice to models with formulations that can provide adequate behavior to this pur-pose.
Another important issue concerning tree variable modeling is related with the nes-ted structure of the data (trees within plots). Taking this structure into account, a mixed model approach was used including random parameters at plot level. This ap-proach is commonly used in different sec-tors of forest research, e.g., modeling tree variable relation (Adame et al. 2008, Cala-ma & Montero 2004, Paulo et al. 2011, Pau-lo & Tomé 2010a). Although the use of mi-xed models is suitable for the analysis of the data sets considered in this study, the computation of subject-specific responses is possible only when the predicted varia-ble is measured in some individuals of the sample (trees inside plots). When these data are not available (as in our case), the calibration process is not carried out, the random effects are assumed to be zero, and a population average response can only be obtained. In nonlinear models, such as those applied for modeling tree crown diameter, population response esti-mates are not equal to estiesti-mates obtained with fixed effect models. This was demon-strated by Meng et al. (2009), who showed that when the calibration process is not accomplished, the fixed effect models re-sult in lower prediction errors than the po-pulation response estimates. Similar results were obtained by De-Miguel et al. (2013). However, in order to enable the computa-tion of the best prediccomputa-tions, results should include also the mixed-effect model para-meters and the variance estimates when model calibration is possible (De-Miguel et al. 2013).
In this study, a distance-dependent com-petition index (the ratio between the tree diameter and the quadratic mean diame-ter) was included in the formulation of the model. Such index is related to the hierar-chical position of each tree within the stand (Burkhart & Tomé 2012). Similarly, Paulo & Tomé (2009) and Sánchez-Gonzá-lez et al. (2007) also found the quadratic mean diameter to be the most significant stand variable in their models.
Model comparisons carried out in this stu-dy revealed that the predictive performan-ces of the developed fixed-effect model were similar to those obtained using the model by Sánchez-González et al. (2007). However, the absence of an asymptote va-lue and the interception of the model ma-de at when y=0, do not ensure a biological meaning to model predictions. The estima-ted value for the asymptote was 28.5 m for the fixed-effects model and 25.1 m for the random-effects model. The former value seems more suitable for the cork oak species, as compared with values obtained on monumental trees in Portugal (Goes 1984), while the latter has to be considered
Fig. 5 - Frequency of classes of stand crown cover predicted by the fixed effect model
using data from two different forest inventories (IFN4 - DGF 2001; IFN5 - AFN 2010). The differences (in percentage) of predicted values for INF5 as compared with IFN4 are reported in brackets.
iF
or
es
t
–
B
io
ge
os
ci
en
ce
s
an
d
Fo
re
st
ry
too low. Furthermore, the model intercep-tion (corresponding to the tree crown va-lue when total height reaches 1.3 m) was 1.00 m for the fixed effects model and 0.97 m for the random effects model. Both va-lues are considered suitable for the species analyzed.
Evolution of stand stocking values for
Portuguese cork oak stands
Crown cover percentage is traditionally one of the most important variables for the management of cork oak stands both in typical silvopastoral areas and in forest stands. Values recommended for manage-ment of these stands (Natividade 1950, Montero & Cañellas 2003, Serrada et al. 2008) are remarkably higher than the ave-rage value of 26.6% that currently charterizes Portuguese stands of cork oak, ac-cording to AFN (2010). Based on the esti-mates obtained using the proposed model, an increase in frequency of lower crown cover classes (< 20%) and a decrease in fre-quency of higher crown cover classes (20% to 40%) was observed for cork oak stands in Portugal between 1996 and 2006. Since the area covered by cork oak stands in Por-tugal has not changed in the same period based on the available data (DGF 2001, AFN 2010, ICNF 2013), two main causes may be hypothesized to explain the aforementio-ned reduction in crown cover percentage, namely, an increase of the area of new cork oak plantations and a decrease of the stocking in adult stands.
The low stocking of adult stands may lead to a decrease in the potential value of cork production, an increase of landscape frag-mentation (Costa et al. 2014), and a decrea-se in tree regeneration of stands (Caldeira et al. 2014). In the long term, if the current trend will last, a large area of cork oak stands might be compromised in terms of sustainability of cork production. These results call for the definition of supporting measures for the protection of stands and for the increase of stand density by natural or artificial tree regeneration, both in pure forest and silvopastoral areas.
Conclusion
Forest inventories provide important data sets for stands characterization. How-ever, tree crown diameter is frequently not measured in forest inventories, since it is time-consuming and cost expensive. Ge-neralized crown diameter models allow to predict and evaluate crown cover, a rele-vant stand variable for cork oak stands management.
In this study, two generalized crown dia-meter models were developed, including a competition index that takes into account the effect of the position of trees in the stand structure on their crown diameter. Model evaluation, model characteristics and parameter estimation values high-lighted that the fixed-effect model should be used when measurements of crown diameter are not available for the
calibra-tion procedure, while the mixed-effect mo-del should be chosen when momo-del calibra-tion is feasible.
The fixed effects model was applied to data from the two last Portuguese forest inventory data in order to assess changes of crown cover values in the period 1996-2006. Results showed a decrease in crown cover values of Portuguese cork oak stands, increasing the frequency of stands with less than 20% crown cover and decreasing the frequency of stands with 20% to 40% crown cover percentage. Ave-rage crown cover also decreased from 28.0% to 26.5% in the same period. These results highlight the constraints that may affect the sustainability of cork production in some stands in Portugal.
Acknowledgements
This research was supported by the pro-jects “StarTree” (Grant agreement 311919) and “AgForward” (Grant agreement 6135 20) financed by the European Commission under the 7th Framework Program for Re-search and Technological Development, and by the Fundação para a Ciência e
Tec-nologia (Portugal) under project “Cork
car-bon footprint: from trees to products” (PTDC/AGR-FOR/4360/2012).
Joana A. Paulo carried out this work under the contract SFRH/BPD/96475/2013, and Sónia P Faias under the contract PD/ BD/52695/2014, both financed by the
Fun-dação para a Ciência e Tecnologia
(Portu-gal).
The authors acknowledge the Instituto
para a Conservação da Natureza e das Flo-restas (ICNF, formerly AFN) for allowing
the use of data from two National Forest Inventories. Authors also acknowledge Dr. Dean Meason for English and manuscript revision.
References
Adame P, Río M, Cañellas I (2008). A mixed non-linear height-diameter model for Pyrenean oak (Quercus pyrenaica Willd). Forest Ecology and
Management 256: 88-98. - doi: 10.1016/j.foreco.
2008.04.006
AFN (2010). Inventário Florestal Nacional. Portu-gal Continental [National Forest Inventory. Continental Portugal]. IFN 5: 2005-2006. Autori-dade Florestal Nacional, Lisboa, Portugal, pp. 209. [in Portuguese]
Burkhart HE, Tomé M (2012). Modelling forest trees and stands. Springer, New York, USA, pp. 457.
Calama R, Montero G (2004). Interregional non-linear height-diameter model with random coefficients for stone pine in Spain. Canadian Journal of Forest Research 34: 150-163. - doi:
10.1139/x03-199
Caldeira MC, Ibáñez I, Nogueira C, Bugalho MN, Lecomte X, Moreira A, Pereira JS (2014). Direct and indirect effects of tree canopy facilitation in the recruitment of Mediterranean oaks. Jour-nal of Applied Ecology 51 (2): 349-358. - doi:
10.1111/1365-2664.12189
Coelho MB, Paulo JA, Palma JHN, Tomé M (2012). Contribution of cork oak plantations
installed after 1990 in Portugal to the Kyoto commitments and to the landowners economy. Forest Policy and Economics 17: 59-68. - doi:
10.1016/j.forpol.2011.10.005
Costa A, Madeira M, Santos JL, Plieninger T, Seixas J (2014). Fragmentation patterns of evergreen oak woodlands in Southwestern Iberia: identifying key spatial indicators. Journal of Environmental Management 133: 18-26. - doi:
10.1016/j.jenvman.2013.11.026
Condes S, Sterba H (2005). Derivation of com-patible crown width equations for some impor-tant tree species of Spain. Forest Ecology and
Management 217 (2-3): 203-218. - doi: 10.1016/j.
foreco.2005.06.002
De-Miguel S, Guzmán G, Pukkala T (2013). A com-parison of fixed- and mixed-affects modelling in tree growth and yield prediction of an indige-nous neotropical species (Centrolobium tomen-tosum) in a plantation system. Forest Ecology
and Management 291: 249-258. - doi: 10.1016/j.
foreco.2012.11.026
DGF (2001). Inventário Florestal Nacional (3ª Revisão) [National Forest Inventory (3rd
revi-sion)] 1995-1998. Direcção General das Flores-tas, Lisboa, Portugal, pp. 233. [In Portuguese]. Fang Z, Bailey RL (2001). Nonlinear mixed effects
modelling for slash pine dominant height growth following intensive silvicultural treat-ments. Forest Science 47: 287-300.
Gill SJ, Biging GS, Murphy EC (2000). Modelling conifer tree crown radius and estimating cano-py cover. Forest Ecology and Management 126:
405-416. - doi: 10.1016/S0378-1127(99)00113-9
Goes E (1984). Árvores Monumentais de Portu-gal [Portuguese Monumental Trees]. Publica-ção da Portucel, Lisboa, Portugal, pp. 152. [in Portuguese]
Hasenauer H, Burkhart HE, Amateis RL (1997). Basal area development in thinned and un-thinned loblolly pine plantations. Canadian Journal of Forest Research 27 (2): 265-271. - doi:
10.1139/x96-163
Huang S, Price D, Titus S (2000). Development of ecoregion-based height-diameter models for white spruce in boreal forests. Forest Ecology and Management 129 (1-3): 125-141. - doi:
10.1016/S0378-1127(99)00151-6
ICNF (2013). IFN6 - Áreas dos usos do solo e das espécies florestais de Portugal continental. Resultados preliminares [IFN6 - Land use and forest species areas in continental Portugal. Preliminary results]. Instituto da Conservação da Natureza e das Florestas, Lisboa, Portugal, pp. 34. [in Portuguese] [online] URL: http:// www.icnf.pt/portal/florestas/ifn/resource/fichei ros/ifn/ifn6-res-prelimv1-1
Lei Y, Parresol BR (2001). Remarks on height-diameter modelling. Research Note SRS-10, Southern Research Station, USDA Forest Ser-vice, Asheville, NC, USA, pp. 8.
Meng SX, Huang S, Yang Y (2009). Evaluation of population-averaged and subject-specific ap-proaches for modelling the dominant or codo-minant height of lodgepole pine trees. Canadian Journal of Forest Research 39: 11481158.
-doi: 10.1139/X09-039
Meng SX, Huang S (2009). Improved calibration of nonlinear mixed effects models demon-strated on a height growth function. Forest Sci-ence 55 (3): 238-247. [online] URL: http://
iF
or
es
t
–
B
io
ge
os
ci
en
ce
s
an
d
Fo
re
st
ry
www.ingentaconnect.com/content/saf/fs/2009 /00000055/00000003/art00006
Montero G, Cañellas I (2003). El alcornoque. Manual de reforestación y cultivo [Cork oak forests. Reforestation and growing manual] (2nd edn). INIA, Ediciones Mundi Prensa,
Ma-drid, Spain. pp. 103.
Natividade JV (1950). Subericultura [Subericul-ture]. Direcção Geral dos Serviços Florestais e Aquícolas, Lisbon, Portugal, pp. 387. [in Por-tuguese]
Paulo MJ, Stein A, Tomé M (2002). A spatial sta-tistical analysis of cork oak competition in two Portuguese silvopastoral systems. Canadian Journal of Forest Research 32 (11): 18931903.
-doi: 10.1139/X02-107
Paulo JA, Tomé M (2009). An individual tree growth model for juvenile cork oak stands in southern Portugal. Silva Lusitana 17 (1): 27-38.
[online] URL: http://hdl.handle.net/10400.5/14
49
Paulo JA, Tomé M (2010a). Predicting mature cork biomass with t years of growth from one measurement taken at any other age. Forest Ecology and Management 259: 1993-2005. - doi:
10.1016/j.foreco.2010.02.010
Paulo JA, Tomé M (2010b). Optimization of cork debarking rotation for sites of different cork productivity and quality. In: Proceedings of the “XXIII IUFRO World Congress: Forests for the Future - Sustaining Society and the Environ-ment” (Parrota JA, Carr MA eds). Seoul (Republic of Korea) 23-28 Aug 2010. Interna-tional Forestry Review 12 (5): 40.
Paulo JA (2011). Desenvolvimento de um sistema
para apoio à gestão sustentável de montados de sobro [Development of a growth and yield model for the sustainable management of cork oak stands]. PhD thesis, Instituto Superior de Agronomia, Universidade Técnica de Lisboa,
Lisboa, Portugal, pp. 188. [online] URL: http://
hdl.handle.net/10400.5/3850
Paulo JA, Tomé J, Tomé M (2011). Nonlinear fixed and random generalized height-diameter mo-dels for Portuguese cork oak stands. Annals of
Forest Science 68 (2): 295-309. - doi: 10.1007/s13
595-011-0041-y
Paulo JA, Tomé M (2014). Estimativa das pro-duções de cortiça virgem resultantes de des-bastes em montados de sobro em fase juvenil [Estimates of virgin cork production resulting from thinning in juvenile cork oak stands]. Silva lusitana 22 (1): 29-42. [in Portuguese] [online]
URL: http://www.scielo.gpeari.mctes.pt/pdf/slu
/v22n1/v22n1a02.pdf
Paulo JA, Faias S, Gomes AA, Palma J, Tomé J, Tomé M (2015). Predicting site index from cli-mate and soil variables for cork oak (Quercus suber L.) stands in Portugal. New Forests 46
(2): 293-307. - doi: 10.1007/s11056-014-9462-4
Pinheiro JC, Bates DM (2000). Mixed-effects models in S and S-Plus. Statistics and compu-ting series, Springer, New York, USA, pp. 528. Requardt A, Schuck A, Köhl M (2009). Means of
combating forest dieback – EU support for maintaining forest health and vitality. iForest 2:
38-42. - doi: 10.3832/ifor0480-002
Sánchez-González M, Cañellas I, González GM (2007). Generalized height-diameter and crown diameter prediction models for cork oak
forests in Spain. Forest Systems 16 (1): 76-88.
[online] URL: http://revistas.inia.es/index.php/
fs/article/view/999
SAS Institute (2011a). Introduction to regression procedures. SAS/STAT 9.3 User’s Guide, SAS Institute Inc, Cary, NC, USA, pp. 50.
SAS Institute (2011b). The NLMIXED Procedure. SAS/STAT 9.3 User’s Guide, SAS Institute Inc, Cary, NC, USA, pp. 106.
Serrada R, Montero G, Reque JA (2008). Com-pendio de la selvicultura aplicada en España. [Catalogue of applied forestry in Spain]. INIA, Madrid, Spain, pp. 1178.
Sousa E, Santos MN, Varela C, Henriques J (2007). Perda de vigor dos montados de sobro e azinho: Análise da situação e perspectivas [Loss of vigour in cork oak and holm oak stands: analysis of current situation and future perspectives]. Estação Florestal Nacional, Lis-boa, Portugal, pp. 79. [in Portuguese] [online]
URL: http://www.iniav.pt/fotos/gca/livro_causa
s_doc_sintese_1369127896.pdf
Thorpe HC, Astrup R, Trowbridge A, Coates KD (2010). Competition and tree crowns: a neigh-borhood analysis of three boreal tree species. Forest Ecology and Management 259 (8):
1586-1596. - doi: 10.1016/j.foreco.2010.01.035
Supplementary Material
Appendix 1
Tab. S1 – List of the candidate models
ana-lyzed in this study.
Link: [email protected]