CLASSIFIED DOCUMENT. USE ONLY FOR EVALUATION PURPOSES
A study on methane and carbon dioxide
adsorption
A Master’s dissertation
ofDaniela Goreti Batista Morence
Developed within the course of dissertation
held in
SINTEF
Supervisor at FEUP: Prof. José Miguel Loureiro Supervisor at Sintef: Dr. Carlos A. Grande
Departamento de Engenharia Química
ii
Acknowledgments
First, I would like to thank my supervisor, Dr. Carlos Grande, for giving me the opportunity to work at SINTEF and to be a part of this project. I would also like to thank my supervisor, Prof. José Miguel Loureiro for the constant support even at a long distance.
I would also like to add a thank you for Eng. Kari Anne Andreassen for the constant help in the laboratory and all the guidance provided. It was an honour to work with you in SINTEF.
To my amazing fellow interns, Arthur, Bogusław, Diane, Floriane, Joris, Julia, Kevin, Léa, Marta, Nina and Soukaina, I am so thankful for having you joining me on this journey and to never making me feel alone on the course of these months. At times of enormous stress, I could always count on you to make me smile and to feel like I was at home. I will never forget all the little moments and jokes we shared. Thank you.
To my parents for allowing me to continue to follow my dreams and to support my decisions and to never letting me doubt my abilities, even if it means being away from them. I will never be able to thank you enough.
Even at such a long distance, friends in Portugal kept showing their support and companionship when living abroad was feeling overwhelming. So, I would like to show my appreciation here. To Rafaela, Teresa, Sara and Pedro, a huge thank you for visiting me and for being amazing guests, as well as for all the conversations and to help me take my mind of work. To Helena Miranda for all the companionship not only during the time of this thesis but all the months that preceded it and for helping me to be brave enough to go abroad (also for making sure this thesis is delivered on time). My best friends, Carolina and José, thank you for always being there for me, nothing else I can say.
This work was funded by the Innovation Fund Denmark (IFD) under File No. 5157-00008B, HiGradeGas (www.higradegas.eu).
Professor José Miguel Loureiro, supervisor of this work, is member of the Associate Laboratory LSRE-LCM - UID/EQU/50020/2019 - funded by national funds through FCT/MCTES (PIDDAC).
iv
Abstract
With the rise of global energy demand, the future relies on renewable energy sources. However, the global electric generation growth of these sources is not yet sufficient to meet the demand. Biogas is a renewable energy resource obtained from waste. In order to use it as a substitute for natural gas, an upgrading process must be made. Pressure Swing Adsorption (PSA) is one of the technologies available to perform this. An adsorbent must be chosen to remove water vapour and carbon dioxide from the raw biogas.
The purpose of this work is to study the adsorption of water vapour, carbon dioxide and methane using silica gel as an adsorbent. The measurement of carbon dioxide and methane adsorption isotherms on two different types of silica gel (narrow pore and wide pore) was performed at (283, 298 and 313) K up to 20 and 50 bar, respectively. To determine the adsorption capacity of water vapour, adsorption breakthrough curves were measured at two temperatures: (298 and 313) K and three different flow rates: (230.3, 342.3 and 566.6) ml.min-1 on a nitrogen atmosphere, as well as the desorption curves at the same operating conditions.
The isotherms measured for carbon dioxide and methane were fitted to a Virial isotherm model. The isosteric heat of adsorption obtained was 15266 J.mol-1 for methane and 28303 J.mol -1 for carbon dioxide on narrow pore silica gel. On wide pore silica gel, the value obtained was 11692 J.mol-1 for methane and 20776 J.mol-1 for carbon dioxide.
The analysis of the water vapour breakthrough curves showed inconsistent results. The adsorption capacity obtained for narrow pore silica gel ranged from (17.65-17.72) mol H2O.(kg)-1 of silica gel at 298 K and (8.49-9.80) mol H2O.(kg)-1 of silica gel at 313 K. In the case of wide pore silica gel, the adsorption capacity was found to be in the range of (3.88-7.51) mol H2O.(kg)-1 of silica gel at 298 K and (1.44-2.48) mol H2O.(kg)-1 of silica gel.
Wide
vi
Resumo
Com o aumento do consumo de energia global, o futuro depende do investimento em fontes de energia renováveis. No entanto, o crescimento da produção global elétrica destas fontes ainda não é suficiente para responder ao consumo. O biogás é uma fonte de energia renovável obtida a partir de resíduos. De forma a utilizá-lo como um substituto de gás natural é necessário realizar um processo de upgrading. O Pressure Swing Adsorption (PSA) é uma das tecnologias disponíveis para realizar este processo. Um adsorvente deve ser escolhido de forma a remover o vapor de água e o dióxido de carbono do biogás.
O objetivo deste trabalho é o estudo da adsorção de vapor de água, dióxido de carbono e metano, utilizando sílica gel como adsorvente. Foi realizada a medição das isotérmicas de dióxido de carbono e metano em dois tipos de sílica gel (narrow pore e wide pore) a (283, 298 e 313) K para pressões até 20 e 50 bar, respetivamente. De forma a determinar a capacidade de adsorção de vapor de água, foram medidas curvas de rutura a (298 e 313) K e a três caudais distintos: (230,3; 342,3 e 566,6) ml.min-1, na presença de uma atmosfera de nitrogénio. As curvas de desorção foram também medidas para as mesmas condições operacionais.
As isotérmicas medidas para dióxido de carbono e metano foram ajustadas a um modelo de Virial. O calor isostérico de adsorção medido tem o valor de 15266 J.mol-1 para metano e 28303 J.mol-1 em sílica gel de narrow pore. Para wide pore sílica gel, o valor obtido foi de 11692 J.mol -1 para metano e 20776 J.mol-1 para dióxido de carbono.
A análise das curvas de rutura de vapor de água demonstrou inconsistências nos resultados. A capacidade de adsorção obtida para narrow pore sílica gel variou de (17,65-17,72) mol H2O.(kg) -1 de sílica gel a 298 K e (8,49-9,80) mol H
2O.(kg)-1 de sílica gel a 313 K. No caso de wide pore sílica gel, a capacidade de adsorção obtida foi de (3,88-7,51) mol H2O.(kg)-1 de sílica gel a 298 K e (1,44-2,48) mol H2O.(kg)-1 de sílica gel.
viii
Declaration
I hereby declare, on my word of honour, that this work is original and that all non-original contributions were properly referenced with source identification.
Daniela Goreti Batista Morence
x
Index
Acknowledgments ... ii Abstract ... iv Resumo...vii Index ... xList of Figures ...xii
List of Tables ... xiv
Notation and Glossary ... xv
1. Introduction ... 1
1.1. Framing and presentation of the work ... 1
1.2. Contributions of the Work ... 2
1.3. Organization of the thesis ... 3
2. Context and State of the Art ... 4
2.1. Biogas ... 4
Biogas production in Europe and Portugal ... 5
2.2. Biogas upgrading ... 6
Pressure Swing Adsorption ... 7
2.3. Adsorption ... 7
Henry’s Law ... 7
Isotherm types ... 8
2.4. Adsorption isotherms on silica gel ... 9
Silica gel ... 9
Methane and Carbon Dioxide adsorption isotherms on silica gel ... 9
Water adsorption on silica gel... 12
3. Materials and Methods... 13
3.1. Measurement of isotherms ... 13
xi
4. Results and discussion ... 14
4.1. Pure component isotherms of CO2 and CH4 on silica gel ... 14
4.2. Water breakthroughs on silica gel ... 18
Narrow pore silica gel ... 18
Wide pore silica gel ... 20
Comparison of breakthrough curves in different silica gel samples ... 22
5. Conclusions ... 24
6. Assessment of the work done ... 25
6.1. Objectives achieved ... 25
6.2. Limitations and future work ... 25
6.3. Final Assessment ... 25
References ... 26
Appendix 1. Mercury porosimetry of narrow pore silica gel ... 30
xii
List of Figures
Figure 1. The four main phases of biogas formation. [4] ... 4 Figure 2. Development of the number of biogas plants in Europe. Source: European Biogas Association (EBA), 2018 ... 5 Figure 3. Classification of isotherms according to Brunauer, Emmet and Teller. [19] ... 8 Figure 4. Adsorption isotherms of CO2 (a) and CH4 (b) on silica gel measured by Shen et al. (2018) [35] ... 11 Figure 5. Adsorption equilibrium isotherm of CH4 on narrow pore silica gel (top) and wide pore silica gel (bottom) at (283,298 and 313) K. Circles represent experimental points and solid lines are the fitting of the Virial model. ... 15 Figure 6. Adsorption equilibrium isotherm of CO2 on narrow pore silica gel (top) and wide pore silica gel (bottom) at (283,298 and 313) K. Circles represent experimental points and solid lines are the fitting of the Virial model. ... 16 Figure 7. Breakthrough curves of water vapour in a packed column with narrow pore silica gel at 298 K at different flow rates of N2: 230.3 ml.min-1 (RNSG_1), 342.3 ml.min-1 (RNSG_2) and 566.6 ml.min-1 (RNSG_3) at RH=0.941. ... 18 Figure 8. Breakthrough curves of water vapour in a packed column with narrow pore silica gel at 313 K at different flow rates of N2: 230.3 ml.min-1 (RNSG_4), 342.3 ml.min-1 (RNSG_5) and 566.6 ml.min-1 (RNSG_6) at RH=0.941. ... 19 Figure 9. Desorption curves of water vapour in a packed column with narrow pore silica gel at 298 K at different flow rates of N2: 230.3 ml.min-1 (RNSG_1), 342.3 ml.min-1 (RNSG_2) and 566.6 ml.min-1 (RNSG_3). ... 19 Figure 10. Desorption curves of water vapour in a packed column with narrow pore silica gel at 313 K at different flow rates of N2: 230.3 ml.min-1 (RNSG_4), 342.3 ml.min-1 (RNSG_5) and 566.6 ml.min-1 (RNSG_6) at RH=0.941. ... 20 Figure 11. Breakthrough curve of water vapour in a packed column with wide pore silica gel at 298 K at different flow rates of N2: 230.3 ml.min-1 (RWSG_1), 342.3 ml.min-1 (RWSG_2) and 566.6 ml.min-1 (RWSG_3) at RH=0.941... 21 Figure 12. Breakthrough curve of water vapour in a packed column with wide pore silica gel at 313 K at different flow rates of N2: 230.3 ml.min-1 (RWSG_4), 342.3 ml.min-1 (RWSG_5) and 566.6 ml.min-1 (RWSG_6) at RH=0.941... 21 Figure 13. Desorption curve of water vapour in a packed column with wide pore silica gel at 298 K at different flow rates of N2: 230.3 ml.min-1 (RWSG_1), 342.3 ml.min-1 (RWSG_2) and 566.6 ml.min-1 (RWSG_3) at RH=0.941. ... 22
xiii
Figure 14. Desorption curve of water vapour in a packed column with wide pore silica gel at 313 K at different flow rates of N2: 230.3 ml.min-1 (RWSG_7), 342.3 ml.min-1 (RWSG_5) and 566.6 ml.min-1 (RWSG_6) at RH=0.941. ... 22
xiv
List of Tables
Table 1. Parameters of used adsorbents. ... 13 Table 2. Virial model parameters for CO2 and CH4 adsorption equilibrium on narrow pore silica gel. ... 17 Table 3. Virial model parameters for CO2 and CH4 adsorption equilibrium on narrow pore silica gel. ... 17 Table 4. Adsorption capacity and stoichiometric time for breakthrough curves of water on narrow pore silica gel. ... 23 Table 5. Adsorption capacity and stoichiometric time for breakthrough curves of water on wide pore silica gel. ... 23
xv
Notation and Glossary
A Virial coefficient kg.mol-1
A0 Virial coefficient kg.mol-1
A1 Virial coefficient kg.K.mol-1
b adsorption equilibrium constant Pa-1
B Virial coefficient kg2.mol-2
B0 Virial coefficient kg2.mol-2
B1 Virial coefficient kg2.K.mol-2
C concentration mol.kg-1
C0 initial gas phase concentration mol.kg-1
K Henry constant mol.kg-1.Pa-1
K0 adsorption constant at infinite temperature mol.kg-1.Pa-1
Ki equilibrium constant of component i Pa-1
K𝑖∞ equilibrium constant of component i at infinite temperature Pa-1
P pressure Pa
p partial pressure of adsorbate on the gaseous phase Pa
q absolute adsorbed phase concentration mol.kg-1
qads amount adsorbed phase concentration mol.kg-1
qexc excess amount adsorbed phase concentration mol.kg-1 𝑞s total number of sites per unit of adsorbent mol.kg-1
R universal gas constant J.mol-1K-1
T temperature K
𝑡st stoichiometric time s
Greek Letters
(−∆𝐻) isosteric heat of adsorption J.mol-1
(−∆H𝑖) isosteric heat of adsorption of component i J.mol-1
fractional coverage
𝜌ads density of the adsorbed phase kg.m-3
𝜌gas density of the gaseous phase kg.m-3
List of Acronyms
GHG Greenhouse Gas
PSA Pressure Swing Adsorption RH Relative Humidity
1
1. Introduction
1.1. Framing and presentation of the work
Global energy consumption continues to rise every year, following the economic growth tendency, as well as the higher heating and cooling needs all around the world. And, while renewable energies represented 45 % of the global electricity generation growth, it is still not sufficient to meet the demand. [1] In 2017, greenhouse gas, GHG, emissions peaked reaching a record value, being primarily sourced from CO2 emissions from fossil fuels and industry. [2] Therefore, it is of the utmost importance to reduce their impact.
With this in mind, the importance of finding better energy sources is undeniable. While solar, wind and hydropower are still the main sources of energy, biogas has the advantage of being produced from wastes and residues that can be locally obtained in contrast with traditional fossil fuels. Therefore, it creates value out of what would otherwise be disposable and reduces methane emissions.[3] It has been proven to be one of the most environmentally beneficial technologies available. [4] When upgraded to biomethane, biogas with high methane content, it also has the potential to replace natural gas.
Biogas has carbon dioxide, CO2, and methane, CH4, as its major components and is saturated with water vapour, H2O, at the outlet of the digester. It can also contain hydrogen sulphide, H2S, which must be removed to avoid corrosion and to fit quality requirements determined by its usage.
In order to inject it into the natural gas grid or to use as vehicle fuel, biogas has to be upgraded to biomethane. The cleaning steps are defined by its composition and source of biogas. Humidity must be removed to prevent further problems in the latter operation; the two major ways to do this are by compression, condensing the water during the cooling process afterwards, and adsorptive drying systems, using molecular sieves or silica gel, for example. Desulphurization must also be performed as stated before with techniques such as external biological reduction (separated absorption/oxygenation) with or without combination with basic scrubber, chemical precipitation using iron salts or iron hydroxide.
However, the most important step is the removal of CO2. There is a vast number of technologies to choose from to perform this task, divided into four major principles: adsorption, absorption, permeation and cryogenic upgrading. Absorption can be either physical or chemical, using inorganic or organic solvents. It is also possible to perform a combination of some of these techniques. One of the most efficient techniques is called Pressure Swing Adsorption, PSA, an adsorption based technology. In this process, the CO2 is retained on the surface of the solid acting
2
as an adsorbent while most of the CH4 passes through the column without being adsorbed. This procedure occurs at pressures from 1 to 10 bar and the final methane concentration is over 96%. [5] In order to design an adsorption process, it is required to study comprehensively the interaction between the adsorbent and the adsorbate(s).
Silica gel is a well-studied and a traditional adsorbent that adsorbs a large amount of water per weight of adsorbent, which is also an important component to extract from biogas in order to improve its quality. The adsorption of these three mentioned biogas components on silica gel was studied on this thesis with the purpose of using one single adsorbent in order to upgrade biogas efficiently.
The main goals of this thesis are to determine isotherms of CO2 and CH4 on two different types of silica gel at three different temperatures and to find the Virial parameters; measure water vapour breakthroughs on two types of silica gel at the same relative humidity, RH, at two different temperatures and various flow rates.
1.2. Contributions of the Work
In this work, the isotherms of carbon dioxide and methane in two different types of silica gel at 283, 298 and 313 K at pressures up to 20 and 50 bar, respectively, were measured in the conditions expected for the operation of a small PSA unit. Combined with the measurement of the breakthrough curves of water vapour on the same adsorbent at the same temperatures (except for 283 K), it is possible to have data to design an integrated system to not only separate CO2 from CH4, but also the water vapour to upgrade biogas to biomethane.
3
1.3. Organization of the thesis
This thesis is organized as follows:
1. Introduction: Brief presentation of the general subject matter of the thesis from biogas
to water vapour, carbon dioxide and methane adsorption in silica gel.
2. Context and State of the Art: On the first chapter of this thesis, the context and state
of the art define the most important concepts for the comprehension of this thesis, such as biogas and adsorption, as well as reviewing others work on the subject.
3. Materials and Methods: The installations for the measurements of the isotherms and
the breakthrough curves are defined, the adsorbents used and the process.
4. Results and discussion:
4.1. Pure component isotherms of CO2 and CH4 on silica gel: The pure components
isotherms for both types of silica gel at three different temperatures are presented and their respective Virial parameters.
4.2. Water breakthroughs on silica gel: The breakthrough curves are measured on different types of silica gel at two different temperatures at the same relative humidity and at distinct flow rates of nitrogen.
5. Conclusion: The major results of the thesis are analysed and presented.
6. Assessment of the work done: Review of the limitations found, as well as the final
4
2. Context and State of the Art
2.1. Biogas
Biogas is formed naturally from all sources of biomass under anaerobic conditions. The origin of the raw material can be from farms, including liquid manure, feed and harvest waste and energy crops, but also from private households and municipalities or industrial by-products. [5] Equation (2.1) defines the general formation of methane from biomass. [6]
C𝑐HℎO𝑜N𝑛S𝑠+ 𝑦H2O → 𝑥CH4+ 𝑛NH3+ 𝑠H2S + (𝑐 − 𝑥)CO2 (2.1)
Its formation can be divided in four main phases named hydrolysis, acidogenesis, acetogenesis and methanation, showed on figure 1. [4]
Figure 1. The four main phases of biogas formation. [4]
The energy content is determined by the amount of methane, CH4, in its composition that usually represents 50-75 %, being the major component followed by carbon dioxide, CO2, at a percentage of 25-50 %. Other constituents include water, H2O, oxygen, O2, sulphur, S2, and hydrogen sulphide, H2S. [5]
After a process of desulphurization, conversion to electricity and heat can be done at cogeneration units or it can be burned in order to generate heat. Other important function of biogas can be the replacement of carbon compounds in plastic products. However, an upgrade for
5
biomethane can be done achieving the same quality as natural gas and therefore can be used on the same applications. [5] This option is further discussed on section 2.2.
Biogas production in Europe and Portugal
The European biogas industry is sustained by the transformation of animal and vegetable by-products, household biowaste and energy crops into heat, electricity, biomethane and organic fertilizer. [7]
The number of biogas plants has been rising in Europe since 2010 (figure 2), even though at a lower rate in recent years, mostly due to a decrease in national support schemes investment, particularly in Germany and Italy, two of the most significant producers. At the end of 2017, 17 783 biogas plants and 540 biomethane plants were operating all across Europe reaching an electric capacity of 10 532 MW, an increase of 5% from the previous year. Biogas and biomethane production reached 65 179 GWh and 19 352 GWh, respectively. [8,9]
Figure 2. Development of the number of biogas plants in Europe. Source: European Biogas Association (EBA), 2018
A new agreement in the European Union (EU) established as of 2018 a goal of 14% renewable energy in the transport sector until 2030. This encapsulates a target of 3.5% for advanced biofuels and biogas on a new Renewable Energy Directive which shall be transposed to national law in every EU member state until 2021. Reported advantages of this include accessibility of biomethane to the natural gas grid and facilitate international trade of the gas. On the other hand, the Directive establishes minimum limits of 65-80% greenhouse savings when compared to fossil fuels, thus limiting production, even though biogas is still one of the most sustainable energy sources.[8]
6
In Portugal, contrary to the European tendency, there has been a decrease in the number of biogas production plants over the last 20 years, from 103 to 60 units, 6 without connection to the power grid [10]. Despite this decrease, the annual production has followed an opposite tendency from 2010 to 2015 reaching the maximum value of 294 GWh, and steadily decreased ever since. The projected value for 2019 is 258 GWh and 92 MW of installed power.[11]
Nonetheless, there is a case to be made for biomethane as a replacement of natural gas with an annual production potential of 805.1 MNm3, considering the national legislation already allows its injection on the natural gas grid if the quality and safety conditions can be provided. However, the projected cost for a biomethane facility remains uncompetitive with the more traditional natural gas. According to research done by LNEG (Laboratório Nacional de Energia e
Geologia) implementing herbaceous cultures as rotating crops with cereals production could
increase substantially biomethane production potential.[12].
Companies such as Dourogás continue to invest heavily in this sector, having announced that 5 new projects are to be developed in upcoming years [13]. Already producing 1.7 MNm3/year of biogas on a joined project with Empresa Geral do Fomento (EGF) to be injected on the natural gas grid.[14]
2.2.
Biogas upgrading
Biomethane rivals in quality with natural gas, when a composition of around 98% of methane is achieved [5]. To perform the upgrade from biogas, first a cleaning process is done to remove trace components followed by an upgrading process that adjusts calorific value and relative density with the removal of carbon dioxide to meet the required standards for its final use.
The advantages of the use of biomethane, include the local decoupling of production and utilization, storage capability, improved flexibility on its use, namely electricity, heat, vehicle fuel for natural gas vehicles and as a primary product for chemicals industry. [5]
The most traditional technology for upgrading is physical and chemical absorption, but adsorption can surpass it due to its reduced environmental impact and cost, as well as diminish the energy penalty. Other techniques include cryogenic separation and biological methane enrichment [15]. PSA uses a column filled with an adsorbent which is most commonly activated carbon, silica gel, alumina or zeolite which adsorb preferably CO2. [16].
7
Pressure Swing Adsorption
PSA operates based on either equilibrium or kinetic selectivity. In the first case, the most strongly adsorbed component is retained in the column, on the contrary of the least adsorbed ones that are contained in the effluent. If separation is based on kinetic selectivity, the slowly adsorbed species leave in the effluent at high pressure, while the fastest diffusing species gets retained by the adsorbent. Although the main focus is the removal of carbon dioxide, the PSA is able to separate also oxygen and nitrogen, so the selectivity is achieved with the alteration of mesh sizes or gas pressures or both of the techniques combined. The PSA unit is composed with several vessels operating on different steps, namely adsorption, depressurization, desorption and pressurization, each vessel is being pressurized with biogas and sequentially depressurized. In the adsorption step, the bed is loaded with raw biogas to selectively remove CO2 so it reaches saturation, until the breakthrough point is achieved and the process proceeds to the bed forward. When depressurization is reached the gas mixture rich in methane is recycled to the unit. The cycle is finalized with depressurization of the adsorbent bed, releasing the gas mixture rich in carbon dioxide [16].
2.3. Adsorption
Adsorption can be defined as the phenomenon in which there is a concentration of an adsorbate from a solution or its vapour phase in the proximity of the surface or pores of an adsorbent. The latter is a solid. This process is inherently exothermic considering there is a loss in entropy caused by the reduction of the freedom of motion of the molecules. The highest-energy sites in the adsorbent are taken first, decreasing the molar heat of adsorption with the increase of adsorption. [17] One of the models to explain this phenomenon at low concentrations is Henry’s Law.
Henry’s Law
For adsorption occurring due to London-Van der Waals forces of the solid and adsorbate, physical adsorption, at a concentration range where most molecules are isolated, the equilibrium between the adsorbed phase concentration and fluid phase is linear. [11,14] The linear correlation is called Henry’s Law and it is described in equation (2.2) in its pressure form, although it can also be expressed in terms of concentration, where 𝑞 represents moles per unit volume in the adsorbed phase and 𝑝 the partial pressure of adsorbate on the gaseous phase, while 𝐾 is the Henry constant.
8
The relation of the Henry constant with temperature can be described by equation (2.3) that originates from the van’t Hoff equation. [18]
𝐾 = 𝐾0𝑒 −∆𝐻
𝑅𝑇 (2.3)
When a temperature is fixed, the adsorbed quantity per unit mass of the solid, 𝑞, is a function of the partial pressure on the gaseous phase and that is the adsorption isotherm.
Isotherm types
The amount of vapour adsorbed by an adsorbent is influenced by temperature, equilibrium partial pressure of vapour, and the nature of the solid as well as the adsorbate. Brunauer (1945) categorized the isotherms into five types, I to V, visible in figure 3. In summary, type I is Langmuir-type adsorption, Langmuir-type II is a progressive adsorption from monolayer to multilayer, Langmuir-type III represents a weak gas-solid interaction. Finally, types IV and V indicate vapour adsorption by capillary condensation into small pores. [17,19,20]
The Langmuir model is the simplest theoretical model to describe monolayer adsorption. It is sustained on multiple assumptions: adsorption occurs at a fixed number of defined and energetically equivalent localized sites that can hold exactly one adsorbate molecule each, with no interaction between the adsorbed molecules. The rates of adsorption, 𝑟𝑎, and desorption, 𝑟𝑑, in equations (2.4) and (2.5), respectively.
𝑟𝑎 = 𝑘𝑎𝑝(1 − Θ) (2.4)
𝑟𝑑= 𝑘𝑑Θ (2.5)
9
At equilibrium, the rates of desorption and adsorption are matched and therefore it can be described by equation (2.6), in which 𝑞𝑠 represents the number of sites per unit weight/volume of adsorbent, Θ is the fractional coverage and 𝑏 is the adsorption equilibrium constant that follows a van’t Hoff equation in similarity to the Henry constant. [18]
Θ = 𝑞 𝑞𝑠
= 𝑏𝑝
1 + 𝑏𝑝 (2.6)
2.4. Adsorption isotherms on silica gel
Silica gel
Silica gel, SiO2•nH2O, is an amorphous and porous form of silica. This material does not allow separation of molecules exclusively by size in opposition to other adsorbent materials such as zeolites. [21] Typical sources include sodium silicate, colloidal silica and the hydrolysis of silicon compounds. [22]
All the terminal characteristics of the gel will be defined by physical and chemical conditions in every step of its preparation. The porosity properties are highly influenced by the pH of the medium when it is made from silicic acid. If the silica gel is obtained on an acid media then it will have narrow pores, average pore size of 20 Å, while in weakly alkaline media wide pore silica gel, average pore size of 110 Å, is obtained. Other important factor is the relation between the rates of polymerization and condensation. A specific surface area can also be achieved changing the production procedure. Usually, silica gels contain a mixture of Al2O3 and Fe2O3 that has a catalytic effect as well as an increased irreversible sorption. [21-23]
Molecules that are able to form hydrogen bonds with the hydroxyl groups present in silica gel or π-complexes are preferentially adsorbed in contrast to nonpolar molecules. Water isotherms for silica gel demonstrate an increase in loading with water vapour pressure due to the micropore size distribution, making it ideal for use as a desiccant at low temperatures and moderate vapour pressures. [18] The large internal surface area and pore volume are liberated on activation, considering that the structure is maintained after the process, physical adsorption and capillary condensation is made possible. [21]
Methane and Carbon Dioxide adsorption isotherms on silica gel
Lewis et al. (1950) obtained the pure gas isotherms for light hydrocarbons on silica gel and activated carbon at 25°C and atmospheric pressure, concluding that unsaturated hydrocarbons are more tightly adsorbed by silica gel [24]. Gonzalez and Holland also studied the adsorption equilibria of light hydrocarbon gases, including CO2 and CH4 on both activated carbon and silica
10
gel for temperatures ranging from 297 to 422 K and pressures below atmospheric until 6894 kPa [25].
Wang and Yu (2016) investigated methane adsorption on porous nano-silica in the presence of water. The isotherms measured for pure methane on dry nano-silica at temperatures 308.15 K and 318.15 K are type I according to the IUPAC classification. The greatest adsorption amounts are 2.49 mmol/g at 308.15 K and 1.83 mmol/g at 318.15 K. For the lowest temperature, the adsorption reaches a stable level from 8 MPa onwards while at 318.15 K the phenomenon is not registered. The experiments were performed using static volumetric method. [26]
A similar study was performed by Zhou et al (2017). In this experiment, Merck silica gel 60 was used. The methane gas purity was higher than 99.999%. The specific surface area was 316 m2/g based on the BET theory with a total pore volume of 0.73 cm3/g at the relative pressure of 0.99. The pore size distribution was also measured. For the dry sample of silica gel at 275 K and pressures up to 11 MPa, it was found an isotherm of type I, achieving the highest adsorption at 9.6 MPa and 2.82 wt%. [28]
The adsorption equilibrium in a methane-propane mixture on silica gel was studied by Haydel and Kobayashi (1967) in which were also obtained adsorption levels for pure methane for (0,10,20,30 and 40) ºC for pressures up to 6894 kPa, as well as the initial slope of the isotherms for (-40,-20,0,20 and 40) ºC. The initial slopes were obtained from retention volume of infinitely dilute samples of methane and propane using helium as carrier gas. From this, it was possible to calculate isosteric heats of adsorption. [29]
Malek and Farooq (1997) measured mass and heat transfer data for methane, ethane and propane adsorption in both activated carbon and silica gel beds using the dynamic-column breakthrough method. This method was chosen due to the significant amount of adsorbent used which enables more representative data to be obtained. Their research concluded that using single-component kinetic data and the extended Langmuir-Freundlich equilibrium isotherm provides positive prediction of experimental breakthrough profiles. The correspondence between experimental and theoretical results can be compromised when recurring to the extended Langmuir isotherm but it greatly accelerates the process. [30]
To evaluate the adsorption of CO2 on microporous materials, Berlier and Frère (1997) recurred to a completely automated device based on a volumetric method. In this experiment, it was used silica gel KC-Trockenperlen Blau. Adsorption isotherms were obtained for CO2 on silica gel at temperatures (278, 288, 298, 303, 308, 318, 328) K until a maximum pressure of 3300 kPa. Isotherms are type I with a constant increase in adsorption on the full range of pressure tested. [31]
11
Krishnamurthy et al. (2012) obtained isotherms of CO2 and N2 using Zeochem silica gel at temperatures (25, 50 and 75) ºC and pressures up to 2.8 bar with the RUBOTHERM magnetic suspension balance with data fitted to a Langmuir isotherm. [32]
Wang and LeVan (2010), measured the adsorption isotherms for carbon dioxide using a gravimetric apparatus and the results were described by a multitemperature Toth model, extracting 5 parameters. It was utilized a Grade 40 Grace Davidson silica gel and the isotherms were measured for (10, 25, 40 and 55) ºC until a maximum pressure of 100 kPa. [33]
Measurements were made by Olivier and Jadot (1997) for carbon dioxide using KC type silica gel for temperatures 293 K and 303 K up until 3500 kPa using an automated volumetric apparatus and for methane at temperatures (278, 293 and 303) K and the same pressure. The BET specific surface area was 750 m2/g. The adsorption capacity for carbon dioxide is significantly greater than for methane. [34]
On the study of removal and capture of CO2 from biogas using silica gel as an adsorbent elaborated by Shen et al. (2018), the adsorption isotherms for both carbon dioxide and methane were measured for temperatures ranging from 15ºC to 45ºC and from pressures 0 kPa to 500 kPa. The adsorption capacity of methane on silica gel is significantly higher than that of methane. The Langmuir model fitted experimental data significantly.[35]
Ferreira et al. (2011) measured effective adsorption equilibrium isotherms and breakthroughs of water vapour and carbon dioxide on different adsorbents, including silica gel. For carbon dioxide, isotherms for temperatures (15,35 and 55) ºC for pressures up to 1.20 bar were fitted to the multitemperature Langmuir isotherm model. At 35ºC the adsorption loading was found to be 0.203 mol.kg-1. [36]
Mhaskar and Moharir (2012), on the study of natural gas treatment using adsorptive
12
separation, studied the pure components isotherms of carbon dioxide at 303.15 K on silica gel until 3500 kPa. They also found the fitted Langmuir parameters on the same conditions of carbon dioxide and methane, as well as other natural gas typical components. [37]
Adsorption isotherms of CO2, CH4 and N2 were collected at 298 K by Liu et al. (2005) and it was concluded that for synthesized mesoporous silica SBA-15 it is possible to achieve separation of carbon dioxide from the mixture of methane and nitrogen both from the isotherms and the rate of adsorption. Silica SBA-15 had a pore size ranging from 5 to 9 nm with a specific surface area between 500-900 m2/g. [38]
Water adsorption on silica gel
At the digester outlet, the biogas is saturated in water. The major consequence of such a significant presence is the likelihood of water vapour condensation. Corrosion in the pipelines and other components of the installation can happen due to the formation of carbonic acid when water reacts with carbon dioxide. [39] Therefore, the extraction of this component is of the utmost importance for the achievability of a good quality product.
To extract water from the system performing an adsorption process is a good option. In order to complete the design of this process, one effective way to determine the characteristics of the adsorbent and adsorbate process is by analysing the breakthrough curves. These curves vary according to many diverse factors, such as bed geometry, operating conditions, transport properties and heat effects, as well as the adsorption isotherms. [40]
The adsorption thermodynamics of a silica gel-water system was studied by Chakraborty et
al. (2009) at temperatures ranging from (273-373) K at (0.5 and 10) kPa. The isotherms were
obtained for the Toth and Dubinin-Astakhov models, as well as the specific heat capacity and the isosteric heat of adsorption. [41]
Van del Bulck (1990) obtained a generalized correlation for regular density silica gel based on the Dubinin-Astakhov isotherm equation [42]. In other work by Li et al.(2010) the dynamics and water vapour sorption on mesoporous silica gels were studied when different salts were applied, this was found to increase average pore diameter, improving the hygroscopic abilities. [43]
13
3. Materials and Methods
3.1. Measurement of isotherms
Two adsorbent materials were used in this work: narrow pore silica gel (NSG 125) and wide pore silica gel (W 127), both kindly provided by Grace Davison.
The measurement of pure component isotherms can be done with three different methods, namely volumetric, gravimetric and dynamic [44]. In this work, the equipment used for the measurement of the isotherms was BELSORP-HP from MirotracBEL Corp. (Japan) using a manometric method. The experiments were executed at (283, 298, 313) K for the adsorbates CH4 (purity >99.9992%) until 50 bar and CO2 (purity >99.9995%) until 20 bar on silica gel. The samples were activated at 423 K for 10 hours under vacuum.
The mercury porosimetry analysis was performed on Instituto Pedro Nunes (IPN) in Coimbra and the results can be seen on Table 1 and on Appendix 1 and 2.
Table 1. Parameters of used adsorbents.
The Virial parameters on section 4.1 were determined by fitting the data using the fminsearch function on Scilab 6.0.2 software (www.scilab.org).
3.2. Measurement of breakthroughs
The adsorbent materials used were the same as stated on section 3.1.The samples were activated at 423 K overnight under a N2 atmosphere.
The measurements were performed by flushing a constant flow rate of N2 through a reactor filled with the sample at first through a bypass stream and then through a saturator. The outlet was connected to a mass spectrometer connected to a computer.
Type Narrow Pore Wide Pore
Mass (g) 1.951 1.2211 1.3132
Bulk density (g/ml) 1.364 0.8152
Porosity (%) 14.54 53.39
Structural density (g/ml) 2.482 2.323
1Mass for measurements of CO
14
4. Results and discussion
4.1. Pure component isotherms of CO
2and CH
4on silica gel
Based on the ideal gas equation and measurements of pressure, temperature and volume it is possible to calculate the amount of gas not present in the gas phase. Equations of state will allow corrections of measurements at high pressures for real gas.
The surface excess mass is directly measured from the equipment and while its value is identical to the absolute adsorbed amount at low pressures, the situation changes at higher pressures. For the analysis and application of adsorption measurements it is required to use absolute adsorbed amount values. [27,28] It was proved that those values are proportional and it was used equation (4.1). The density of the adsorbed phase, 𝜌ads, for CO2 and CH4 was 1277.78 and 422.53 kg.m-3, respectively, while the density of the gas phase, 𝜌
gas, was calculated by the
Benedict-Webb-Rubin equation. [29,30] 𝑞ads= 𝑞exc (1 −𝜌𝜌gas ads) (4.1)
A variety of correlation equations can be applied to the data. On the low pressure range, the Henry constant corresponds to the slope of the isotherm and is linked to the interaction of the molecules with the surface. By plotting ln(P/q) vs amount adsorbed, q, it is possible to recognize the quality of the data acquired. [26] Considering the finite Henry Law’s constant at the origin, the Virial equation of state can be applied to the experimental data (4.2). [31,32]
𝑃 = 𝑞 𝐾𝑖 exp (𝐴𝑞 + 𝐵𝑞2) (4.2) 𝐾𝑖 = 𝐾𝑖∞exp (− ∆𝐻𝑖 𝑅𝑇) (4.3) 𝐴 = 𝐴0+ 𝐴1 𝑇 (4.4) 𝐵 = 𝐵0+ 𝐵1 𝑇 (4.5)
15
On equation (4.3) is represented the calculation of Ki, the adsorption equilibrium constant, dependent on the heat of adsorption, -∆𝐻𝑖, and the adsorption constant at infinite temperature, 𝐾𝑖∞. The Virial coefficients A and B are related to temperature and can be obtained by equations
(4.4) and (4.5).
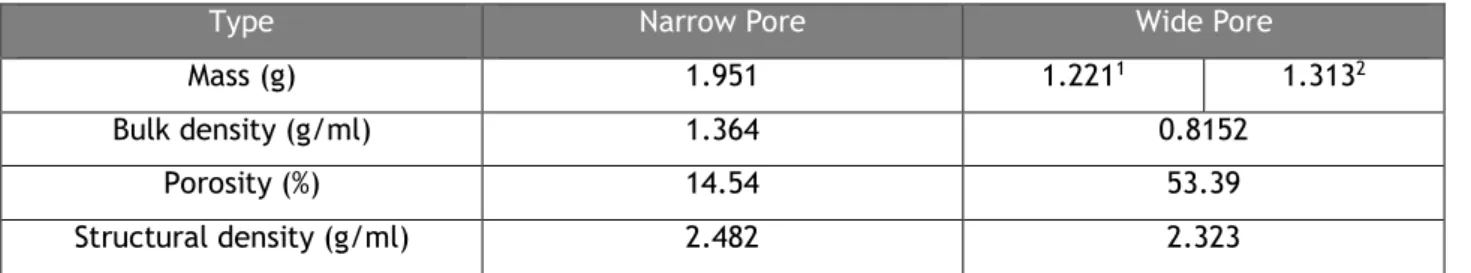
Figure 5. Adsorption equilibrium isotherm of CH4 on narrow pore silica gel (top) and wide pore silica gel (bottom) at
(283,298 and 313) K. Circles represent experimental points and solid lines are the fitting of the Virial model.
0.00 0.50 1.00 1.50 2.00 2.50 0 1000 2000 3000 4000 5000 6000 qad s (m o l/ kg) P (kPa) 283 K 298 K 313 K Virial 0.00 0.10 0.20 0.30 0.40 0.50 0.60 0.70 0.80 0.90 1.00 0 1000 2000 3000 4000 5000 6000 qad s (m o l/ kg) P (kPa) 283 K 298 K 313 K Virial
16 Figure 6. Adsorption equilibrium isotherm of CO2 on narrow pore silica gel (top) and wide pore silica gel (bottom) at
(283,298 and 313) K. Circles represent experimental points and solid lines are the fitting of the Virial model.
Adsorption equilibrium isotherms of CH4 and CO2 at three different temperatures (283, 298 and 313 K) are shown in figures 5 and 6, respectively. In those figures, the fitting of the Virial model to the experimental data is also shown. For both materials, it is clear that the amount adsorbed of carbon dioxide is much greater than that of methane.
0.00 1.00 2.00 3.00 4.00 5.00 6.00 7.00 0 500 1000 1500 2000 2500 qad s (m o l/ kg) P (kPa) 283 K 298 K 313 K Virial 0.00 0.50 1.00 1.50 2.00 2.50 0 500 1000 1500 2000 qad s (m o l/ kg) P (kPa) 283 K 298 K 313 K Virial
17 Table 2. Virial model parameters for CO2 and CH4 adsorption equilibrium on narrow pore silica gel.
Narrow Pore Silica Gel
Adsorbate Ki[1/kPa] ∆Hi [J/mol] A0 [kg/mol] A1[kg K/mol] B0 [kg/mol]2 B1[kg2K/mol2]
CH4 2.50 × 10⁻⁶ 15266 0.123 83.3 -2.64 × 10⁻² 9.12 × 10⁻³
CO2 2.00 × 10⁻⁷ 28303 -4.76 × 10⁻³ 159 -6.91 × 10⁻² 10.2
The Virial model parameters obtained are displayed on tables 2 and 3. The heat of adsorption obtained is comparable to the ones measured in literature by Shen et al. (2018), Malek and Farooq (1997) and Zhao et al.(2012). [16,17,22,33] The heat of adsorption obtained is significantly different for both samples, being greater for narrow pore silica gel for the two gases, meaning a stronger interaction between the adsorbent and the adsorbates.
Table 3. Virial model parameters for CO2 and CH4 adsorption equilibrium on wide pore silica gel.
Wide Pore Silica Gel
Adsorbate Ki[1/kPa] ∆Hi [J/mol] A0 [kg/mol] A1[kg K/mol] B0 [kg/mol]2 B1[kg2K/mol2]
CH4 2.20 × 10⁻⁶ 11692 3.04 -675 -3.73 × 10⁻² -1.40
18
4.2. Water breakthroughs on silica gel
Narrow pore silica gel
Water adsorption breakthroughs were measured at three different flow rates: (230.3, 342.3 and 566.6) ml.min-1, at two different temperatures on the oven at 298 K and 313 K while the water saturator was at room temperature. At lower temperatures, the water condensation in the system was a possibility, therefore it was not performed. The relative humidity, RH, was constant at 94.1 %.
Figure 7. Breakthrough curves of water vapour in a packed column with narrow pore silica gel at 298 K at different flow rates of N2: 230.3 ml.min-1 (RNSG_1), 342.3 ml.min-1 (RNSG_2) and 566.6 ml.min-1 (RNSG_3) at RH=0.941.
At 298 K, it was found that a second shock front is formed at all three flow rates on the approximation of the feed composition, indicated by an inflection point at approximately 405, 300 and 180 minutes for (230.3, 342.3 and 566.6) ml.min-1, respectively (figure 7). This pattern is consistent with what was observed by Park and Knaebel (1992) at 299 K for a high influent concentration. The concentration profile inside the column is expected to demonstrate a dual-shock wave, which remains as a constant pattern region in the effluent breakthrough curve. This behaviour was not observed for type II isotherms, therefore an inflection in the isotherm seems to be required. [40] 0.00 0.20 0.40 0.60 0.80 1.00 0 100 200 300 400 500 600 C /C0 t (min) RNSG_1 RNSG_2 RNSG_3
19
The unusual behaviour seen in the experiment with the highest gas flow rate, RNSG_3, when feed composition is approached can be caused by many factors; one likely cause is the inconstant ambient temperature through all the experiment, influencing the water saturator temperature as well.
At 313 K (figure 8), it is noticeable a shorter period before the onset of the breakthrough, due to the reduced capacity of the bed at higher temperature. [40] On the contrary of what was observed at 298 K, there is no inflection point.
Figure 8. Breakthrough curves of water vapour in a packed column with narrow pore silica gel at 313 K at different flow rates of N2: 230.3 ml.min-1 (RNSG_4), 342.3 ml.min-1 (RNSG_5) and 566.6 ml.min-1 (RNSG_6) at RH=0.941.
0.00 0.20 0.40 0.60 0.80 1.00 0 100 200 300 400 500 C /C0 t (min) RNSG_4 RNSG_5 RNSG_6
Figure 9. Desorption curves of water vapour in a packed column with narrow pore silica gel at 298 K at different flow rates of N2: 230.3 ml.min-1 (RNSG_1), 342.3 ml.min-1 (RNSG_2) and 566.6 ml.min-1 (RNSG_3).
0 0.2 0.4 0.6 0.8 1 0 200 400 600 800 C /C0 t (min) RNSG_1 RNSG_2 RNSG_3
20
On figure 9, the desorption curves of water vapour are presented for narrow pore silica gel at 298 K, and it is noticeable an anomaly on the experiment RNSG_3, probably caused by changes in flow rate in the system. The experiments should be repeated in order to obtain better results. However, the shape of all the curves remains similar and it is faster for higher flow rates. Similar behaviour is observed for the experiments made at 313 K (figure 10).
Wide pore silica gel
The same procedure was applied to wide pore silica gel and the results can be seen on figures 11 and 12. It can be observed that the different flow rates influence the beginning of the breakthrough as well as the temperature, as previously concluded. On figure 11, the adsorption shows a steep rise at first followed by a gradual increase. The breakthrough time is much lower for 313 K than for the lowest temperature.
0 0.2 0.4 0.6 0.8 1 0 100 200 300 400 500 600 C /C0 t (min) RNSG_4 RNSG_5 RNSG_6
Figure 10. Desorption curves of water vapour in a packed column with narrow pore silica gel at 313 K at different flow rates of N2: 230.3 ml.min-1 (RNSG_4), 342.3 ml.min-1 (RNSG_5) and 566.6 ml.min-1 (RNSG_6) at RH=0.941.
21
The desorption curves for wide pore silica gel at (298 and 313) K are shown in figures 13 and 14. At 298 K, it is visible, there is a disagreement on the type of curve for different flow rates. The experiments should be repeated to obtain better results. On figure 14, RWSG_7 is not the desorption curve of the breakthrough curve RWSG_4, although it was measured at the same experimental conditions. 0 0.2 0.4 0.6 0.8 1 0.00 50.00 100.00 150.00 200.00 250.00 C /C0 t (min) RWSG_1 RWSG_2 RWSG_3
Figure 11. Breakthrough curve of water vapour in a packed column with wide pore silica gel at 298 K at different flow rates of N2: 230.3 ml.min-1 (RWSG_1), 342.3 ml.min-1 (RWSG_2) and 566.6 ml.min-1 (RWSG_3) at RH=0.941.
0.00 0.20 0.40 0.60 0.80 1.00 0.00 20.00 40.00 60.00 80.00 C /C0 t (min) RWSG_4 RWSG_5 RWSG_6
Figure 12. Breakthrough curve of water vapour in a packed column with wide pore silica gel at 313 K at different flow rates of N2: 230.3 ml.min-1 (RWSG_4), 342.3 ml.min-1 (RWSG_5) and 566.6 ml.min-1 (RWSG_6) at RH=0.941.
22 Figure 14. Desorption curve of water vapour in a packed column with wide pore silica gel at 313 K at different flow rates of N2: 230.3 ml.min-1 (RWSG_7), 342.3 ml.min-1 (RWSG_5) and 566.6 ml.min-1 (RWSG_6) at RH=0.941.
Comparison of breakthrough curves in different silica gel samples
As seen on figures 7-14, the breakthrough time is significantly smaller for wide pore silica gel in comparison with narrow pore silica gel. It can be concluded that a higher average pore diameter improves the adsorption rate. Other observation is the asymmetry of the breakthrough curves with the corresponding desorption curves.
0 0.2 0.4 0.6 0.8 1 0 100 200 300 400 C /C0 t (min) RWSG_1 RWSG_2 RWSG_3
Figure 13. Desorption curve of water vapour in a packed column with wide pore silica gel at 298 K at different flow rates of N2: 230.3 ml.min-1 (RWSG_1), 342.3 ml.min-1 (RWSG_2) and 566.6 ml.min-1 (RWSG_3) at RH=0.941.
0 0.2 0.4 0.6 0.8 1 0 20 40 60 80 100 120 C /C0 t (min) RWSG_7* RWSG_5 RWSG_6
23
In order to compare the different breakthrough curves obtained, the stoichiometric time,
tst or first moment, can be calculated by equation (4.6
)
. The results are displayed on tables 4 and 5. tst = ∫ (1 − 𝐶 𝐶0 ) 𝑑𝑡 ∞ 0 (4.6)
Table 4. Adsorption capacity and stoichiometric time for breakthrough curves of water on narrow pore silica gel.
Table 5. Adsorption capacity and stoichiometric time for breakthrough curves of water on wide pore silica gel.
Silica gel is expected to have a high uptake of water at high relative humidity (>0.4 kg of H2O/kg dry solid for RH>90%) [51], however those values are only close to obtained for narrow pore silica gel at 298 K (Table 4).
When comparing by temperature, the breakthrough time is significantly smaller for wide pore silica gel, as well as the adsorption capacity. For narrow pore silica gel, there was an agreement amongst the results obtained, showing a decrease in stoichiometric time for the increase in flow rate, however, the adsorption capacity remained similar, with the exception of run RNSG_3.
On the other hand, for wide pore silica gel there was no agreement on the data obtained at any of the temperatures measured, requiring a new set of data to take conclusions.
Narrow Pore Silica Gel
T (K) 298 313
Run RNSG_1 RNSG_2 RNSG_3 RNSG_4 RNSG_5 RNSG_6 q (mol H20/kg sílica gel) 17.65 17.72 17.67 8.49 8.62 9.80
tst (s) 17546 11928 6930 8183 5385 3774
Wide Pore Silica Gel
T (K) 298 313
Run RWSG_1 RWSG_2 RWSG_3 RWSG_4 RNSG_5 RWSG_6 q (mol H20/kg silica gel) 3.88 5.01 7.51 2.48 1.85 1.44
24
5. Conclusions
Biogas is a renewable source of energy with an immense growth potential. In order to use it as fuel there is the need to upgrade it to biomethane by an efficient separation process to extract mainly hydrogen sulphide, water vapour and carbon dioxide. One of the best technologies available to do this is pressure swing adsorption. To design this process is necessary to select an adsorbent and for the purpose of this thesis was selected silica gel.
Isotherms of CO2 and CH4 at (283,298, and 313) K on two different types of silica gel from 0-20 bar and 0-50 bar, respectively were measured. The goal was achieved since the isotherms for both gases were determined and fitted to the Virial model with acceptable results. It was possible to observe that the pore diameter influenced the adsorption capacity. Also, for both samples the amount adsorbed of CO2 was much greater than that of CH4. If the PSA was to perform at large streams of CO2, the high value of the heat of adsorption must be taken into account.
Water vapour breakthrough curves on two different types of silica gel were obtained at (298 and 313) K for three different flow rates: (230.3, 342.3 and 566.6) ml.min-1 at a constant relative humidity of 94.1%. The stoichiometric times and the adsorbed capacity of water were obtained for all conditions. However, the data obtained are not ideal and were not fitted to a model. The flow rate was found to influence the onset of the breakthrough and there was a correlation between the stoichiometric time in the case of narrow pore silica gel, but no correlation in the case of wide pore silica gel. The adsorption capacity obtained for narrow pore silica gel showed reasonable agreement, while in the case of wide pore silica gel the repetition of the measurements should be done on a closed system with greater control of the temperature and other experimental conditions.
25
6. Assessment of the work done
6.1. Objectives achieved
The measurement of the isotherms at all the proposed conditions was obtained and the values were fitted to the Virial model as proposed.
Water vapour breakthrough curves were measured at all proposed conditions and the stoichiometric time and adsorption capacity were obtained, however, the values were not fitted to a model and there was a lack of agreement between the experiments on wide pore silica gel.
6.2. Limitations and future work
The equipment for the measurement of the breakthrough curves showed some limitations in order to achieve sufficient isolation and guarantee of stable operating conditions, such as temperature of the water and temperature of the oven. Therefore, in the future this limitation should try to be fixed in order to improve the quality of the results.
The possibility of the use of silica gel as an adsorbent is strongly economically motivated, allowing a single adsorbent to process the separation of two major undesirable components.
Due to time constraints, it was not possible to perform the measurement of water isotherms on silica gel for comparison with the water breakthrough curves as well as performing experiments on the PSA to validate the data obtained.
6.3. Final Assessment
The value of using biogas as a renewable source of energy is undeniable and the study of new and better ways to perform biogas upgrading should continue to take place. The selection of a good adsorbent for the process is of the utmost importance and new materials will continue to be discovered, but the potential of already known ones should not be discarded.
In order to make this process available for not only big plants but for small producers and take advantage of it being a locally sourced resource and making it rival with natural gas, the cost must be lowered and for that silica gel could be a good option. More tests should be done on the capacity of this adsorbent on a real pressure swing adsorption unit to truly identify the potential of this study.
26
References
[1] IEA, “Global Energy & CO2 Status Report,” 2019. [Online]. Available: https://www.iea.org/geco/. [Accessed: 25-Jun-2019].
[2] UN Environment, “Emissions Gap Report 2018,” United Nations Environment Programme, 2018.
[3] C. A., “Biogas Upgrading by Pressure Swing Adsorption,” Biofuel’s Eng. Process Technol., 2012.
[4] P. Weiland, “Biogas production: Current state and perspectives,” Appl. Microbiol.
Biotechnol., vol. 85, no. 4, pp. 849–860, 2010.
[5] A. Wellinger, J. Murphy, and D. Baxter, The biogas handbook: Science, production and
applications. Woodhead Publishing Limited, 2013.
[6] D. Deublein and A. Steinhauser, Biogas from Waste and Renewable Resources. Wiley, 2011. [7] B. project Partners, “Biogas : Renewable Energy for your Region ! Table of contents,” 2018. [8] European Biogas Association (EBA), “European Biogas Association Annual Report 2018,”
2018.
[9] M. Torrijos, “State of Development of Biogas Production in Europe,” Procedia Environ. Sci., vol. 35, pp. 881–889, 2016.
[10] I. P. Marques, L. Silva, S. Diberardino, F. Gírio, and T. P. De Leão, “biogás/biometano, um recurso energético renovável para Portugal,” Renováveis Magazine, vol. 35, pp. 28–29, 2018.
[11] Direção-Geral de Energia e Geologia, “Estatísticas rápidas,” 2019.
[12] I. Cabrita, L. Silva, I. P. Marques, S. Di Berardino, and F. Gírio, “Avaliação do potencial e impacto do biometano em Portugal: Sumário executivo,” LNEG – Laboratório Nacional de Energia e Geologia, I.P., 2015.
[13] Revista Cargo, “Dourogás focada em investir em cinco novo projectos de biogás nos próximos anos,” Revista Cargo, 2019.
[14] Ambiente Online, “Dourogás e EGF avançam com construção da primeira central de biometano,” 2010.
[15] L. Riboldi and O. Bolland, “Overview on Pressure Swing Adsorption (PSA) as CO2Capture Technology: State-of-the-Art, Limits and Potentials,” Energy Procedia, vol. 114, no. 1876, pp. 2390–2400, 2017.
[16] E. Ryckebosch, M. Drouillon, and H. Vervaeren, “Techniques for transformation of biogas to biomethane,” Biomass and Bioenergy, vol. 35, no. 5, pp. 1633–1645, 2011.
[17] C. T. Chiou, “Fundamentals of the Adsorption Theory,” Partit. Adsorpt. Org. Contam.
27
[18] D. M. Ruthven, Principles of adsorption and adsorption processes. Wiley-Interscience, 1984. [19] S. Brunauer, The adsorption of gases and vapors, no. vol. 1. Princeton University Press,
1945.
[20] M. Khalfaoui, S. Knani, M. A. Hachicha, and A. Ben Lamine, “New theoretical expressions for the five adsorption type isotherms classified by BET based on statistical physics treatment,” J. Colloid Interface Sci., vol. 263, no. 2, pp. 350–356, 2003.
[21] Grace Davison, “Adsorbents for Process Applications.” p. 11, 2010.
[22] R. K. Iler, The chemistry of silica : solubility, polymerization, colloid and surface
properties, and biochemistry. 1979.
[23] E. Smolková-Keulemansová and L. Feltl, Eds., “Chapter 9 Physical methods of gas analysis,” in Comprehensive Analytical Chemistry, vol. 28, 1991, pp. 123–221.
[24] W. K. Lewis, E. R. Gilliland, B. Chertow, and W. P. Cadogan, “Pure Gas Isotherms,” Ind.
Eng. Chem., vol. 42, no. 7, pp. 1326–1332, 1950.
[25] A. J. Gonzalez and C. D. Holland, Adsorption Equilibria of the Light Hydrocarbon Gases on
the Activated Carbon and Silica Gel, vol. 17. 1971.
[26] L. Wang and Q. Yu, “Methane adsorption on porous nano-silica in the presence of water: An experimental and ab initio study,” J. Colloid Interface Sci., vol. 467, pp. 60–69, 2016. [27] L. Zhou, X. Liu, J. Li, Y. Sun, and Y. Zhou, “Sorption/desorption equilibrium of methane in
silica gel with pre-adsorption of water,” Colloids Surfaces A Physicochem. Eng. Asp., vol. 273, no. 1–3, pp. 117–120, 2006.
[28] K. Zhou, S. Chaemchuen, and F. Verpoort, “Alternative materials in technologies for Biogas upgrading via CO2 capture,” Renew. Sustain. Energy Rev., vol. 79, no. August 2016, pp. 1414–1441, 2017.
[29] J. J. Haydel and R. Kobayashi, “Adsorption Equilibria in Methane-Propane-Silica Gel System at High Pressures,” Ind. Eng. Chem. Fundam., vol. 6, no. 4, pp. 546–554, Nov. 1967.
[30] A. Malek and S. Farooq, “Kinetics of hydrocarbon adsorption on activated carbon and silica gel,” AIChE J., vol. 43, no. 3, pp. 761–776, 1997.
[31] K. Berlier and M. Frère, “Adsorption of CO 2 on Microporous Materials. 1. On Activated Carbon and Silica Gel,” J. Chem. Eng. Data, vol. 42, no. 3, pp. 533–537, 1997.
[32] S. Krishnamurthy, R. Haghpanah, A. Rajendran, and S. Farooq, “Adsorption and Diffusion of CO2 and Nitrogen on 13X and Silica Gel,” 2012, p. 505.
[33] Y. Wang and M. D. LeVan, “Adsorption Equilibrium of Binary Mixtures of Carbon Dioxide and Water Vapor on Zeolites 5A and 13X,” J. Chem. Eng. Data, vol. 55, no. 9, pp. 3189–3195, 2010.
[34] M.-G. Olivier and R. Jadot, “Adsorption of Light Hydrocarbons and Carbon Dioxide on Silica Gel,” J. Chem. Eng. Data, vol. 42, no. 2, pp. 230–233, Mar. 1997.
28
[35] Y. Shen, W. Shi, D. Zhang, P. Na, and B. Fu, “The removal and capture of CO2from biogas by vacuum pressure swing process using silica gel,” J. CO2 Util., vol. 27, pp. 259–271, Oct. 2018.
[36] D. Ferreira, R. Magalhães, P. Taveira, and A. Mendes, “Effective Adsorption Equilibrium Isotherms and Breakthroughs of Water Vapor and Carbon Dioxide on Different Adsorbents,”
Ind. Eng. Chem. Res., vol. 50, no. 17, pp. 10201–10210, Sep. 2011.
[37] P. R. Mhaskar and A. S. Moharir, “Natural Gas Treatment Using Adsorptive Separation,” 2012.
[38] X. Liu, J. Li, L. Zhou, D. Huang, and Y. Zhou, “Adsorption of CO2, CH4 and N2 on ordered mesoporous silica molecular sieve,” Chem. Phys. Lett., vol. 415, no. 4–6, pp. 198–201, 2005. [39] S. Scott and F. Turra, “Six reasons to dry biogas to a low dewpoint before combustion in a
CHP engine,” Park. Prod., pp. 1–8, 2013.
[40] I. Park and K. S. Knaebel, “Adsorption breakthrough behavior: Unusual effects and possible causes,” AIChE J., vol. 38, no. 5, pp. 660–670, 1992.
[41] A. Chakraborty, B. B. Saha, S. Koyama, K. C. Ng, and K. Srinivasan, “Adsorption thermodynamics of silica gel-water systems,” J. Chem. Eng. Data, vol. 54, no. 2, pp. 448– 452, 2009.
[42] E. Van Den Bulck, “Isotherm correlation for water vapor on regular-density silica gel,”
Chem. Eng. Sci., vol. 45, no. 5, pp. 1425–1429, 1990.
[43] X. Li, H. Li, S. Huo, and Z. Li, “Dynamics and isotherms of water vapor sorption on mesoporous silica gels modified by different salts,” Kinet. Catal., vol. 51, no. 5, pp. 754– 761, 2010.
[44] O. Talu, “Needs, status, techniques and problems with binary gas adsorption experiments,”
Adv. Colloid Interface Sci., vol. 76–77, pp. 227–269, 1998.
[45] J. Rouquerol, F. Rouquerol, P. Llewellyn, and R. Denoyel, “Surface excess amounts in high-pressure gas adsorption: Issues and benefits,” Colloids Surfaces A Physicochem. Eng. Asp., vol. 496, pp. 3–12, 2016.
[46] K. Murata, J. Miyawaki, and K. Kaneko, “A simple determination method of the absolute adsorbed amount for high pressure gas adsorption,” Carbon N. Y., vol. 40, no. 3, pp. 425– 428, 2002.
[47] C. A. Grande, R. Blom, A. Möller, and J. Möllmer, “High-pressure separation of CH4/CO2 using activated carbon,” Chem. Eng. Sci., 2013.
[48] M. Benedict, G. B. Webb, and L. C. Rubin, “An empirical equation for thermodynamic properties of light hydrocarbons and their mixtures. I. Methane, ethane, propane and n-butane,” J. Chem. Phys., vol. 8, no. 4, pp. 334–345, 1940.
29
vol. 34, no. 11, pp. 1887–1893, 1988.
[50] Y. Zhao, Y. Shen, L. Bai, and S. Ni, “Carbon dioxide adsorption on polyacrylamide-impregnated silica gel and breakthrough modeling,” Appl. Surf. Sci., vol. 261, pp. 708–716, 2012.
[51] D. Basmadjian, The Little Adsorption Book: A Practical Guide for Engineers and Scientists, 1st ed. Toronto: CRC Press, 1996.
30
Appendix 1. Mercury porosimetry of narrow pore silica
gel
31
![Figure 1. The four main phases of biogas formation. [4]](https://thumb-eu.123doks.com/thumbv2/123dok_br/18816293.927023/21.892.255.625.486.838/figure-main-phases-biogas-formation.webp)

![Figure 3. Classification of isotherms according to Brunauer, Emmet and Teller. [19]](https://thumb-eu.123doks.com/thumbv2/123dok_br/18816293.927023/25.892.289.601.508.848/figure-classification-isotherms-according-brunauer-emmet-teller.webp)