Ciências da Saúde
Detection of biometals signature of brain tissues by
X-ray fluorescence
Patrícia Gonçalves D’Amil
Dissertação para obtenção do Grau de Mestre em
Ciências Biomédicas
(2º ciclo de estudos)
Orientador: Prof. Doutor Jorge Maia
Co-orientador: Doutora Ana Clara Cristóvão
O conteúdo do presente trabalho é da exclusiva responsabilidade da autora: ____________________________________________________________
Agradecimentos
Queria agradecer, em primeiro lugar, ao meu orientador, Professor Doutor Jorge Manuel Maia Pereira, do Departamento de Física da Universidade da Beira Interior e do LIP-Coimbra, Laboratório de Instrumentação e Física Experimental de Partículas, pela sugestão do tema, pelo apoio ao longo deste ano e acima de tudo pelos conhecimentos que me foi passando à medida que o projecto avançava. Quero também estender este agradecimento à Doutora Ana Clara Braz Cristóvão, do CICS-Centro de Investigação em Ciências da Saúde da Universidade da Beira Interior pelo apoio, essencial, na realização deste projecto.
Um agradecimento especial ao Professor Doutor José António Carvalho Paixão, coordenador do TAIL-UC (Trace Analysis and Imaging Laboratory da Universidade de Coimbra) onde parte deste trabalho foi realizado, e ao Doutor Pedro Sidónio, responsável pelo laboratório, pela disponibilidade e apoio técnico ao espectrómetro de fluorescência de raios X por energia dispersiva.
Ao LIP-Coimbra por me terem recebido e por todo o apoio prestado ao longo deste trabalho. Em particular quer agradecer ao técnico Américo Pereira e ao Mestre Alexandre Trindade por todo o seu apoio.
Ainda do LIP-Coimbra quero agradecer à Mariana Martins, ao Pedro Crispim e ao Miguel Moita por me terem recebido tão bem e por toda a ajuda que me deram.
Ao Marco Pinto por me ter ajudado na chegada a Coimbra e por não ter deixado de o fazer mesmo à distância.
À Patrícia Lindeza, por me ter ajudado tanto nesta recta final. Pela preocupação, pela disponibilidade e pelo timing tão importante e pela força.
Às pessoas que tornaram melhor a minha estadia em Coimbra, Mónica Santos, Jéssica Mesquita, Marco Rodrigues e Luís Aurélio. Muito obrigada! É por vocês que agora, Coimbra é saudade.
À minha família, aos meus pequenos Rúben e Diana, à minha mãe e ao meu pai . Sem vocês nada disto teria sido possível. E claro, à Elizabeth, Paulo, Filipa por estarem sempre disponíveis e por me ajudarem tanto.
À Rita Carneiro por estar sempre presente, pela ajuda, pela compreensão, pela disponibilidade a qualquer hora.
Finalmente, ao João Ferreira por estar sempre ao meu lado, nos melhores e nos piores momentos. Por ter tido a paciência e a compreensão necessárias para me acompanhar ao longo de todo este percurso.
Ao meu mais recente companheiro de trabalho, Paulo Fura, por ter acompanhado esta fase final ajudando-me a manter-me focada.
Resumo
A espectrometria de fluorescência de raios X por energia dispersiva é uma técnica que permite a identificação de elementos atómicos em amostras sem interferir com a estrutura das mesmas. Inicialmente a amostra é excitada com um feixe primário de raios X que promove a emissão de raios X de fluorescência, característicos dos elementos atómicos constituintes da amostra. De seguida, e baseando-se na energia dos raios X de fluorescência característicos emitidos, o espectrómetro de raios X monta um espectro de energia onde a cada elemento atómico detetado corresponde um pico com energia característica, cuja área é uma medida indirecta da concentração do elemento na amostra.
A doença de Parkinson é a segunda doença neurodegenerativa mais comum em todo o mundo, a seguir à doença de Alzheimer, afectando cerca de 0.3% da população dos países industrializados. Esta patologia caracteriza-se por causar tremor, rigidez, dificuldade em iniciar movimentos e postura instável. A causa desta condição é a degeneração de neurónios dopaminérgicos na substantia nigra que, em condições normais, são responsáveis pela produção de dopamina e libertá-la no striatum, ajudando no controlo dos músculos envolvidos nos movimentos e na coordenação motora.
Na literatura têm sido documentadas algumas alterações na concentração de elementos atómicos em amostras de cérebros com doença de Parkinson. Deste modo, propôs-se realizar medições da intensidade de raios X de fluorescência característicos em amostras nas quais esta patologia foi induzida por Paraquat e em amostras controlo quer na substantia nigra quer no striatum.
O objectivo deste trabalho consistiu na optimização das condições de operação do espectrómetro de fluorescência de raios X por energia dispersiva no intuito de numa fase posterior identificar possíveis alterações na concentração dos elementos medidos no modelo de Parkinson utilizado.
Ao nível dos resultados, a optimização dos parâmetros do equipamento no sentido de obtermos as melhores condições de identificação e medição da concentração dos elementos foi conseguida. No que diz respeito à alteração dos elementos medidos nos dois grupos, o controlo e o tratado com paraquato, as diferenças não foram, no geral, estatisticamente significativas excepto no caso do cobre, que se mostrou aumentado no striatum (≈15%).
Palavras-chave
Resumo Alargado
A espectrometria de fluorescência de raios X por energia dispersiva é uma técnica que permite a identificação de elementos atómicos em amostras sem interferir com a estrutura das mesmas. Inicialmente a amostra é excitada com um feixe primário de raios X que promove a emissão de raios X de fluorescência, característicos dos elementos atómicos constituintes da amostra. De seguida, e baseando-se na energia dos raios X de fluorescência característicos emitidos, o espectrómetro de raios X monta um espectro de energia onde a cada elemento atómico detetado corresponde um pico com energia característica, cuja área é uma medida indirecta da concentração do elemento na amostra.
A doença de Parkinson é uma doença neurodegenerativa, a segunda mais comum em todo o mundo e afecta cada vez mais pessoas, sendo que, nos países industrializados a percentagem de doentes é de cerca de 0.3%. Esta condição tem como consequências tremor, rigidez, dificuldade em iniciar movimentos e instabilidade em termos de postura.
Esta patologia caracteriza-se pela degeneração dos neurónios dopaminérgicos, localizados na
substantia nigra. Estes, em condições normais são responsáveis pela produção de dopamina e
consequente libertação no striatum. Em conjunto estas estruturas são responsáveis pelo movimento e coordenação motora.
Há evidências que demonstram que a degeneração celular na doença de Parkins on pode ser despoletada pelo stress oxidativo. O organismo no geral tem mecanismos de defesa contra esta condição mas aparentemente o cérebro é mais sensível aos danos do que os outros órgãos. As células dopaminérgias sofrem, especialmente, com esta condição pois durante a produção de dopamina ocorre também a formação de espécies reactivas de oxigénio, responsáveis pelo aumento do stress oxidativo.
A manutenção da homeostase dos metais no cérebro é de extrema importância. Estes, quando presentes em quantidades normais são indespensáveis para o normal funcionamento do cérebro mas podem tornar-se perigosos quando não estão em equilibrio. Por exemplo, o ferro tem funções crucias em processos metabólicos como a respiração mitocondrial, síntese de proteínas e biossíntese de neurotransmisores. Mas, quando desregulado, como metal de transição, pode participar em reações que aumentam consideravelmente a quantidade de radicias livres. O mesmo se passa com o cobre. Este tem um papel muito importante pois funciona como co-factor da enzima anti-oxidante superóxido dismutase. Mas, quando aumentado, o cobre tem a capacidade de participar em reações que promovem a formação de radicias livres. No caso do zinco, este tem uma função importante no sistema imunitário e, como é um metal inerte, não participa em reações que originam radicais livres.
O objectivo deste trabalho consistiu na optimização das condições de operação do espectrómetro de fluorescência de raios X por energia dispersiva de modo a conseguir identificar alguns elementos atómicos para posteriormente fazer a caracterização em termos dos elementos atómicos de um grupo de roedores aos quais foi induzida doença de Parkinson e compará-los com um grupo normal. Para a indução da doença de Parkinson foi utlizado um modelo que reproduz muitas das características da patologia, como a degeneração de neurónios dopaminérgicos e que consiste na injecção intraperonial de um composto, o paraquato.
A cada indíviduo de cada um dos grupos foram retiradas duas amostras de tecido cerebral, uma da substantia nigra e uma do striatum. Ambas foram analisadas utilizando condições definidas após a optimização dos parâmetros espectrómetro de fluorescência de raios X e depois procedeu-se ao tratamento dos dados de forma a tentar estabelecer uma comparação entre os dois grupos. Para cada uma das regiões do cérebro foram utilizados três filtros de raios X que nos permitiram analisar determinados elementos atómicos. O filtro para o cloro, que permitiu analisar fósforo, enxofre, cloro, potássio e cálcio; o filtro para o crómio que permitiu analisar todos os elementos referidos e o ferro; e o filtro para o mapeamento de chumbo que possibilitou a análise de ferro, cobre e zinco.
Em termos de resultados, podemos afirmar que a optimização das condições de operação do espectrómetro de fluorescência de raios X foi conseguida, uma vez que conseguimos medir e analisar vários elementos atómicos importantes em ambas as regiões do cérebro. No que diz respeito à comparação entre os dois grupos, apenas a medição de um dos elementos (cobre) no striatum foi considerada estatisticamente significativa. Apesar disso, pode observar-se uma tendência em alguns dos elementos como por exemplo, o cloro aumenta sempre, o cálcio diminui, o cobre aumenta e o zinco diminui. No caso do ferro os resultados não foram significativos uma vez que este aumenta com filtro para mapeamento de chumbo e diminui com o filtro para o crómio. As variações nos elementos mais leves, fósforo, enxofre e potássio não seguem uma tendência.
Abstract
Energy dispersive X-ray fluorescence (EDXRF) spectrometry is a technique that allows the identification of atomic elements in samples without interfering with its structure. Firstly, the sample is excited with a primary ray beam that causes the emission of fluorescence X-rays, characteristic from the atomic elements in the sample. After this, and based on the energy of the fluorescence X-rays, the spectrometer is able to create a spectrum of energy wherein each atomic element detected has a characteristic peak with its characteristic energy, whose area is an indirect measure of the concentration of the element in the sample. Parkinson’s disease is the second more common neurodegenerative pathology in all world, affecting around 0.3% of industrialized countries population. This disease is characterized by resting tremor, rigidity, difficulty in initiating movement and postural instability. The cause of this condition is the degeneration of dopaminergic neurons in substantia nigra which, in normal conditions, are responsible for the production of dopamine and release it in striatum, helping in the control of muscles involved in movement and co-ordination.
In the literature have been documented some atomic element changes in brain samples with Parkinson’s disease. Thus, we propose to perform X-ray fluorescence intensity measurements in tissue samples in which this pathology was induced by Paraquat and control tissue samples in both substantia nigra and striatum.
The purpose of this study was to optimize the conditions of operation of the X-ray fluorescence spectrometer in order to, a posteriori, identify possible alterations in the concentration of the atomic elements measured in the Parkinson model used.
In terms of results, optimization of spectrometer parameters was achieved. Relatively to the distinction of the two groups, the differences were not in general statistically significant except for the copper, which showed an increased content in striatum (≈15%).
Keywords
Index
Chapter 1 - Introduction ...1
1.1. Measurement of Metals in Biologic Tissues ... 1
1.1.1. Analytical techniques to measure metals ... 1
1.1.2. The X-Ray Fluorescence (XRF) Spectrometry ... 3
1.2. Parkinson Disease ... 7
1.2.1. General Considerations ... 7
1.2.2. Oxidative Stress... 8
1.2.3. Mitochondrial dysfunction ... 9
1.3. Metals in Parkinson’s disease ... 9
1.3.1. General ... 9
1.3.2. Biometals as probes in Parkinson’s disease ... 10
1.4. Parkinson’s disease Models... 13
1.5. Objectives ... 15
Chapter 2 – Experimental Setup, Material and Methods ... 16
2.1. Experimental Setup... 16 2.1.1. General Description ... 16 2.1.2. X-ray tube ... 17 2.1.3. X-ray collimator... 18 2.1.4. X-ray filters ... 18 2.1.5. X-ray detector... 18 2.1.6. CCD Camera ... 19 2.1.7. Gas System ... 20 2.2. Materials ... 22 2.2.1. Tissue Samples ... 22 2.2.2. Tissue Frames ... 22
2.3. Fluorescence intensity measurement methods ... 23
2.3.1. Selection of the irradiation sample’s region ... 23
2.3.2. Selection of the dimensions of the sample ... 27
2.3.3. Calculation of the elements peak area/ X-ray fluorescence intensity ... 28
2.4. Statistical Analysis ... 33
Chapter 3 – Experimental Results and Analysis ... 34
3.1. Optimization of the signal to background ratio ... 34
3.1.1. X-ray fluorescence spectrometer parameter selection ... 34
3.1.2. Sample thickness ... 36
3.2. The elements fluorescence intensity in control and in treated group ... 37
Chapter 4 – Discussion ...51 Chapter 5 – Conclusions and Future Work ...55 Bibliography ...56
List of figures
Chapter 1
Figure 1.1 - Electromagnetic spectrum……….……….3
Figure 1.2. – Formation of fluorescent X-rays………....………..4
Figure 1.3 –Bremsstrahlung and characteristic radiation………...5
Figure 1.4. – a) Emission of fluorescence, characteristic from an element, b) fluorescence emission in a multi element sample.……….7
Figure 1.5. – Representation of the structures affected by Parkinson’s disease in a rodent brain………8
Figure 1.6. - Reactive oxygen species and redox cycling of iron. Fenton reaction is represented by equation (1) and describes the decomposition of hydrogen peroxide to the highly reactive hydroxyl radical, in the presence of ferrous iron. Iron-catalyzed Haber –Weiss reaction is represented by equation (2), also known as superoxide-driven Haber-Weiss reaction……….………...…11
Chapter 2
Figure 2.1 – Representation of SEA600VX (equipment on the left side of image and the asso ciated software on the right)……….……….16Figure 2.2 – Scheme of an X-Ray tube………17
Figure 2.3 – Scheme of the collimator………..………18
Figure 2.4 – Image provided by the CCD camera and all the commands available………20
Figure 2.5 – M easurement conditions selection window……….…………21
Figure 2.6 - Visual layout of the software (see text). Each image is displayed in an individual monitor (two monitors)...……….……….22
Figure 2.7 – Photographs of two assembled frames with tissue slices: (left) a slice of ST and (right) a slice of SN……….23
Figure 2.8 – Atlas images of SN borders, the first image a) represents anter ior side and b) the posterior……… 24
Figure 2.9 – Atlas images of ST borders, the first image a) represents anterior side and b) the posterior……… …26 Figure 2.10 – Example of a sample used to SN measurements. The blue circles represent SN and the grey squares the beams with which it was irradiated……….……….……….27 Figure 2.11 – Example of a sample used to ST measurements. The blue circles represent ST and the grey squares the beams with which it was irradiated.………28 Figure 2.12 – Gaussian fittings: a) spectrum using filter to chloride with peaks of phosphorus, sulfur, chloride and potassium; b) spectrum using filter to chromium with peaks of phosphorus, sulfur, chloride and potassium; c) spectrum using filter to PbM ap with peaks of iron, copper and zinc.……….………….30 Figure 2.13 – Iron peak and it’s fitting (represent in red) with the sum of a linear function with and a Gaussian function. The fitting function is also represented……….……….31 Figure 2.14 – FWHM vs K energy for 1.21.2 mm2 beam (black squares) and 3.03.0 mm2 beam (red
circles). The fitting is represented in both cases by a red line. The fitting function is also showed……..32 Figure 2.15 – Example of double Gaussian fit to obtain Ca X-ray fluorescence intensity. In black it’s represented the original sum peak (resulting from K K (energy 5.59 keV) and the Ca K X-rays (energy
5.69 keV)), green is the double Gaussian fit, blue line is K Gaussian curve and red is Ca Gaussian curve……….33
Chapter 3
Figure 3.1 – The response of the three filters used in this work: a) filter to Cl ( X-ray tube conditions: 15 kV and 500 A); b) filter to Cr (X-ray tube conditions: 15 kV and 1000 A); and c) filter to PbM ap (X-ray tube conditions: 30 kV and 500 A)……….36 Figure 3.2 – X-ray fluorescence intensity obtained in SN using a filter to Cl. a) example of two spectra, resulting of acquisitions with an 1.21.2 mm2 beam, 500 A and 15 kV in which we can see the elements
P, S, Cl, K and Ca (peak results from the sum of K of K and K of Ca and so the dashed line is dived the
peak). C is for control (black) and T for treated (red), empty, squares and spots, represent a sample value of X-ray fluorescence intensity and full the average of them. b) phosphorus, c) sulfur, d) chloride,
Figure 3.4 – X-ray fluorescence intensity obtained in SN using a filter to PbM ap. a) example of two spectra, resulting of acquisitions with an 1.21.2 mm2 beam, 500 A and 30 kV in which we can see the
elements Fe, Cu and Zn. C is for control (black) and T for treated (red), empty, squares and spots, represent a sample value of X-ray fluorescence intensity and full the average of them. b) iron, c) copper and d) zinc……….……….41 Figure 3.5 –X-ray fluorescence intensity obtained in ST and using a filter to Chloride. a) example of two spectra, resulting of acquisitions with an 3.03.0 mm2 beam, 100 A and 30 kV in which we can see the
elements P, S, Cl, K and Ca. C is for control (black) and T for treated (red), empty, squares and spots, represent a sample value of X-ray fluorescence intensity and full the average of them. b) phosphorus, c) sulfur, d) chloride, e) potassium and f) calcium………43 Figure 3.6 – X-ray fluorescence intensity obtained in ST using a filter to chromium. a) example of two spectra, resulting of acquisitions with an 3.03.0 mm2 beam, 200 A and 15 kV in which we can see the
elements P, S, Cl, K, Ca and Fe (peak results from the sum of K of K and K of Ca and so the dashed line
is dived the peak). C is for control (black) and T for treated (red), empty, squares and spots, represent a sample value of X-ray fluorescence intensity and full the average of them. b) phosphorus, c) sulfur, d) chloride, e) potassium, f) calcium and g) iron……….……….45 Figure 3.7 – X-ray fluorescence intensity obtained in ST and using a filter to PbM ap. a) example of two spectra, resulting of acquisitions with an 3.03.0 mm2 beam, 100 A and 30 kV in which we can see the
elements Fe, Cu and Zn. C is for control (black) and T for treated (red), empty, squares and spots, represent a sample value of X-ray fluorescence intensity and full the average of them. b) iron, c) copper and d) zinc……….…….46 Figure 3.8 - Elements in SN in percentage of control. a) filter to Cl, b) filter to Cr and c) filter to PbM ap……….…48 Figure 3.9 - Elements in ST in percentage of control. a) filter to Cl, b) filter to Cr and c) filter to PbM ap……….………50
List of Tables
Chapter 1
Table 1.1 – Example of some traditional methods to measure metals and their advantages and disadvantages………1 Table 1.2 – Resume of some other techniques used to measure metals and their main characteristics…..2 Table 1.3 - Toxin based animal models for Parkinson’s disease and its characteristics…….………14
Chapter 2
Table 2.1 – Values of ROI (KX-rays) for 8 s of peaking-time……….……28
Table 2.2 – Values of ROI (KX-rays) for 1 s of peaking-time……….……..29
List of Acronyms
6-OHDA 6-hydroxydopamine
-syn -synuclein
BBB Blood Brain Barrier CNS Central Nervous System DMT Divalent Metal Transporter
EDS Energy Dispersive X-Ray Spectroscopy EDXRF Energy Dispersive X-Ray Fluorescence EELS Electron Energy Loss Spectroscopy EPMA Electron Photon Micro Analysis FWHM Full Width at Half Maximum GSH Glutathione
ICP-MS Inductively Coupled Plasma Mass Spectrometry
LA-ICP-MS Laser Ablation Inductively Coupled Plasma Mass Spectrometry LB Lewy Bodies
LIP Labile Iron Pool MAO Monoamine Oxidase MCA Multi-Channel Analyzer
MPTP N-metyl-4-phenyl-1,2,3,6-tetrahydrox ypyridine MRI Magnetic Resonance Imaging
OH Hydroxyl Radical PD Parkinson’s Disease
PIXE Particle Induced X-Ray Emission PQ Paraquat
ROI Region of Interest ROS Reactive Oxygen Species SEM Scanning Electron Microscopy SIMS Secondary Ion Mass Spectrometry SN Substantia Nigra
SNpc Substantia Nigra pars compacta
SOD Superoxide Dismutase
ST Striatum
TEM Transmission Electron Microscopy XFM X-Ray Fluorescence Microscopy XRF X-Ray Fluorescence
Chapter 1 - Introduction
1.1. Measurement of Metals in Biologic Tissues
1.1.1. Analytical techniques to measure metals
There are evidences that link the deregulation of metal homeostasis to the neuropathology of neurodegenerative disorders [1-6]. This section presents some of the techniques that can be used to measure metals in biological tissues.
There are some traditional methods to obtain information about samples elemental composition as atomic absorption spectrometry and inductively coupled plasma mass spectrometry (ICP - MS) [7]. Atomic absorption spectrometry is a method for quantitative determination of chemical elements using the absorption of light by free atoms of the sample in the gaseous state (atomized samples). In this technique the concentration of a particular element in the sample is analyzed. ICP–MS is a type of mass spectrometry which is capable of detecting metals in low concentrations. This technique uses ionized samples, so, as atomic absorption spectrometry, although afford high sensitivity, the localization of the elements in the samples is lost [8].
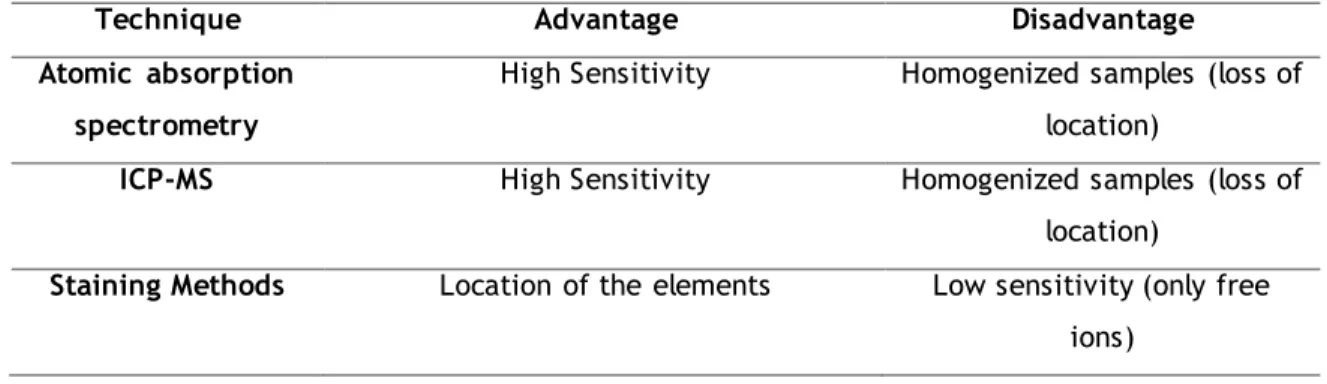
For the location of the elements staining methods can be used. The disadvantage of these methods is the low sensitivity to small concentrations of bio metals and, furthermore, the coloration is only sensitive to free ions [7]. Next, in Table 1, these techniques and their advantages and disadvantages are summarized.
Table 1.1. – Example of some traditional methods to measure metals and their advantages and disadvantages.
Technique Advantage Disadvantage
Atomic absorption spectrometry
High Sensitivity Homogenized samples (loss of location)
ICP-MS High Sensitivity Homogenized samples (loss of location)
Staining Methods Location of the elements Low sensitivity (only free ions)
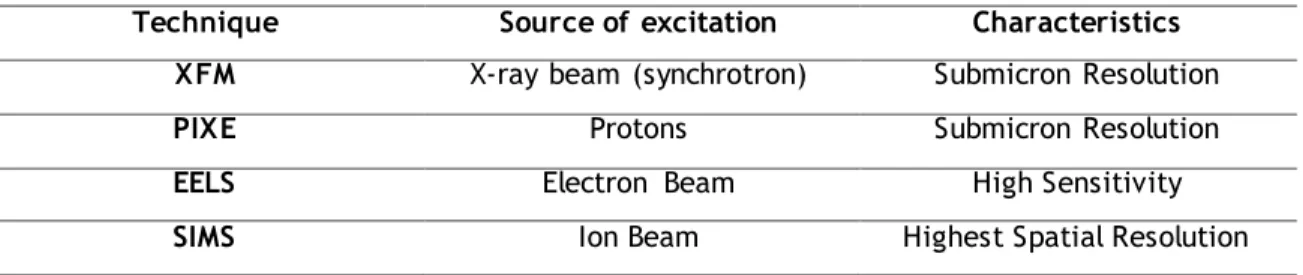
There are also some other techniques to measure metals, which have a high spatial resolution and sensitivity, to measure metals in tissues providing important information on cellular mechanisms of neurodegenerative diseases. Among these techniques are included synchrotron
X-ray fluorescence microscopy (XFM), particle induced X-ray emission (PIXE), electron energy loss spectroscopy (EELS) and secondary ion mass spectrometry (SIMS) [7].
X-ray fluorescence microscopy (XFM) is a technique that uses a very thin X-ray beam (provided from synchrotron) to excite samples inducing the emission of fluorescence X-rays that allow the identification of the elements present thereon [9, 10]. This technique has a high sensitivity and allows submicron spatial resolution [11].
Particle induced X-ray emission (PIXE) is a technique that uses a beam of accelerated particles to analyze a sample. Then the sample emits characteristic fluorescence X-rays that are detected and used to discriminate and quantify the presence of the different elements in the specimen [12]. This method it’s similar to XFM, excepted from the constitution of the beam, particles instead of X-rays [7].
Electron energy loss spectroscopy (EELS) utilizes an electron beam of known kinetic energy and measures the energy lost by the electron through inelastic scattering with the sample [7]. This technique also has an high sensitivity [13].
Secondary ion mass spectrometry (SIMS) imaging uses an ion beam to remove ions from the sample. Then, the secondary ions (removed from the samples) are then measured and the image is made. As this technique requires an high vacuum environment these experiments could be more difficult to perform [7]. It is the most popular ion mass spectrometry technique. With the use of a thin and focused beam of ions, it has the highest spatial resolution [14]. A resume of all these techniques is represented in table 2 below.
Table 1.2. – Resume of some other techniques used to measure metals and their main characte ristics.
Technique Source of excitation Characteristics XFM X-ray beam (synchrotron) Submicron Resolution
PIXE Protons Submicron Resolution
EELS Electron Beam High Sensitivity
1.1.2. The X-Ray Fluorescence (XRF) Spectrometry
X-rays form part of the electromagnetic wave spectrum which includes radio waves, microwaves, infrared and visible radiation and gamma rays. The electromagnetic spectrum is represented in figure 1 below.
Figure 1.1 - Electromagnetic spectrum [15].
X-rays were accidentally discovered by W. K. Röntgen while researching discharge tubes in 1895. Röntgen found that a screen used to cover a discharge tube glowed. He observed that by placing an object between the discharge tube and screen, a shadow of that object would be revealed on the screen. It was then recognized that this discovery might be used to look into the human body and other materials [16].
W. K. Röntgen discovered that X-rays have the ability to penetrate matter and that the penetrating X-rays are absorbed by matter, depending on which elements make up the matter. The larger the atomic number of the elements making up the substance, the larger will be the absorption effect [17]. This ability to penetrate tissue is due to, as can be seen in figure 1, X-rays short wavelength and high energy. The wavelength of these rays is between 0.01 and 10 nm corresponding to a range of energy between 100 eV and 100 keV [18].
Absorption of X-rays by a sample depends not only on the atomic number of each element in the substance but on the wavelength of the irradiating X-rays, the thickness and the elemental composition of the substance [17].
When an X-ray of certain energy hits a sample, the atoms of the sample are ionized and stay in a state of excitation. In the desexcitation to the fundamental sate they emit characteristic X-rays, called fluorescence X-rays [16]. These emitted X-rays have energies (wavelength) characteristic of each element in the substance. By examining the X-ray energy, the properties of an unknown sample can be analyzed and the sample identified [18, 19].
The energy that a given electron has is unique and depends, among another variables, in which of the atom shells the electron is. The electrons on K-shell have higher absolute value of energy than those in L and so on. The value of this energy is typical from the atom [18].
Recalling Bohr’s postulate that radiations are emitted only as a result of transfer of electrons between energy levels, it is therefore necessary to eject an electron from the atom in order to initiate the process for the emission of a radiation that is characteristic of the atom. For example, in X-ray fluorescence spectrometry, the ejection of K-shell electrons from atoms to generate the K spectral series requires that the incident photons energy overcome the binding energy binding of those electrons, the same to the other shells (L, M, N, etc). Thus, binding energies are also referred to as critical excitation energies, since they set the minimal energy that must be equaled or exceeded in order to eject electrons from atoms, leaving the latter in an unstable or ionized state necessary to initiate the process that leads to the emission of characteristic X-rays [18]. Fluorescent X-rays are created when a substance, irradiated by primary X-rays, gives off secondary X-rays with energy that is characteristic of a certain element [16, 17]. This effect is illustrated below in the figure 1.2.
Figure 1.2. – Formation of fluorescence X-rays. Image adapted from SEA6000VX Operation M anual, Hitachi High-Tech Science Corporation, 2013 [17].
If an electron from the L-shell drops into the K-shell, a designed K X-ray is emitted. If an electron from the M-shell or from the N-shell drops into the K-shell, a K X-ray is emitted. If
the ejected electron belongs to L-shell, some transitions from M and N are, respectively, L
[18]. The incident electrons can interact by two different means producing a continuous X-ray spectrum (Bremsstrahlung radiation) or the characteristic fluorescence X-rays of the target element. These two phenomena are represented in figure 1.3 below [18]. In most XRF systems the beam of X-rays incident on the sample is produced with a vacuum tube and created by bombarding a target (such as Rh, W, Cu, or Mo) with highly accelerated electrons. As shown in Figure 1.3., as the electrons penetrate the target atoms, they may have their direction changed as they pass near the nucleus of the atoms causing a sudden deceleration and loss of kinetic energy. In this loss of kinetic energy the electron may emit an X-ray with energy related to the amount of energy lost. As a result a broad spectrum of X-ray energies, known as a Bremsstrahlung continuum, is emitted [18].
Figure 1.3 – Bremsstrahlung and characteristic radiation [20].
This continuum can be adjusted by tube high voltage settings, beam filtering and secondary targets to allow one to focus on detection of specific elements within the sample. The collision of the accelerated electrons with the target atoms also causes emission of characteristic fluorescence X-rays [18].
To produce fluorescence X-rays from a sample two processes have to occur, excitation and emission. First, a high energy beam is generated and it’s the excitation source. Then, samples are irradiated and characteristic fluorescence X-rays of the elements presented are emitted [18].
As has been stated above, there are a set of techniques that can be used to measure metals. An example is laser ablation inductively coupled plasma mass spectrometry (LA -ICP-MS), as has also been explained before. XRF advantage when compared to this technique is that no sample preparation is required, and multiple atomic elements can be identified and measured. Additionally is nondestructive, so samples can be used for other purposes following the XRF analysis [4, 21]. Another example are the histochemical methods. Each one employs a different chemistry, and so they can’t be combined or used sequentially on the same tissue section [4].
Unlike conventional histology sections, XRF samples retain metals because they do not have to be dehydrated or embedded, and after nondestructive XRF mapping, the same sample can be processed for histology or immunohistochemistry. XRF is the only way to nondestructively and simultaneously visualize multiple metals in the same section to estimate the effect of therapeutic drugs on brain metals [10, 22].
Ethically, this technique is also advantageous because we can analyze various elements just using a sample instead of using a different one to identify each element, as there are techniques that can identify only one element.
XRF serves as an alternative method with sensitivity and spatial resolution sufficient to reveal the distribution of metals in cells and brain tissues. This technique has unique capabilities for analyzing the distribution of metal ions in the context of metal induced neurotoxicity [23].
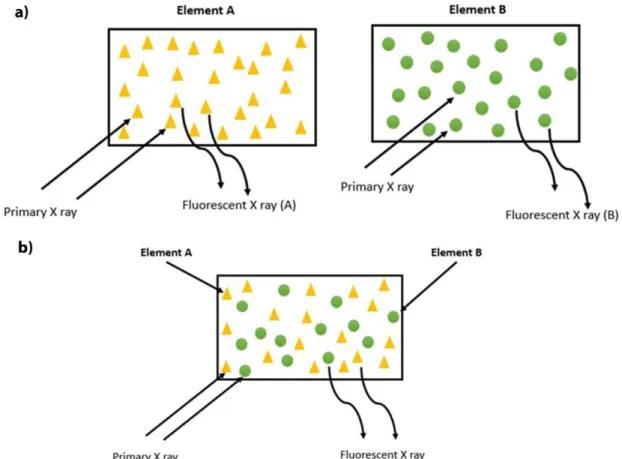
As shown in Figure 1.4 a), when an X-ray is irradiated into element A, fluorescent X-ray A is generated. When irradiated into element B, fluorescent X-ray B is generated [17].
When only the element A or B is excited, only the fluorescent X-ray A or B is irradiated but if a material with both A and B elements is irradiated both the A and B X-rays are generated, as is represented in Figure 1.4 b) [17].
The energies are separated and measured individually. When the concentrations of A and B components inside the material are changed, the intensity of A and B change as well [17].
Figure 1.4. – a) Emission of fluorescence, characteristic from a single element sample, b) fluorescence emission in a multi element sample. Image adapted from SEA6000VX Operation M anual, Hitachi High-Tech Science Corporation, 2013 [17].
1.2. Parkinson Disease
1.2.1. General Considerations
Parkinson’s disease (PD) is the second most common neurodegenerative disorder after Alzheimer disease, with prevalence in industrialized countries of approximately 0.3% of the population. This rises with age from 1% in those over 60 years of age to 4% of the population over 80, illustrating the effect of aging [24].
In terms of clinical features of PD, these include resting tremor, rigidity, difficulty in initiating movement and postural instability [25, 26]. Other motor features include gait and posture changes that manifest as festination (rapid shuffling steps with a forward-flexed posture when walking), speech and swallowing difficulties, a masklike facial expression and micrographia. Although this has been the classical textbook description of PD, more recently it has become recognized as a more complex illness encompassing both motor (referred above) and non-motor symptoms (NMS), such as depression, sleep disturbance, sensory abnormalities, autonomic dysfunction, and cognitive decline. NMS affect all patients with PD, the frequency of which increases with disease severity, with late stage patients exhibiting 6 to 10 NMS [24].
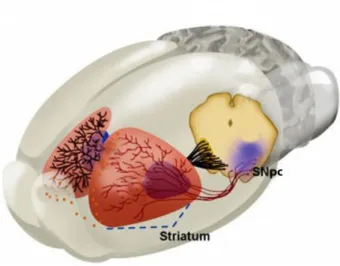
PD occurs as a consequence of the degeneration of dopamine producing neurons in a region of the midbrain called the substantia nigra pars compacta (SNpc) [22, 26-30]. In normal conditions dopaminergic neurons are responsible for the release of dopamine in striatum (ST), helping in the control of nerves and muscles involved in movement and co-ordination. Deficiency of dopamine in ST, caused by the death of dopaminergic neurons, is the main biochemical defect in PD [25]. Figure 1.5 represents the structures in a rodent brain which are affected by PD. SN, ST and their connection can been seen.
Figure 1.5 – Representation of the structures affected by Parkinson’s disease in a rodent brain. Image adapted from Arias-Carrion et al [31].
1.2.2. Oxidative Stress
Many studies have shown that oxidative stress triggers a cascade of events which is responsible for neural cells death during PD [26, 28, 30, 32].
During cellular aerobic metabolism, reactive oxygen species (ROS) like superoxide (O2•-),
hydrogen peroxide (H2O2), hydroxyl radical (OH•) and peroxynitrite (ONOO-) are generated.
This molecules can be responsible for the damage of some cellular components s uch as proteins, nucleic acids and lipids leading to cellular degeneration. To protect the organism
1.2.3. Mitochondrial dysfunction
Mitochondria are responsible for generating 90% of the ATP necessary for all cellular functions, for detoxifying ROS production via mitochondrial respiration, for controlling the cellular redox state, and for regulating cytoplasmic calcium levels by acting as a major intracellular sink for this ion. Oxidative damage to the mitochondria might interfere with all of these functions [28].
Mitochondrial dysfunction is a basic problem associated with many neurodegenerative processes as well as normal aging [2, 4, 28] and it also constitutes a problem in PD [22, 33]. A proposed mechanism of neuronal death is the response to oxidative stress and abnormal calcium signaling causing mitochondrial dysfunction. Defects in mitochondrial respiration are responsible for the degeneration and death of neurons during the course of most, if not all, neurodegenerative disorders [2].
Thus, mitochondria play a key role in regulating cellular survival and death and are an important source of ROS within most mammalian cells such that mitochondria damage highly contributes to neurodegeneration [29].
1.2.4.
-Synuclein aggregation and formation of Lewy Bodies
Besides the dopaminergic neuronal lost, PD is characterized by the accumulation and aggregation of -synuclein (-syn) and the consequent formation of Lewy Bodies (LB) [3, 7, 25, 28, 29, 32, 34].
-Syn is a small protein largely distributed throughout brain that can act as a negative regulator of DA synthesis. -Syn aggregation is promoted by DA and its metabolites (iron, for example) and in this form (LB) it can’t prevent DA synthesis [35]. As stated above, when in excess DA is responsible for the production of ROS [28].
There is a study confirming that elevated concentrations of DA are neurotoxic and that agents that can decrease DA are neuroprotectors. This study also links DA metabolism and its interaction with -Syn to neurodegeneration explaining the susceptibility of dopaminergic neurons and, consequently SN, to neurodegeneration in PD [36].
1.3. Metals in Parkinson’s disease
1.3.1. General
Essential metals are crucial for the maintenance of cell homeostasis. The neurobiology of metals is now growing in interest, since it has been linked to many neurodegenerative
diseases. Some metals appear to play an important role in oxidative stress, particularly in mitochondria, protein misfolding, and aggregation leading eventually to neurodegeneration [2-4, 7, 37, 38]. This is probably the result of a progressive deterioration of the metal regulatory systems and dysfunctional metal transport by brain barriers [39], which appear highly enhanced under various pathological conditions, causing increased oxidative stress [4] and favoring abnormal metal–protein interactions [2]. There is accumulating evidence that altered metal homeostasis may be involved in aggregation of intrinsically disordered proteins, for example, interacting on -Syn structure and aggregation propensity [3, 7, 36, 40].
Transition metals play an important role in regulating neuronal activity within the synapses and they are essential for the biological functions of several metalloproteins such as Cu/Zn Superoxide Dismutase (SOD) and cytochrome c oxidase. Besides that, transition metals are required for many enzymatic activities, mitochondrial function, neurotransmission and memory [29].
Furthermore, as transition metals they have the ability to participate in redox reactions, making these elements responsible for ROS production and when in excess increasing oxidative stress [30].
As already stated above, metal ions are vital to ensure many cellular processes but their concentrations must be well regulated because abnormalities may lead to cell death and serious illness. There are a plethora of mechanisms responsible for that regulation so that the metal ion content is maintained in the required level and not in deficiency or excess. These mechanisms failure can lead to several disease state including neurodegenerative diseases [29].
1.3.2. Biometals as probes in Parkinson’s disease
It has been observed that patients with PD tend to accumulate Fe in their nervous system [2, 3, 5, 7, 22, 25, 26, 28, 29, 41-44], suggesting a role for this transition metal in this disorder. Fe accumulation leads to excessive production of ROS, protein, DNA and phospholipid oxidation and, ultimately, to structural and functional damage [26, 29].
Free iron is the major transition metal implicated in the participation on redox reactions in
vivo. These reactions are responsible for the generation of ROS, which, in turn, cause
oxidative stress [26].
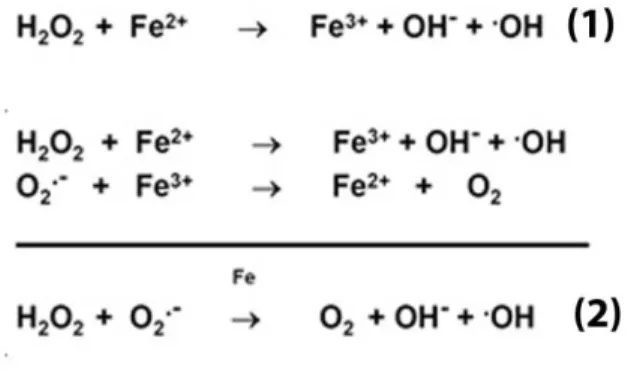
Figure 1.6 - Reactive oxygen species and redox cycling of iron. Fenton reaction is represented by equation (1) and describes the decomposition of hydrogen peroxide to the high ly reactive hydroxyl radical, in the presence of ferrous iron. Iron-catalyzed Haber –Weiss reaction is represented by equation (2), also known as superoxide-driven Haber-Weiss reaction. Image adapted from Garcia Castineiras, 2010 [46].
Metals participate in redox reactions leading to the formation of superoxide and hydroxyl radicals, mostly via the Haber-Weiss reaction (number (2) in Figure 1.6 above) in which superoxide (O2•–) promotes the reduction of ferric Fe3+ to ferrous Fe2+. This reaction is
followed by the Fenton reaction (number (1) in Figure 1.7. above) wherein ferrous Fe2+ and
hydrogen peroxide (H2O2) react to generate ferric Fe3+, hydroxide (OH–), and the reactive
hydroxyl radical (OH•). Cu+ and Cu3+ ions may substitute for Fe2+ and Fe3+ ions in the Haber–
Weiss reaction [2, 7, 22, 26, 28, 47].
Fenton reaction may be initiated by a small quantity of free iron, leading to the production of ROS which will cause damage to neurons. As it has been mentioned, Fe is a co-factor in the production of DA [27] and so it’s not surprising that in SN high levels of iron could play an important role leading ultimately to the loss of dopaminergic neurons [26, 29]. This metal stimulates the auto-oxidation of dopaminergic neurons, liberating even more H2O2 and it also
catalyzes the conversion of the DA in excess to neuromelanin, an insoluble dark pigment that can be found in aged DA neurons [29, 48].
Generally the brain regions responsible for motor functions seem to have more iron than non-motor related regions explaining why movement disorders are often associated with iron concentration [29].
So, iron is a very important element in the brain but in excess it is responsible for the production of ROS and consequent neural damage. Therefore, the cell must guarantee that this element is in equilibrium [25].
Copper is a redox active transition metal occurring in two main oxidation states, +2 and +1. As such, it is also associated with the generation of ROS because it participates in Fenton reactions in a process similar to iron [29].
Besides this mechanism, copper modulates oxidative stress by also reducing the levels of glutathione. Normally glutathione (GSH) concentration in the cells is in the millimolar range. GSH acts as potent cellular antioxidant and as substrate for several enzymes removing ROS. Glutathione is involved in intracellular copper metabolism and it can modulate copper toxicity by directly coordinating the metal with high affinity. Moreover the stabilization of copper reduced state, makes it unavailable for redox cycling [29].
Also contributing to the defense against oxidative stress is cytosolic copper-zinc superoxide dismutase (CuZnSOD), which convert superoxide to O2 and H2O2, are important as enzymatic
defenses. Decreases in CuZnSOD activity can lead to a perturbation of cellular antioxidant defense mechanisms and promote oxidative stress.
In addition of copper involvement in the oxidant environment of the cells, this ion also binds with -syn. This interaction results in the generation of unique toxic forms of oligomers, which are -Syn varieties capable of inducing formation of pores in the cellular membrane, changing the intracellular ionic balance, triggering apoptosis, affecting functions of mitochondria, intensifying degradation of proteins and inducing oxidative stress [49].
Zinc (Zn) is the most abundant trace metal in the brain where it plays various functions. It interacts with several proteins conferring on them catalytic or structural properties. Zinc is released into the synaptic cleft and it modulates some receptors regulating the activity of glutamatergic synapses, suggesting its possible role as a neurotransmitter on its own. Several different factors, such as balance between the cellular redox state, the concentrations of other biological chelating agents and the energy status of the cell are determinant for zinc
1.4. Parkinson’s disease Models
There are several experimental models of PD. They can be divided into two main groups, the toxin based models and the genetic mutations models. The toxin based models, in which is included the model used in the present work, can reproduce the pathologic hallmarks of PD, still there are some deviations from the disease. For example, using these kind of models the degeneration of dopaminergic neurons occurs quickly, days, instead of years as happens in the real state of the disease [38].
MPTP (1-methyl-4-phenyl-1,2,3,6-tetrahydropyridine) has been a toxin of choice for investigations into the mechanisms involved in the death of dopaminergic neurons in PD [50]. MPTP primarily causes damage to the nigrostriatal DA pathway with a profound loss of DA in the striatum and SNpc. This specific and reproducible neurotoxic effect on the nigrostriatal system is the strength of this model [38].
Like MPTP, 6-hydroxidopamine (6-OHDA) is a selective catecholaminergic neurotoxin that is used, mainly, to generate lesions in the nigrostriatal DA neurons in rats. Since 6-OHDA cannot cross the blood-brain barrier, systemic administration fails to induce PD. So, to overcome this issue, 6-OHDA is directly injected (typically as a unilateral injection) into the SNpc, medial forebrain bundle or striatum. The effects resemble those in the acute MPTP model, causing neuronal death over a brief time course (12 h to 2–3 days). The intrastriatal injection of 6-OHDA, causes progressive retrograde neuronal degeneration in the SNpc. As in PD, DA neurons are killed, and the non-DA neurons are preserved [38].
Chronic systemic exposure to rotenone in rats causes many features of PD, including nigrostriatal dopaminergic degeneration [51]. The rotenone administered animal model also reproduces all of the behavioral features reminiscent of human PD. Importantly, many of the degenerating neurons have intracellular inclusions that resemble LB morphologically. Usually, rotenone is administered by daily intra peritoneal injection, intravenously or subcutaneously [52].
Paraquat (1, 1-dimethyl-4,4’-bipyridinium dichloride), the toxin used in this work, is a quaternary nitrogen herbicide widely used for broadleaf weed control. It is a fast-acting, non-selective compound which destroys tissues of green plants. Various pesticides and herbicides are intensively used annually worldwide, with rotenone and paraquat (PQ) being only two of the many agricultural chemicals known to affect the dopamine systems. [53].
For many years, concerns about PQ exposure were focused on its effects on lung, liver and kidney because acute exposure to this pesticide in these organs can result in death. Then it was observed that PQ was structurally similar to MPTP and the hypothesis of neurotoxicity
was considered. Furthermore, there are studies that suggest an increased risk for PD due to PQ use [53].
There are studies showing that a repeatedly administration of PQ for 5 days to 6 weeks in rats produces a decrease in the number of dopaminergic neurons of the SN. The toxicity of this herbicide to this specific kind of neurons may be due to the fact that it specifically accumulates in neuromelanin containing neurons [54].
The cellular toxicity of PQ is essentially due to its redox cycle including a well-known cascade of reactions leading to NADPH consumption and to generation of ROS mainly hydrogen peroxide (H2O2) and hydroxyl radical (HO.) with consequent cellular toxic effects [55]. Indeed,
lipid peroxidation has been suggested as a potential mechanism of toxicity during exposure to PQ in vitro and in vivo [56].
PQ exposure also induces movement disorders in some mammalian models and it’s responsible for an increased level of -Syn which is followed by -Syn aggregation in the SNpc neurons[55, 57].
Because of the toxicity upon dopaminergic neurons, PQ is responsible for a decrease of dopamine concentration in striatum terminal, which induces neurobehavioral syndrome characterized by locomotion reduction [53, 55].
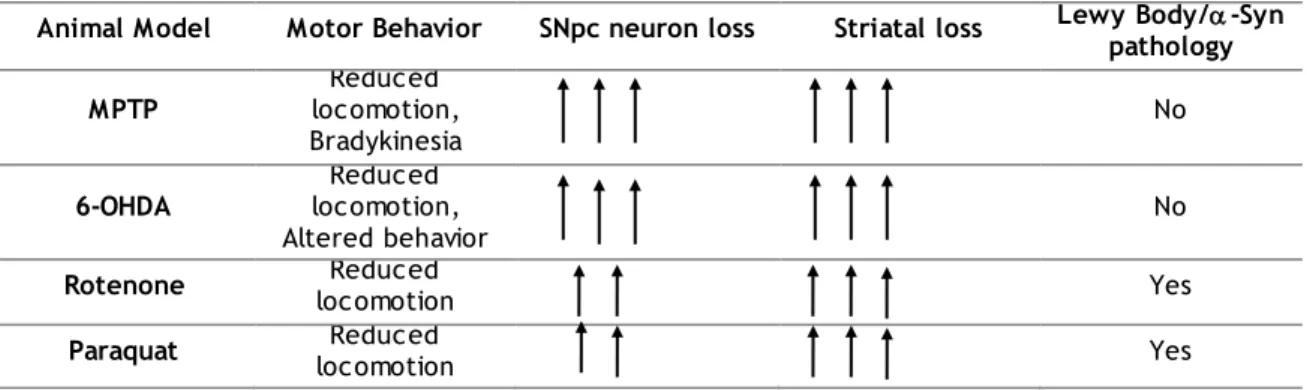
Table 1.3 shows a summary of the models that were listed above and its consequences in terms of loss of neurons in the SNpc, the loss of dopamine in striatum and the aggregation of
-Syn (Lewy bodies).
Table 1.3. - Toxin based animal models for Parkinson’s disease and its characteristics. Table adapted from Blesa, J. and Przedborski, S., 2014 [38].
Animal Model Motor Behavior SNpc neuron loss Striatal loss Lewy Body/-Syn pathology MPTP locomotion, Reduced
Bradykinesia
No Reduced
1.5. Objectives
The main objectives of this work are the optimization of the operational parameters of a commercial, non-dedicated, X-ray fluorescence spectrometer so we can be able to identify several atomic elements in two specific regions of the brain of a PD rodent model and to see if we can establish differences in the concentrations of the atomic elements between two groups, a control and a Paraquat treated group.
Chapter 2 – Experimental Setup, Material
and Methods
2.1. Experimental Setup
2.1.1. General Description
The measurement of brain tissue atomic elements were performed with the X-ray fluorescence spectrometer, model SEA6000VX from Hitachi High-Tech Science Corporation, figure 2.1, which performs qualitative and quantitative analysis of elements present in samples. This instrument was designed to perform multi-element spectroscopy and spectrometry.
Figure 2.1 – Photography of SEA6000VX X-ray fluorescence spectrometer [58].
There are several steps in generating fluorescence X-rays from a sample. SEA6000VX use the simplest type of ray tube to generate fluorescence rays. Primary rays produced by an X-ray tube irradiate the sample. After the X-X-rays are produced, they pass through the collimator so the size of the beam in the sample is set. Next, the beam passes through a filter that
The image of the sample is obtained by a CCD camera and displayed on a computer screen making accurate positioning easy. Beyond the image a guiding grid is also represented in the screen, the center of that grid corresponds to the measurement position center [17]. An image of this screen is depicted below in figure 2.4.
A controller joystick and a Z-axis control button allow the user to freely move the sample platform in any of the three axes directions (X, Y and Z). Adding this to the fact, mentioned above, that the position can be checked on the monitor makes the positioning of the measurement point more easy and fast [17].
2.1.2. X-ray tube
The X-ray tube is a vacuum tube that produces primary X-rays. The X-ray tube contains a filament that when an electric current crosses it, heats up the cathode electrode leading to thermionic emission of electrons. Then the electrons are accelerated by a high voltage and collide with a metal anode (target), producing primary X-rays. The X-ray tube is illustrated in the figure 2.2 below.
Figure 2.2 – Scheme of an X-Ray tube. Image adapted from SEA6000VX Operation M anual, Hitachi High-Tech Science Corporation, 2013 [17]. The maximum current selectable was 1000 A and the voltage 50 kV.
As electrons strike a target, most of the kinetic energy of the electrons is converted into heat. Only about 1% (or less) of the kinetic energy is converted into X-rays. The anode can be made of several kinds of materials, in the case of SEA6000VX, it’s a tungsten anode. Besides producing characteristic X-rays from atoms characteristic of the anode element, an X-ray tube also generates continuous X-rays from Bremsstrahlung X-rays, as referred above in section 1.1.2. The voltage applied determines the energy of the electrons that hit the anode and therefore the maximum energy of the X-rays that leave the tube.
2.1.3. X-ray collimator
The generated X-ray beam propagates in a wide beam. The X-ray beam applied to a sample must be very narrow, being the size controlled by the user. The collimator constricts the dimensions of the X-ray beam on the sample. It is formed by an open metallic cylinder where the incident X-rays cannot penetrate its walls. A collimator is represented in figure 2.3 below.
Figure 2.3 – Scheme of the collimator. Image adapted from SEA6000VX Operation M anual, Hitachi High-Tech Science Corporation, 2013 [17].
2.1.4. X-ray filters
The X-ray fluorescence spectrometer allows to choose between five X-ray filters (Cl, Cr, Pb, PbMap and UNI) and no filter at all. The filters allow the tuning the incident X-rays energy band with the excitation energy of the atomic elements. This is implemented via the partial photoelectric absorption of the incident X-rays by the selected filter’s material. Hereupon, and taking in to account the atomic elements that we want to measure, the filters that we choose to work (see section 3.1 below) were Cl (to measure low Z elements: P, S, Cl, K and Ca), Cr (to measure the low Z elements and Fe) and PbMap (to measure the transition metals:
Traditional X-ray fluorescence spectrometers require cooling of the detection system (detector and front-end electronics) by liquid nitrogen (-196 ºC) in way to achieve the desired energy resolution. This spectrometer has a liquid nitrogen-free detector, where the necessary moderate cooling (-30 -40 ºC) is implemented by a thermoelectric cooler (Peltier cell).
Approach of the sample to detector is a key factor to achieve worthy measurements. However, to prevent sample collision with X-ray detector, the system has an auto-set of sample height and a collision prevention system.
2.1.6. CCD Camera
This system has a CCD camera that shows on the PC-monitor the image of the sample on the sample-holder. This is very useful to the user because this way positioning the sample becomes an easier task. Besides, the center of image corresponds to the center of the X-ray beam and the size of it in the sample is also shown. In figure 2.4 is depicted the image of the sample for one of our measurements, using a 3.0×3.0 mm2 X-ray beam in which all of these
characteristics can be seen.
Figure 2.4 – Image provided by the CCD camera and all the commands available. The square on the picture represents the X-ray beam.
2.1.7. Gas System
This system has the option of using a helium flow to eliminate argon of air. As we attempt to measure some low-Z elements, and argon could interfere with some of them, we use the helium at a rate of 2L/min that is the value recommended.
2.1.8. Software
All the features of SEA6000VX X-ray spectrometer are controlled by the associated software, X-ray Station. This software facilitates the control of the equipment and makes the process of measurement simpler. The system software also allows the user to select measurement conditions, like the time of measurement, voltage, electric current, size of the beam, filter type, gaseous environment (air or He purge) and peaking-time of the front-end electronics. A typical window of the measurement conditions is represented in figure 2.5.
Beyond parameter selection, the software also allows the user to choose the elements in a periodic table to analyze (figure 2.6b, left side). The peaks of these elements will be highlighted in the energy spectrum as it’s shown in figure 2.6 a. The CCD camera image that we have already mentioned is also displayed on this screen.
a)
b)
Figure 2.6 – Visual layout of the software (see text). Each image is displayed in an individual monitor (two monitors).
2.2. Materials
2.2.1. Tissue Samples
Tissue samples were prepared at CICS facilities, University of Beira Interior. The experiments were performed on rats, in compliance with protocols approved by the national ethical requirements for animal research, the European Convention for the Protection of Vertebrate Animals Used for Experimental and Other Scientific Purposes (European Union Directive number 2010/63/EU). All procedures were approved by the local Animal Care and Use Committee. Male Wistar rats (8–10 weeks) were maintained in a temperature/humidity-controlled environment under a 12 light/dark cycle with ad libitum access to food and water.
Each animal received four intraperitoneal injections, separated by 1 day, of either vehicle (saline) or paraquat (PQ) (10 mg/kg body weight), according to a previously published dose. Five days after the last PQ intraperitoneal injection, animals were killed [59].
Samples were cut on a coronal brain matrice that allows cuts of 1mm slices minimum. To include the total region of interest (substantia nigra, SN and striatum, ST), each slice were cut with 3 mm of thickness. This value was also chosen based in the optimization done with the X-ray fluorescence spectrometer. This optimization is described next in section 3.1.
These experiments used 9 rats, 5 treated with PQ and 4 control. For each rat there were two cerebral slices, one of SN and one of ST.
2.2.2. Tissue Frames
Tissue frames, represented in figure 2.7, were also prepared on CISC facilities, University of Beira Interior. This assembly used plastic square frames with ≈3.03.0 cm2 open area and ≈1.7
mm thickness. First, a 7.5 m Kapton foil was glued to one side of the frame. Next the tissue slice was deposited on this foil and a second Kapton foil with the same thickness was glued to the frame to cover the tissue. The Kapton foil was used due to its high transparency to low energy X-rays.
Figure 2.7 – Photographs of two assembled frames with tissue slices: (left) a slice of ST and (right) a slice of SN.
To do the measurements, these tissue frames were placed upon a ≈ 2 cm thickness Perspex base, being approximately ≈ 3 mm away from the detector window. The Perspex base was placed over the system translational (XYZ) platform.
2.3. Fluorescence intensity measurement methods
2.3.1. Selection of the irradiation sample’s region
The selection of the irradiation sample’s region was made taking in to account the information of the Atlas with the rat brain in stereotaxic coordinates [60]. Is should be stressed that the dimensions depicted in the Atlas are typical dimensions, not necessarily equal to the dimensions in our tissues.
2.3.1.1. In substantia nigra
In the case of substantia nigra, the cut was made from bregma coordinate -2.3 mm, anterior side (see figure 2.8 a) to -5.6 mm, posterior side (see figure 2.8 b). The irradiation was made on the posterior side.
a)
2.3.1.2. In striatum
In the case of striatum, the cut was made from bregma coordinate 1.7 mm, anterior side (see figure 2.9 a)) to -1.3 mm, posterior side (see figure 2.9 b)). The irradiation was made on the anterior side.
a)
2.3.2. Selection of the dimensions of the sample
The selection of the dimensions of the X-ray beam on the sample was made based on Atlas images [60] shown previously and in the measurement of the tissue samples using the system of coordinates(XY) supplied by the spectrometer. This helped us to decide the size of the beam that we should use to cover the maximum possible area of each structure. The figure 2.10 depicts a tissue sample with the SN regions. The blue lines delimit the SN areas and the grey squares the 1.21.2 mm2 beams used to irradiate this zone.
Figure 2.10 – Example of a tissue sample used in SN measurements. The blue circles represent SN and the grey squares the beams with which it was irradiated.
For the case of ST regions, we choose to irradiate the sample two times with a 3.03.0 mm2
beams, as it’s represented in figure 2.11 below.
Figure 2.11 – Example of a sample used to ST measurements. The blue circles represent the ST and the grey squares the beams with which it was irradiated.
2.3.3. Calculation of the elements peak area/ X-ray fluorescence intensity
2.3.3.1. Region of interest (ROI)
Region of interest (ROI) is an interval of energy in which the system considers are the counts of a given element. The ROI is characteristic of the elements and change with the ability of the system to discriminate the energies, i.e. with the energy resolution, being larger in the case of ST measurements, because the lower peaking time of 1 s used in front-end electronics, resulting in higher electronic noise and thus in worst energy resolution.
Table 2.2 – Values of ROI (K X-rays) for 1 s of peaking time.
2.3.3.2. Gaussian and linear fittings
After the acquisition we had the raw data from SEA6000VX spectrometer, but that data (X-ray counts) for each atomic element detected included background counts that must be excluded in way to obtain the element X-ray fluorescence intensity, i.e. the X-ray fluorescence counts. Several methods could be implemented to perform this task.
Initially the method to subtract the background counts consisted in define a horizontal straight line below the respective element peak in the energy spectrum, then the straight line parameter was measured and multiplied by the number of energy bins (channels) in the element ROI, and then the resulting value was subtracted to the total number of counts in the ROI given by spectrometer. The problem with this method is that it could be subjective. Hereupon and as the atomic elements are depicted in the X-ray energy spectra in the form of Gaussian peaks, it was decided to perform Gaussian fittings to the peaks with the software OriginPro8. From the fittings it was extracted the parameters of the Gaussian function: the centroid (element energy), standard deviation (width) and area (which measures the element X-ray fluorescence counts), and the parameter for the baseline (which measures the background counts).
The Gaussian fitting was performed by selecting the ROI (for the K X-rays) of each atomic
element, then the software OriginPro8 provided a table with all the Gaussian parameters and baseline parameter.
The fittings are shown in figure 2.13 below. This method was applied to obtain phosphorus, sulfur, chlorine and potassium X-ray fluorescence counts with filters to chloride (Figure 2.13a) and to chromium (Figure 2.13b) and iron, copper and zinc X-ray fluorescence counts with filter to PbMap (Figure 2.13c).
Z Elem Name KEnergy (keV) ROI (keV)
15 Phosphorus (P) 2.014 1.88 - 2.15 16 Sulphur (S) 2.308 2.17 - 2.45 17 Chlorine (Cl) 2.622 2.48 - 2.77 19 Potassium (K) 3.313 3.16 - 3.46 20 Calcium (Ca) 3.691 3.54 - 3.84 26 Iron (Fe) 6.400 6.23 - 6.57 29 Copper (Cu) 8.042 7.86 - 8.23 30 Zinc (Zn) 8.631 8.44 - 8.82
Figure 2.12 – Gaussian fittings: a) spectrum using filter to chloride with peaks of phosphorus, sulfur, chloride and potassium; b) spectrum using filter to chromium with peaks of phosphorus, sulfur, chloride and potassium; c) spectrum using filter to PbM ap with peaks of iron, copper and zinc.
![Figure 1.1 - Electromagnetic spectrum [15].](https://thumb-eu.123doks.com/thumbv2/123dok_br/18174023.873864/25.893.243.690.265.452/figure-electromagnetic-spectrum.webp)
![Figure 1.2. – Formation of fluorescence X-rays. Image adapted from SEA6000VX Operation M anual, Hitachi High-Tech Science Corporation, 2013 [17]](https://thumb-eu.123doks.com/thumbv2/123dok_br/18174023.873864/26.893.111.713.525.719/figure-formation-fluorescence-adapted-operation-hitachi-science-corporation.webp)
![Figure 1.3 – Bremsstrahlung and characteristic radiation [20].](https://thumb-eu.123doks.com/thumbv2/123dok_br/18174023.873864/27.893.164.782.411.571/figure-bremsstrahlung-characteristic-radiation.webp)
![Figure 2.1 – Photography of SEA6000VX X-ray fluorescence spectrometer [58].](https://thumb-eu.123doks.com/thumbv2/123dok_br/18174023.873864/38.893.168.629.410.721/figure-photography-sea-vx-x-ray-fluorescence-spectrometer.webp)
