Interaction between GIS and hydrologic model: A preliminary
approach using ArcHydro Framework Data Model
doi: 10.4136/ambi-agua.1251
Received: 29 Nov. 2013; Accepted: 16 Dec. 2013
Silvio Jorge C. Simões
Universidade Estadual Paulista (UNESP) - Campus São José dos Campos, SP, Brazil Departamento de Engenharia Ambiental
Instituto de Ciência e Tecnologia - ICT
*Autor correspondente: e-mail: [email protected]
ABSTRACT
In different regions of Brazil, population growth and economic development can degrade water quality, compromising watershed health and human supply. Because of its ability to combine spatial and temporal data in the same environment and to create water resources management (WRM) models, the Geographical Information System (GIS) is a powerful tool for managing water resources, preventing floods and estimating water supply. This paper discusses the integration between GIS and hydrological models and presents a case study relating to the upper section of the Paraíba do Sul Basin (Sao Paulo State portion), situated in the Southeast of Brazil. The case study presented in this paper has a database suitable for the basin’s dimensions, including digitized topographic maps at a 50,000 scale. From an ArcGIS®/ArcHydro Framework Data Model, a geometric network was created to produce different raster products. This first grid derived from the digital elevation model grid (DEM) is the flow direction map followed by flow accumulation, stream and catchment maps. The next steps in this research are to include the different multipurpose reservoirs situated along the Paraíba do Sul River and to incorporate rainfall time series data in ArcHydro to build a hydrologic data model within a GIS environment in order to produce a comprehensive spatial-temporal model.
Keywords: geospatial analysis, water resource management, Paraíba do Sul Basin.
Interação entre SIG e modelo hidrológico: Uma abordagem
preliminary usando o ArcHydro Framework Data Model
RESUMO
Rev. Ambient. Água vol. 8 n. 3 Taubaté - Sep. / Dec. 2013
1:50.000. Neste projeto foi utilizado o ArcGIS®/ArcHydro FrameWork Model Data onde foi criada uma rede de dados topológica para produzir diferentes produtos matriciais. O primeiro mapa derivado do Modelo Digital de Elevação (MDE) foi o mapa direção de fluxo seguido pelo mapa de acumulação de fluxo e mapa de sub-bacias. Os próximos passos desta pesquisa devem incluir os diferentes reservatórios multiusos situados ao longo do rio Paraíba do Sul e incorporar dados de séries temporais de chuvas no ArcHydro com o objetivo de construir um modelo de dados hidrológicos dentro de um ambiente SIG a fim de produzir um modelo completo com componentes espaciais e temporais.
Palavras chaves: análise geoespacial, modelo hidrológico, gerenciamento de recursos hídricos.
1. INTRODUCTION
The management of water resources is naturally a concern of many countries and communities. In different regions of Brazil, population growth and economic development can degrade water quality, compromising watershed health and human supply. Decreases in the availability of water, degradation of water quality, and hydroclimatologic disasters (e.g. floods and landslides) are common in many Brazilian hydrographic basins including the Paraíba do Sul watershed, where several problems directly affect the management of water resources. On the other hand, a cycle of wet and dry years has occurred, leading to extreme floods and long periods of drought in the last decades (Simoes and Barros, 2007).
Because of its ability to not only organize, analyze, and manage geospatial data, but also to contribute to creating models for water resource management (WRM), the Geographical Information System (GIS) is a powerful tool for aiding in flood prevention, water supply estimation, and the management of water resources. For this reason, GIS is ideally suited for WRM activities that need to use spatial and temporal data from different sources. GIS is particularly useful in using different spatial analysis techniques to represent spatial variability related to hydrological cycle elements including precipitation, infiltration, and water quality. (Soares et al., 2012; Faria, 2012)
Because hydrologic phenomena are both spatially and temporally dependent, it is important that GIS and hydrological models integrate geospatial components, such as topographic and soil data, and time series data of precipitation, streamflow and river sedimentation. For this reason, distributed models represent the hydrologic process of the watershed in more detail than lumped models, which do not consider watershed spatial variability (Clark, 1999). However, distributed models are generally more complex, thus requiring more data, more computational resources, and more development time than lumped hydrologic modeling.
Different distributed hydrological models have been developed for operating within a Geographical Information System and can vary significantly because they could be used for several purposes. As an example, the free ArcHydro model was developed for building hydrologic information systems to synthesize geospatial and temporal water resources data that support hydrologic modeling and analysis (Maidment, 2002). This model has been used for different applications associated with water resources management such as flood analysis, water resource management and stream extraction from DEM ou LIDAR data (Ramroop, 2005; Colson et al., 2006; Kawasaki et al., 2008a, 2008b; Karagiozi et al., 2011). The model is developed as an Add-on to ArcGIS software being used to extract topologic variables from a digital elevation model raster (DEM) for building geometric networks for hydrologic analysis (Dost, 2005; Kraemer and Panda, 2009). The complete model consists of five categories to divide water resource elements, such as network, drainage, channel, hydrography, and time series. The ArcHydro tool generates several datasets that collectively describe the drainage pattern of a catchment. Most watershed managers need this facility for watershed management.
Therefore, the main objective of this study was to develop a preliminary geo-spatial model using the potentiality of integration between ArcGIS® and ArcHydro. The results correspond to the first part of the research and a simplified version of ArcHydro – named ArcHydro Framework – is used to obtain information about river network, watersheds, and monitoring points. The Paraíba do Sul Basin (Sao Paulo State portion), situated in Southeastern Brazil was chosen for this study because it has a large geodatabase available that could be compared with the results of this work.
2. MATERIALS AND METHODS
2.1. Study area characteristics
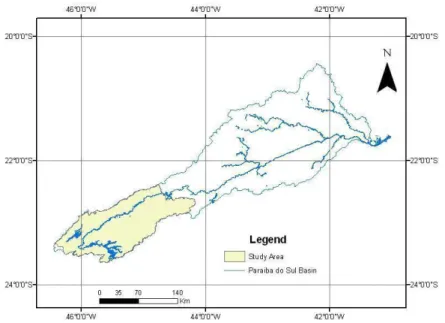
The study area corresponds to the upper section of the Paraíba do Sul Basin (Sao Paulo State portion), covering an area of close 14,500 km2 (CEIVAP, 2011). The Paraíba do Sul River has 1,145 km2 long and drains 55,400 km2 of the Sao Paulo, Minas Gerais e Rio de Janeiro states (Figure 1).
Rev. Ambient. Água vol. 8 n. 3 Taubaté - Sep. / Dec. 2013
Paraíba do Sul Basin is very important in the history, culture and economy of Brazil with a large amount of urbanization and industrial activity along the Paraíba do Sul River. The basin is characterized by heterogeneous geomorphology, hydrology and soils with elevations varying from about 400 m in alluvial plains up to more than 2400 m in the Mantiqueira mountain ridge. Historically, human activity dramatically transformed the regional landscape, reducing forested areas from nearly 81% to 8.0% over the last 300 years (Fujieda et al., 1997).
Currently, the landscape is a complex mosaic of grazing, forest, and urban areas. The population of the Paraíba do Sul Basin was approximately 6,400,000 in 2010 and expanded greatly in the last 30 years (CEIVAP, 2011). Cities continue to expand near or on alluvial plains, contributing to the reduction and elimination of wetland ecosystems and occupying a significant part of the floodplain.
Because of its strategic geographical position, multi-purpose reservoirs (electricity generation, flood control and flow regulation) were built first in the 1950s, and later in the 1970s. Since 1952, water has been diverted from the Paraíba do Sul River into the Guandu River water treatment plant in the Rio de Janeiro State. About 8.7 million people living outside of the basin (in Rio de Janeiro Metropolitan Region) depend on it for water supply. In the study area, mean river discharge is 217m3/s. The largest withdrawals of water are made for agricultural irrigation (10.4 m3/s), followed by industrial use, 6.5 m3/s and domestic use, 3.4 m3/s (Sao Paulo, 2012). Therefore, the Paraíba do Sul River is an example of complex multipurpose water resource management that links hydropower production to agricultural, industrial and domestic water use.
Previous studies have documented the bimodal character of the annual cycle of precipitation in southeast Brazil (Braga and Molion, 1999), with dry and wet seasons consistent with the transition from tropical to mid-latitude climate regimes. In the Paraíba do Sul Basin, the average annual precipitation is in the order of 1,400 mm, but exhibits large inter-annual variability ranging between 800 mm and 2000 mm. Severe droughts occurred in 1943/1944, 1953-1957, 1963, 1968, 1984, 1994, 1997 and 2001; whereas 1947, 1976, 1983 and 2000, 2008-2010 were exceptionally wet years. Dry and wet spells (1 - 2 years) alternate frequently in the observations.
In 2001, a severe drought was blamed for the severe reduction in water levels in the reservoirs of many Brazilian hydroelectric power plants (Simoes and Barros, 2007). By September 2001, the reservoirs were working at minimum capacity (about 20% of the total volume), evidence of the failure of existing energy and water resource management plans to meet unexpected shortages. The shortage continued until 2004. In contrast, in 2009 a very rainy period began. In January 2010, São Luis do Paraitinga, a small town located about 200 km from São Paulo, was devastated by a flood, and many historical buildings collapsed. In the last three years, other towns of different sizes have been affected along the Paraíba do Sul River.
The region therefore presents a high uncertainty in the long-term assessment of water resources with very high intra- and inter-annual variability in precipitation.
2.2. Database
2.3. Methodological procedures
Integrating GIS and hydrological models presents a great challenge because is difficult to combine, in the same environment, a non-GIS hydrological model that is coupled to the GIS data input or output data. According Shamsi (2002), the Integration Method represents the
closest relationship between the GIS and the floodplain models. In this case, two integration approaches are possible: 1) GIS Model Integration - all the four tasks of creating model input,
editing data, running the model, and displaying output results are available in GIS. 2) Model Based Integration - GIS modules are developed in or are called from a computer model
The relationship between ArcGIS® and ArcHydro is an example of GIS model integration because all tasks are developed in the GIS environment. ArcHydro is a hydrologic information system that is a synthesis of geospatial and temporal data supporting hydrologic analysis.
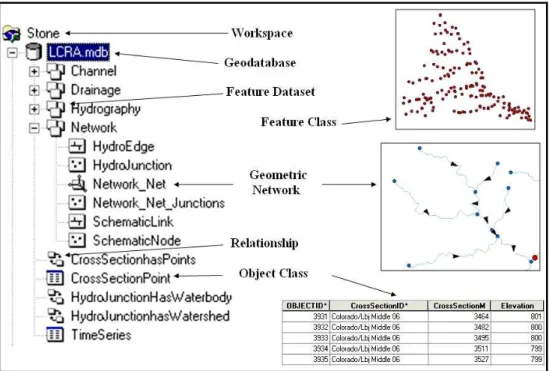
ArcHydro framework is the simplest way of using this software, providing a compact data structure for storing the most important geospatial data. The framework contains geospatial information organized in several levels: geodatabase, feature data set, geometric network, feature class and relationship elements (Figure 2). Geodatabase is a Microsoft
Access (.mdb) file used as a relational database file; Feature database set is a folder that
stores feature classes within a geodatabase with a defined map projection and coordinate system; Geometric Network is used in topologic operations; Feature Class is where the
individual geographic features are stored; Relationship is where features from one class are
related to those in another. In the other words, each watershed, water body, and monitoring point is related to a hydro junction on the network.
Figure 2. The components of the ArcHydro Model.
Source: modified from Maidment (2002).
Rev. Ambient. Água vol. 8 n. 3 Taubaté - Sep. / Dec. 2013
in many regions worldwide, considerable preparation is needed before the database can be loaded into the ArcHydro database.
After preparing the data, a personal geodatabase is created, in which all of the Arc Hydro objects (feature classes, tables) will be stored. During this process, it is important to select a correct projection system and spatial reference frame, which should be one that will accurately represent different geographic areas of the watershed of interest. Geodatabe works best when the feature classes have the correct class names. For that, a Arc Hydro schema is applied, which mainly consists of objects such as feature datasets, feature classes and tables, and relationships among them (for more details, see Maidment, 2000). Figure 3 shows a typical geodatabase with objects that relate to one another. Hydropoint represents point
features such as gauge station, Hydroedge represents line shapefile such as drainage, and Watershed represents a polygon feature class, which contains any subdivision of the
landscape into drainage areas.
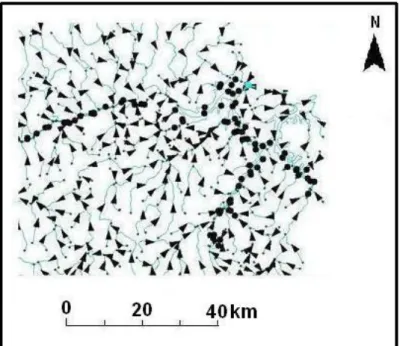
One of the important characteristics of the ArcHydro system is to construct water flow network. The final Arc Hydro Network creates a well-defined topology among polygon features (watershed boundary), lines (drainage system) and points (monitoring points). Therefore, HydroEdge and HydroJunction form a geometric network called HydroNetwork (Figure 3). This way, ArcGIS® can now be used to trace paths between any two network locations. Figure 3 shows the topological connectivity of partial drainage network of the study area near the river outlet.
Figure 3. Drainage network connectivity determined by the flow direction grid in the downstream of the Paraíba do Sul Basin.
3.
RESULTS AND DISCUSSION
In this research, the gridded data is derived from a TIN surface (Figure 4a) using spatial analysis tools available in GIS software. A DEM more appropriately represents land surface and drainage flow, as compared to TIN, because of its regular cell structure. A Hydrology DEM is generated which is a DEM with no sink areas. The sink areas are pixels which have heights that are lower than neighboring pixel values. For drainage analysis to proceed, all sinks need to be filled using available process within the Arc Hydro.
(a) (b)
Figure 4. (a) TIN model; (b) Digital Elevation Model (DEM).
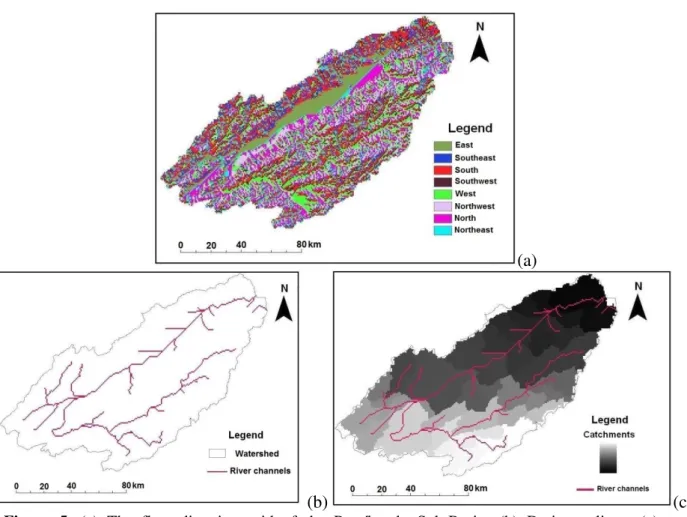
This first grid derived from the elevation model grid (DEM) is the flow direction grid (Figure 5a). A flow direction grid consists of values that indicate from which neighboring cell the water will flow. All raster operations involved in the watershed delineation are derived from the premise that water flows downhill according the eight-direction pour point model (Oliveira et al., 2000). It is important to note that the DEM must have enough precision of elevation measurement to support correct flow direction determination. Large extents of flat areas might produce a natural drainage pattern. The Paraíba do Sul Basin could be an example of such a situation, where the floodplain associated with the Paraíba do Sul River occupies an expansive area in the middle of the basin as can be seen in Figure 4a.
Flow accumulation is calculated from the flow direction grid. As highlighted by Oliveira et al. (2000), from the physical point of view the flow accumulation grid is the drainage area measured in units of grid cells. Therefore, it indicates how many cells are upstream or upslope of the current cell. According this model, water in a given cell can flow to one or more of its eight adjacent cells. The resulting flow direction is encoded 1 for East, 2 for Southeast, 4 for South, 8 for Southeast, 16 for West, 32 for Northwest, 64 for North and 128 for Northeast. Flow accumulation has been used along with flow direction, flow length and slope for different applications, such as flood forecasting (Kraus, 2000; Chen et al., 2003). The flow accumulation grid for the Paraíba do Sul Basin clearly shows how drainage areas are accumulated in the downstream sector of the study area (Figure 5a). With a flow accumulation grid, streams may be defined through the use of a threshold drainage area or the flow accumulation value (Oliveira et al., 2000). The cell values are assigned as 1, where there is a stream and “nodata” elsewhere. Therefore, all the stream cells are labeled identically with a value of 1, which were renamed as river channels (Figure 5b).
Rev. Ambient. Água vol. 8 n. 3 Taubaté - Sep. / Dec. 2013
(a)
(b) (c)
Figure 5. (a) The flow direction grid of the Paraíba do Sul Basin; (b) Drainage lines; (c) Catchment delineation.
4. CONCLUSION
The methodology presented in this paper offers new features that enhance the ability to create more accurate topologically based models of a hydrologic network and its relevant associated attributes. ArcHydro provides a set of objects and features that can be used as a starting point for many water resource projects. On the other hand, the derived data sets obtained from ArcHydro can assist hydrographic basin committees to make better informed decisions regarding the hydrology variables.
The next steps in this research are: a) to include the location of the multipurpose reservoirs situated along the Paraíba do Sul River; b) to incorporate rainfall time series data in ArcHydro to build a hydrologic data model within a GIS environment in order to produce a comprehensive spatial-temporal model.
5.
ACKNOWLEDGEMENTS
6. REFERENCES
BRAGA, B. P. F.; MOLION, L. C. B. Assessment of the impacts of climate variability and change on the hydrology of South America. In: VAN DAM, J. C. (Ed.). Impacts of climate change and climate variability on hydrological regimes. Cambridge:
Cambridge University Press, 1999. p. 21-35.
COMITÊ DE INTEGRAÇÃO DA BACIA HIDROGRÁFICA DO RIO PARAÍBA DO SUL – CEIVAP. Bacia do Rio Paraíba do Sul – Subsídios às ações de melhoria da gestão 2011. Resende: AGEVAP/CEIVAP, 2011. Technical Report.
CHEN, Y.; HU, J.; YU, J. A flash flood forecast model for the Three Gorges basin using GIS and remote sensing. IAHS publication, n. 282, p. 282-287, 2003.
CLARK, M. Putting water in its place: a perspective on GIS in hydrology and water management. In: GURNELL, A. M.; MONTGOMERY, D. R. (Eds.) Hydrological application of GIS. Chichester: John Wiley, 1999. p. 3-14.
COLSON, T. P.; GREGORY, J. D.; MITASOVA, H.; NELSON, S. Comparison of stream extraction models using LIDAR DEMs. In: AWRA SPRING CONFERENCE, 4., 8-10 May 2006, Houston. Proceedings… [S.l.]: AWRA, 2006.
DOST, R. J. J. Hydrologic information systems as a support tool for water quality monitoring: a case study in Bolivian Andes. 2005. Thesis (M. S.) - International Institute for Geo-information Science and earth Observation, Enschede, 2005.
FARIA, D. A. Influência do uso e ocupação do solo na qualidade da água da bacia hidrográfica do ribeirão Guaratinguetá (SP). 2012. Thesis (Master) - Graduate Program in Civil and Environmental Engineering, Universidade Estadual Paulista, 2012.
FUJIEDA, M.; KUDOH, T.; DE CICCO, V.; CARVALHO, J. L. Hydrological processes at the subtropical forest catchments of the Serra do Mar, Sao Paulo, Brazil. Journal of Hydrology, v. 196, p. 26-46, 1997. http://dx.doi.org/10.1016/S0022-1694(97)00015-2 KARAGIOZI, E.; ANDERADAKIS, E.; FOUNTOULIS, I; KONSTANTINIDIS, A.;
NTOUROS, K. Flood hazard assessment based on geomorphological analysis with GIS tools - The case of Laconia (Peloponnesus, Greece). In: SYMPOSIUM GIS, 20114, Ostrava. Proceedings… Ostrava: [s.n.], 2011.
KAWASAKI, A.; TAKAMATSU, M.; HE, J.; ROGERS, P. Potential impact of precipitation and land-cover changes on stream flow in Srepok River Basin in Vietnam and Cambodja: an analysis process for local level water resources adaptation. ABCD-GIS Working Groups. Harvard University, 2008a.
KAWASAKI, A.; HERATH, S.; MEGURO, K. Developing a universal water resource assessment model for sustainable water security: the case of Kanagawa Basin, Japan and the Mekong River Basin. ABCD-GIS Working Groups. Harvard University, 2008b.
Rev. Ambient. Água vol. 8 n. 3 Taubaté - Sep. / Dec. 2013
KRAUS, R. A. Floodplain determination using ArcView GIS and HEC-RAS. In: MAIDMENT, D.; DJOKIC, D. (Eds.) Hydrologic and hydraulic: modeling support. Redland: ESRI Press, 2000. p. 177-189.
MAATHUIS, B. H. P.; WANG, L. Digital elevation model based hydro - processing. Geocarto International, v. 21, p. 21-26, 2006.
MAIDMENT, D. R. ArcHydro. GIS for water resources. Redland: ESRI Press, 2002. OLIVEIRA, F.; FURNANS, J.; MAIDMENT, D.; DJOKIC, D.; YE, Z. Drainage systems. In:
MAIDMENT, D. R. (Ed.) ArcHydro. GIS for water resources. Redlands: ESRI Press, 2000. p. 55-86.
RAMROOP, S. Flooding analysis strategy using GIS. ESRI INTERNATIONAL USER CONFERENCE, August 2005, San Diego. Proceedings… [S.l.]: ESRI, 2005.
SAO PAULO (STATE). Water resources situation in the Sao Paulo State. São Paulo: Water and Electrical Energy Department (DAEE), 2012.
SHAMSI, S. U. GIS application in floodplain management. ESRI INTERNATIONAL USER CONFERENCE, August 2002, San Diego. Proceedins… [S.l.]: ESRI, 2002.
SIMOES, S. J. C.; BARROS, A. P. Regional climate variability and its effects on Brazil´s 2001 energy crisis. Management Environment Quality,v. 18, n. 3, p. 263-273, 2007. SOARES, P. V.; PEREIRA, S. Y.; SIMOES, S. J. C.; BERNARDES, G. P.; BARBOSA, S.;
TRANNIN, I. The definition of potential areas of infiltration in the Guaratingueta watershed, Southeast Brazil. An integrated approach using physical and land use elements. Environmental and Earth Sciences, v. 67, p. 1685-1694, 2012. http://dx.doi.org/10.1007/s12665-012-1610-6