Maio 2018
Igor Acoob Varagilal
Licenciado em Ciências de Engenharia Civil
Stability analysis of gravity dams for
the maximum design earthquake
Dissertação para obtenção do Grau de Mestre em
Engenharia Civil – Perfil de Estruturas
Orientador:
João Rocha de Almeida, Professor Associado, Faculdade de
Ciências e Tecnologia da Universidade Nova de Lisboa
Co-orientador:
Nuno Monteiro Azevedo, Investigador Auxiliar, Departamento
de Barragens de Betão, Laboratório Nacional de Engenharia
Civil
Presidente: Professor Doutor Daniel Aelenei Arguente: Doutor Sérgio Martins Oliveira
Maio 2018
Igor Acoob Varagilal
Licenciado em Ciências de Engenharia Civil
Stability analysis of gravity dams for
the maximum design earthquake
Dissertação para obtenção do Grau de Mestre em
Engenharia Civil – Perfil de Estruturas
Orientador:
João Rocha de Almeida, Professor Associado, Faculdade de
Ciências e Tecnologia da Universidade Nova de Lisboa
Co-orientador:
Nuno Monteiro Azevedo, Investigador Auxiliar, Departamento
de Barragens de Betão, Laboratório Nacional de Engenharia
Civil
Stability analysis of gravity dams for the maximum design earthquake
“Copyright” Igor Acoob Varagilal, da FCT/UNL e da UNL.
i
ACKNOWLEDGEMENTS
The completion of this thesis is the final chapter of my academic life, that lasted 5 years full of hard-work and dedication that would not have been possible without the following people:
Dr. João Rocha de Almeida, thesis supervisor, for his guidance during my academic life. His notes and advices were often fundamental to improve my work. I would also like to thank him for providing me this exceptional experience to work in LNEC, where I learned valuable academic and personal lessons.
Dr. Nuno Monteiro Azevedo, thesis co-advisor, for his tireless pursue of excellence and his never-ending availability to clarify any existing doubts about the program he himself created and developed. Without his extra efforts this thesis would not exist.
Dr. Maria Luísa Braga Farinha, for her invaluable guidance and for always providing me every material I needed to fully understand the problems ahead. Her continued encouragement and kindness, no matter the circumstances, were always a good incentive to keep pushing forward.
I would like to thank LNEC for granting me the means to develop this thesis within the framework of the research project “DAMFA: Cutting-edge solutions for sustainable assessment of concrete dam foundations” which has been carried out jointly by the National Laboratory for Civil Engineering (LNEC) and NOVA.ID.FCT – Associação para a Inovação e Desenvolvimento da Faculdade de Ciências e Tecnologia (FCT) da Universidade Nova de Lisboa”.
I would also like to thank the EDP – Energias de Portugal and Agência Portuguesa do Ambiente (APA) representatives who allowed me to follow an inspection visit to Pocinho dam, explaining me all the details I wished to know in my first inspection visit to a dam.
I would also like to thank the master and doctoral students and researchers from the Concrete Dams Department of LNEC for their laugh and friendship throughout these six months: Patrícia Reis, Cláudia Manco, André Alegre, Miguel Rodrigues, David Pereira, Pedro Miranda and Renato Pereira.
To my university colleagues and friends that accompanied me during my journey. You are too many to enumerate but I hope you know how much your support and warm words meant to me.
To my partner, Zuzana Marešová for her unquestionable support and friendly shoulder in the right moments. Her patience and love were always a source of energy for me.
iii
RESUMO
Neste trabalho é realizada uma análise de estabilidade de barragens gravidade considerando o sismo máximo de projeto. Tem-se em conta a interação entre o comportamento mecânico e hidráulico do maciço rochoso de fundação das obras.
Apresentam-se os aspetos mais relevantes relativos a barragens gravidade e as principais causas de rotura. São referidas recomendações atualmente em vigor, consideradas pelo Comité de Segurança Sísmica da Comissão Internacional das Grandes Barragens (ICOLD). Os principais fundamentos de aplicação sísmica nos modelos numéricos desenvolvidos são também apresentados, nomeadamente o modelo de massas associadas, que de forma simplificada representa a interação dinâmica entre o reservatório e o paramento de montante da barragem, as condições de fronteira adequadas para um método explícito e as hipóteses de amortecimento.
São analisadas duas barragens de altura diferente, fundadas em maciços rochosos de geometria idêntica com descontinuidades horizontais e verticais. Considera-se a existência de cortina de impermeabilização e de sistema de drenagem na fundação das obras. É efetuada uma análise bidimensional considerando um modelo descontínuo usando o programa Parmac2D-FFlow. Os deslocamentos na base da barragem, tanto no pé de montante como no pé de jusante, são comparados para a hipótese de amortecimento de Rayleigh e para o amortecimento considerando somente o termo de massa. Em todos os casos estudados são consideradas duas situações de comportamento da fundação: i) comportamento não-linear da junta barragem/fundação e comportamento elástico da zona da fundação fraturada e ii) comportamento não-linear da junta barragem/fundação e da zona fraturada da fundação. Os resultados apresentados permitem analisar o efeito da aceleração de pico e tirar conclusões sobre o efeito da rigidez normal das interfaces no comportamento de barragens gravidade sob ações sísmicas.
Palavras-chave: barragem gravidade, fundação rochosa, modelação numérica, comportamento
v
ABSTRACT
This thesis presents a two-dimensional hydrodynamic stability analysis of gravity dams for the maximum design earthquake. The coupled mechanical and hydraulic behavior of the dam’s rock mass foundation is taken into account.
The main aspects concerning gravity dams are presented along with their main failure causes. The safety rules currently in use and approved by the International Commission on Large Dams (ICOLD) Seismic Committee are presented. The fundamental elements of seismic application relevant for the models used in this work are also presented, such as the dynamic interaction between the reservoir and the upstream face of the dam, adequate boundary conditions for an explicit method and different damping hypotheses.
Two dams of different height are numerically analysed. Both dams have rock mass foundations with identical geometry, with horizontal and vertical discontinuities, and the grout and drainage curtains are simulated. Analysis is carried out with a discontinuum model, Parmac2D-FFlow. The displacements at the base of the dam, both on the dam’s heel and the dam’s toe, are compared for the Rayleigh damping hypothesis and the mass proportional term damping. In every case studied two different situations regarding the dam foundation behavior are considered: i) non-linear behavior of the dam/foundation interface and elastic behavior of the fractured rock mass area and ii) non-linear behavior of both the dam/foundation interface and the joints in the fractured rock mass area. The results presented allow the analysis of the effect of the peak ground acceleration to be carried out. Conclusions are drawn regarding the effect of joint normal stiffness on the behavior of gravity dams due to seismic loads.
Keywords: gravity dam, rock mass foundation, numerical modelling, hydrodynamic behavior,
vii
TABLE OF CONTENTS
1
INTRODUCTION ... 1
1.1 Background ... 1
1.2 Objectives and methodology ... 5
1.3 Thesis outline ... 5
2
GRAVITY DAMS ... 7
2.1 Structural stability ... 7
2.2 Main failure causes ... 9
2.3 Dam safety against earthquakes ... 10
2.3.1 Structural safety ... 12
2.3.2 Dam safety monitoring ... 13
2.3.3 Operational safety ... 14
2.3.4 Emergency planning ... 14
2.4 Seismic hazard ... 14
2.5 Seismic design criteria ... 15
2.6 Visit to Pocinho dam ... 16
3
HYDROMECHANICAL BEHAVIOR OF CONCRETE DAM
FOUNDATIONS ... 21
3.1 Hydromechanical interaction ... 21
3.2 Concrete dam foundations ... 23
3.3 Numerical modelling ... 26
3.3.1 Continuum equivalent and discontinuum models ... 26
3.3.2 Discontinuum analysis with Parmac2D-FFlow ... 27
3.3.2.1 Mechanical model ... 28
3.3.2.2 Hydraulic model ... 29
3.3.2.3 Hydromechanical model ... 31
3.4 Hydromechanical behavior of gravity dam foundations ... 32
3.4.1 Geometry ... 33
3.4.2 Material properties ... 35
3.4.3 Numerical models ... 36
3.4.4 Analysis sequence ... 38
viii
4
SEISMIC EVALUATION OF CONCRETE GRAVITY DAMS FOR
SHEAR SLIDING FAILURE SCENARIOS ... 43
4.1 Introduction ... 43
4.2 Hydrodynamic pressure ... 43
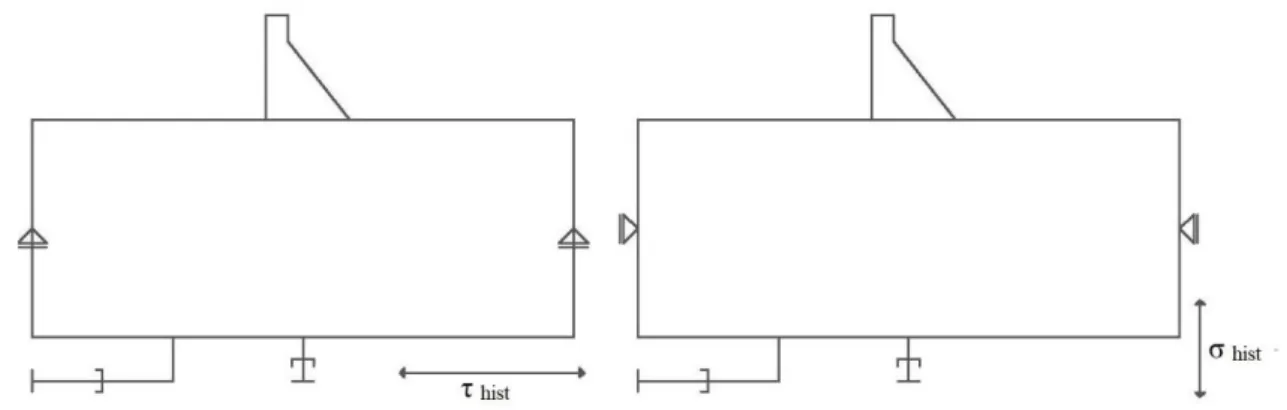
4.3 Earthquake equivalent loading and boundary conditions ... 45
4.3.1 Rigid rock mass foundation and seismic application using a velocity history record ... 45
4.3.2 Deformable rock mass foundation and seismic application using stress wave history ... 46
4.3.3 Deformable rock mass foundation and seismic application using free-field boundary conditions ... 48
4.4 Rayleigh damping ... 49
4.5 Safety factor criteria ... 51
4.6 Application example with the Parmac2D-FFlow program ... 52
4.6.1 Model description ... 52
4.6.2 Analysis of results ... 52
5
NUMERICAL MODELLING OF THE SEISMIC BEHAVIOR OF
GRAVITY DAM FOUNDATIONS ... 55
5.1 Material properties ... 57
5.2 Fundamental frequency and velocity history record ... 58
5.3 Boundary conditions ... 59
5.4 Calculation procedure ... 60
5.5 Analysis of results ... 60
5.5.1 Foundation behavior ... 60
5.5.1.1 Velocity ... 61
5.5.1.2 Water pressure ... 62
5.5.1.3 Normal effective stress ... 63
5.5.1.4 Shear sliding displacement ... 64
5.5.1.5 Maximum values ... 70
5.5.2 Effect of the normal stiffness ... 71
5.5.2.1 Water pressure ... 72
5.5.2.2 Normal effective stress ... 73
5.5.2.3 Horizontal and shear sliding displacements ... 73
5.5.3 Rayleigh damping effect ... 77
6
CONCLUSIONS ... 81
6.1 Summary and conclusions ... 81
ix
REFERENCES ... 83
APPENDIX 1
–
VERIFICATION AND VALIDATION OF THE
PARMAC2D-FFLOW PROGRAM... 87
A1.1 Cantilever ... 87
A1.2 Frame ... 92
xi
LIST OF FIGURES
Figure 1.1 – Single-purpose and multi-purpose dams’ distribution ... 2
Figure 1.2 – The world’s highest gravity, arch and buttress dams ... 3
Figure 2.1 - Gravity dam. Typical cross section (adapted from INAG, 2001) ... 8
Figure 2.2 – Main forces acting on a concrete gravity dam (www.hydroworld.com) ... 8
Figure 2.3 - Austin dam ruins (pabook2.libraries.psu.edu/palitmap/AustinDam.html) ... 10
Figure 2.4 - Koyna dam view (adapted from http://indianexpress.com/article/india/studying-seismic-activity-epicentre-zone-shifting-towards-warna-reservoir-4950512/) ... 12
Figure 2.5 – Dams in river Douro drainage basin... 18
Figure 2.6 - Upstream and downstream views of Pocinho dam ... 18
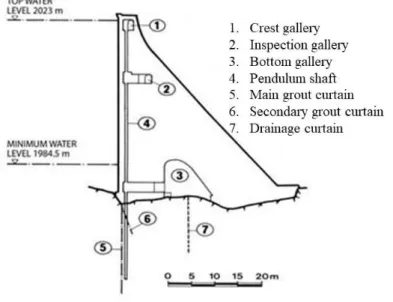
Figure 2.7 - Cross-section of Pocinho dam (http://cnpgb.apambiente.pt/gr_barragens/gbportugal/Pocinhodes.htm) ... 19
Figure 2.8 – Inspection galleries and some monitoring equipment ... 20
Figure 3.1 - Definition of mechanical aperture ... 22
Figure 3.2 - Hydraulic aperture ... 23
Figure 3.3 - Gravity dam cross section, indicating the location of grout curtain and drainage system (http://www.icold-cigb.net/GB/dams/dams.asp) ... 25
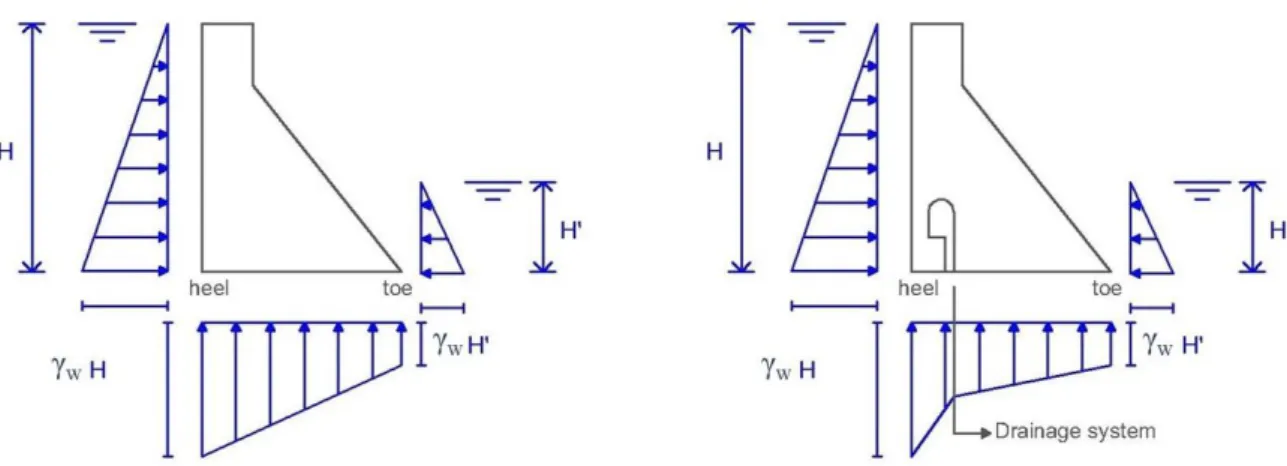
Figure 3.4 – Uplift pressure diagram in a concrete gravity dam without and with drainage system ... 26
Figure 3.5 - Mohr-Coulomb constitutive law for the interfaces (adapted from Bretas, 2012) ... 27
Figure 3.6 - Calculation cycle of the mechanical model ... 28
Figure 3.7 - Joint element model (Monteiro Azevedo & Farinha, 2015) ... 29
Figure 3.8 - Superposition of hydraulic and mechanical models ... 30
Figure 3.9 - Hydraulic calculation cycle ... 31
Figure 3.10 - Hydromechanical calculation cycle ... 32
Figure 3.11 – Model geometry: dam and foundation ... 33
Figure 3.12 – Model geometry of the dam ... 34
Figure 3.13 – Model geometry of the dam considering grout curtain and drainage system ... 34
xii
Figure 3.15 - Block model ... 37
Figure 3.16 – Mechanical model ... 37
Figure 3.17 - Hydraulic model ... 38
Figure 3.18 - Water pressure along the base of the dam for two interface models without water downstream from the dam ... 39
Figure 3.19 – Water pressure along the base of the dam with and without drainage system without water downstream from the dam ... 39
Figure 3.20 – Upstream face displacement for elastic behavior, with and without drainage system and without water downstream from the dam ... 40
Figure 3.21 – Upstream face displacement for Mohr-Coulomb behavior, with and without drainage system and without water level downstream ... 40
Figure 3.22 - Hydraulic head in the dam foundation (without grout curtain and drainage system)... 41
Figure 3.23 - Hydraulic head in the dam foundation (with grout curtain and drainage system) ... 41
Figure 3.24 – Percentage of hydraulic head in the dam foundation (without grout curtain and
drainage system) ... 42
Figure 3.25 - Percentage of hydraulic head in the dam foundation (with grout curtain and drainage system) ... 42
Figure 4.1 - Associated masses - Westergaard simplified solution (adapted from Westergaard, 1933) 44
Figure 4.2 - Rigid rock mass foundation and application of the seismic action through velocity
history records ... 46
Figure 4.3 – Deformable rock mass foundation and application of the seismic action through stress wave history ... 47
Figure 4.4 - Deformable rock mass foundation, free-field boundary conditions ... 49
Figure 4.5 - Rayleigh damping ... 50
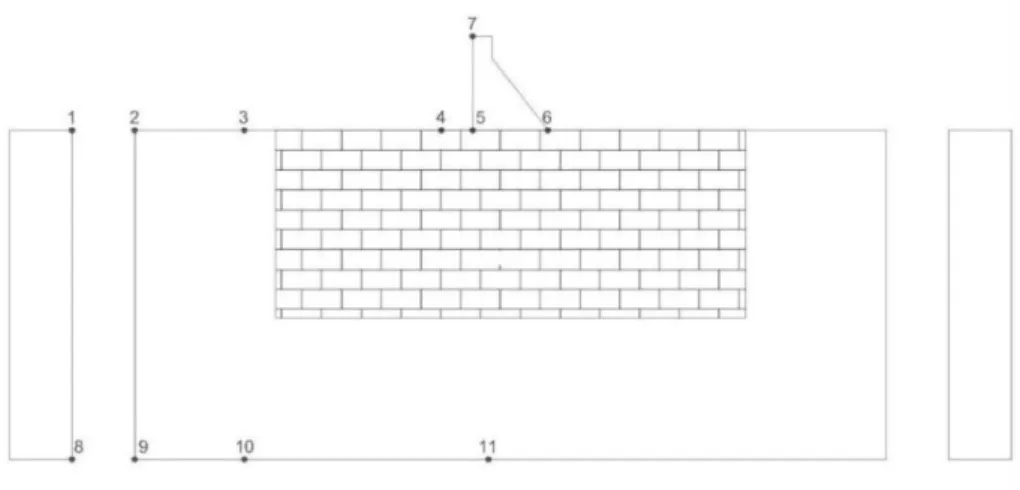
Figure 4.6 - Dam model highlighting the points where results are recorded during the seismic
analysis ... 52
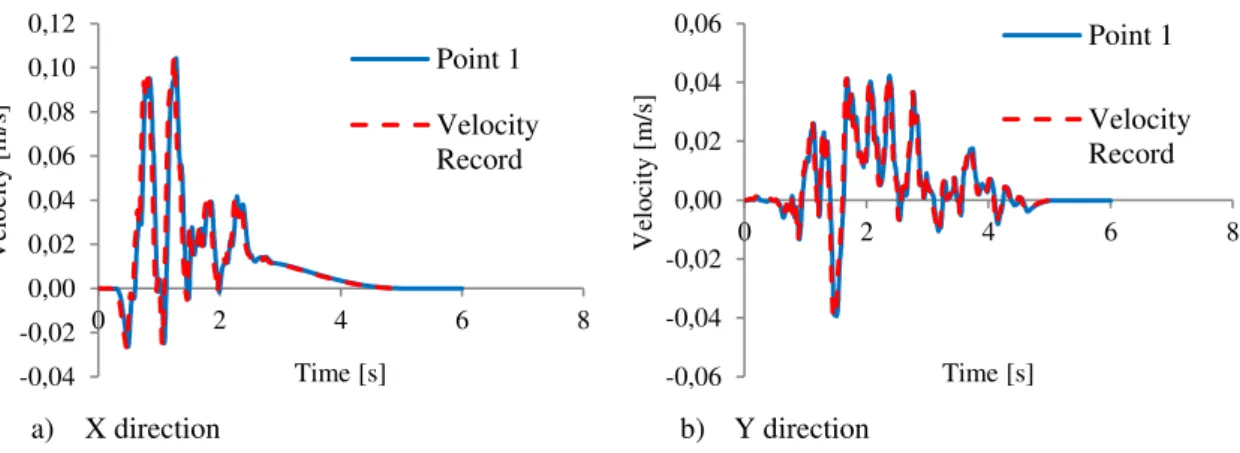
Figure 4.7 - Velocity results in point 1 for an earthquake with a PGA of 0.17 g and non-linear
behavior of the dam/foundation interface ... 53
Figure 4.8 - Velocity results in point 2 for an earthquake with a PGA of 0.17 g and non-linear
xiii
Figure 4.9 - Velocity results in point 3 for an earthquake with a PGA of 0.17 g and non-linear
behavior of the dam/foundation interface ... 53
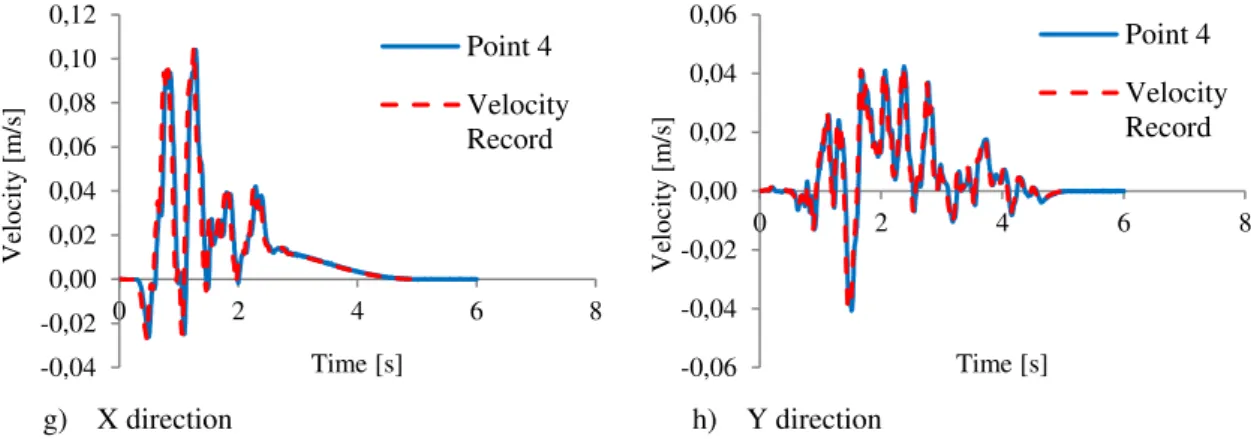
Figure 4.10 - Velocity results in point 4 for an earthquake with a PGA of 0.17 g and non-linear behavior of the dam/foundation interface ... 54
Figure 4.11 - Velocity results in points 5 for an earthquake with a PGA of 0.17 g and non-linear behavior of the dam/foundation interface ... 54
Figure 5.1 – Discretization of the hydrodynamic model of the 15 m high dam ... 56
Figure 5.2 - Discretization of the hydrodynamic model of the 30 m high dam ... 56
Figure 5.3 - Accelerograms for maximum design earthquake (horizontal and vertical components) ... 59
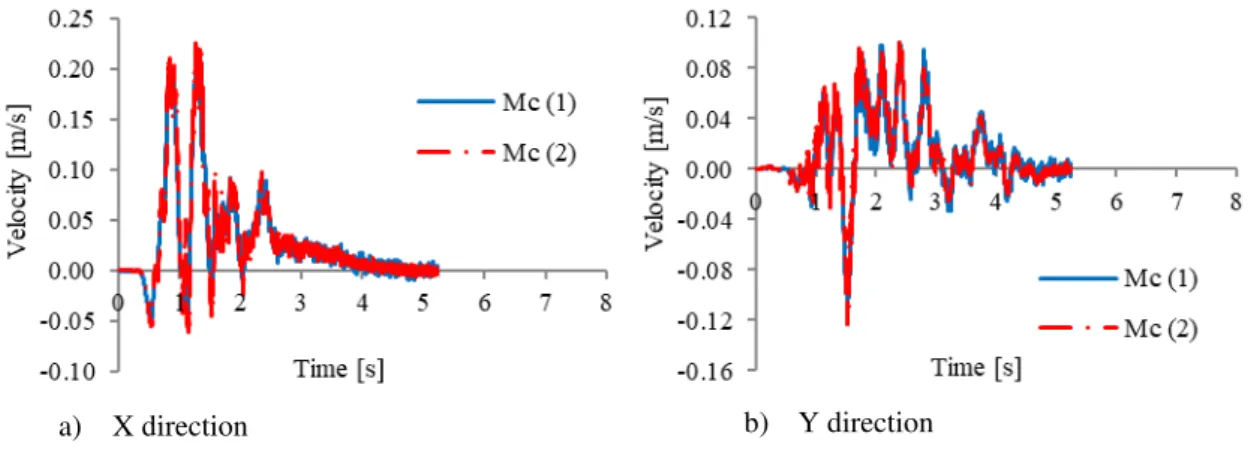
Figure 5.4 – Velocity recorded in point 4 for a PGA of 0.34 g (Mc) and for model 1 ... 61
Figure 5.5 - Velocity recorded in point 4 for a PGA of 0.34 g (Mc) and for model 2 ... 62
Figure 5.6 - Water pressure along the dam base for two interface models and for two dam heights .... 62
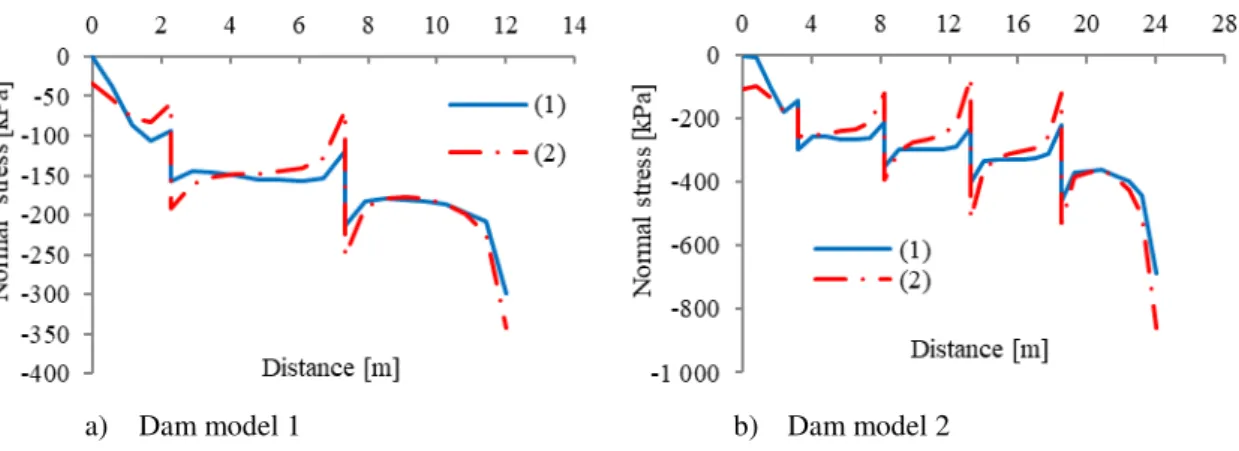
Figure 5.7 -Normal effective stress distribution along the dam/foundation interface before the
seismic analysis ... 63
Figure 5.8 - Comparison between the effective normal stress before and after the seismic analysis for the dam model 2 and a 0.34 g (Mc) earthquake ... 64
Figure 5.9 - Shear sliding displacement at the dam’s heel and toe for the dam model 1 and a PGA of 0.17 g ... 65
Figure 5.10 - Shear sliding displacement at the dam’s heel and toe for the dam model 1 and a PGA of 0.26 g ... 65
Figure 5.11 - Shear sliding displacement at the dam’s heel and toe for the dam model 1and a PGA of 0.34 g ... 65
Figure 5.12 - Shear sliding displacement at the dam’s heel and toe for the dam model 2 and a PGA of 0.17 g ... 66
Figure 5.13 Shear sliding displacement at the dam’s heel and toe for the dam model 2 and a PGA of 0.26 g ... 66
Figure 5.14 - Shear sliding displacement at the dam’s heel and toe for the dam model 2 and a PGA of 0.34 g ... 66
Figure 5.15 – Maximum displacements for three PGA values and for both interface models at the dams toe ... 68
xiv
Figure 5.17 - Shear sliding displacement at the toe of dam model 2 ... 68
Figure 5.18 - Time history of shear displacement and normal stress at the heel of dam model 1 ... 69
Figure 5.19 – Dam model 1: Water pressure along the dam base for different interface models and different interface normal stiffnesses ... 72
Figure 5.20 – Dam model 2: Water pressure along the dam base for different interface models and different interface normal stiffnesses ... 72
Figure 5.21 – Dam model 1: Normal effective stress distribution along the dam/foundation interface for different interface models and different normal stiffnesses ... 73
Figure 5.22 – Dam model 2: Normal effective stress distribution along the dam/foundation interface for different interface models and different normal stiffnesses ... 73
Figure 5.23 – Dam model 1: Horizontal displacement at the crest of the dam ... 74
Figure 5.24 – Dam model 1: Shear sliding displacement at the heel of the dam ... 74
Figure 5.25 – Dam model 1: Shear sliding displacement at the toe of the dam ... 75
Figure 5.26 – Dam model 2: Horizontal displacement at the crest of the dam ... 75
Figure 5.27 - Dam model 2: Shear sliding displacement at the heel of the dam ... 75
Figure 5.28 - Dam model 2: Shear sliding displacement at the toe of the dam ... 76
Figure 5.29 – Maximum shear displacement at the toe of dam model 1 ... 76
Figure 5.30 - Maximum shear displacement at the toe of dam model 2 ... 76
Figure 5.31 – Elastic foundation (1) shear displacement at the heel of the dam for Rayleigh damping and mass proportional damping ... 78
Figure 5.32 - Non-linear fractured foundation (2) shear displacement at the heel of the dam for Rayleigh damping and mass proportional damping ... 78
Figure 5.33 - Elastic foundation (1) shear displacement at the toe of the dam for Rayleigh damping and mass proportional damping ... 79
Figure 5.34 - Non-linear fractured foundation (2) shear displacement at the toe of the dam for Rayleigh damping and mass proportional damping ... 79
Figure A.1 - Model geometry of a cantilever ... 87
Figure A.2 - Cantilever numerical model ... 88
Figure A.3 - Displacement-time response ... 90
xv
Figure A.5 - Frame numerical model ... 94
Figure A.6 - Interface between the pillar and the beam ... 94
Figure A.7 - Two models for the beam connection ... 95
Figure A.8 - Stress field in the x direction... 97
Figure A.9 - Model geometry ... 98
Figure A.10 - Numerical models of the horizontal discontinuity and the blocks ... 100
Figure A.11 - Deformed shape of the blocks (magnified 1000 times) ... 101
Figure A.12 - Water pressure variation along the horizontal interface for the three models ... 102
Figure A.13 - Hydraulic aperture variation along the horizontal interface for model 1 ... 103
xvii
LIST OF TABLES
Table 3.1 - Mechanical characteristics for the dam model ... 35
Table 3.2 - Mohr-Coulomb constitutive law ... 36
Table 3.3 - Hydraulic characteristics of each material assigned to the interfaces ... 36
Table 5.1 – Depth of the grout curtain and drainage boreholes ... 56
Table 5.2 – Mechanical and hydraulic data ... 57
Table 5.3 – Normal and shear stiffnesses of the interfaces between materials ... 57
Table 5.4 - Mechanical properties of the materials ... 57
Table 5.5 – Hydraulic properties of the seepage channels ... 58
Table 5.6 – Fundamental frequency ... 59
Table 5.7 – Minimum and maximum displacement and stresses for different peak ground
accelerations for dam model 1 ... 70
Table 5.8 - Minimum and maximum displacement and stresses for different peak ground
accelerations for dam model 2 ... 70
Table 5.9 – Minimum and maximum safety factors and stresses for different peak ground
accelerations for dam model 1 ... 71
Table 5.10 - Minimum and maximum safety factors and stresses for different peak ground
accelerations for dam model 2 ... 71
Table A.1 - Mechanical characteristics considered for the cantilever ... 88
Table A.2 - Displacement at the free end of the cantilever ... 90
Table A.3 - Results of the natural frequency for the cantilever ... 90
Table A.4 - Normal and shear stiffness of the interfaces ... 93
Table A.5 - Mechanical characteristics considered for the frame... 93
Table A.6 - Displacement solutions at mid-span of the beam ... 96
Table A.7 - Stress solutions at mid-span of the beam ... 96
Table A.8 - Material properties ... 99
Table A.9 - Normal and shear stiffnesses of the interfaces ... 99
xix
LIST OF SYMBOLS
[C] damping matrix [-]
[K] stiffness matrix [-]
[M] mass matrix [-]
a fracture aperture [L]
A cross section area [L2]
ah hydraulic aperture [L]
Ai area of the influence of the nodal point [L2]
amax maximum hydraulic aperture [L]
amin minimum hydraulic aperture [L]
ao fracture aperture free of normal stresses [L]
b width [L]
C cohesion [L-1MT-2]
c damping constant [-]
Ccr critical damping [-]
Cp pressure wave propagation velocity through a continuous medium [LT-1]
Cs shear wave propagation velocity through a continuous medium [LT-1]
E Young’s modulus [L-1MT-2]
f frequency [T-1]
Fint internal forces [LMT-2]
g acceleration of gravity [LT-2]
G shear modulus [L-1MT-2]
H height of the reservoir [L]
h dam height [L]
xx H2 function of the dam height [L]
i two-dimensional hydraulic gradient [LL-1]
I moment of inertia [L4]
K foundation bulk modulus [L-1MT-2]
k permeability factor [L2]
kce seepage channel permeability factor [LM-1T]
kf fractured hydraulic conductivity [LT-1]
kn interface normal contact stiffness [L-2MT-2]
ks interface shear contact stiffness [L-2MT-2]
kw water bulk modulus [L-1MT-2]
l length [L]
m mass [M]
M bending moment [M L2 T-2]
mi mass associated with nodal point i [M]
p applied uniform load [M L-1 T-2]
q flow rate per unit length [L3T-1]
Q flow rate [L3 T-1]
R function of the safety factor [L-1MT-2]
s seconds [T]
sf safety factor [-]
t time [T]
un joint normal displacement (aperture and closing) [L]
v velocity of the fluid in a certain point, velocity [LT-1]
v hist history value velocity [LT-1]
v p pressure wave velocity [LT-1]
xxi v s shear wave velocity [LT-1]
yi elevation [L]
z distance from a compressed or tensioned fiber to the neutral axis [L]
α mass proportional damping ratio [-]
αfr viscous boundary damping ratio [-]
β stiffness proportional damping ratio [-]
γc unit weight of concrete [L-2MT-2]
γr unit weight of the rock mass foundation [L-2MT-2]
γw unit weight of the water [L-2MT-2]
δ displacement [L]
Δa variation in the aperture [L]
Δt timestep [T]
θ inclination of the upstream face of the dam [-]
ν k kinematic viscosity of the fluid [L2T-1]
ξ relative damping ratio [-]
ρ density [L-3M]
ρc concrete density [L-3M]
ρf foundation density [L-3M]
ρw water density [L-3M]
σ stress [L-1MT-2]
σ0 function of the safety factor [L-1MT-2]
σc compressive stress [L-1MT-2]
σi principal stress “i“ [L-1MT-2]
xxii
σ'n effective normal stress [L-1MT-2]
σt tensile stress [L-1MT-2]
τ shear stress [L-1MT-2]
τref reference shear stress [L-1MT-2]
υ Poisson’s ratio [-]
Φ total head, hydraulic potential, hydraulic head, piezometric head, head [L]
φ friction angle [-]
ω fundamental natural frequency [T-1]
OFFICIAL BODIES
APA Agência Portuguesa do Ambiente
DBB Departamento de Barragens de Betão
EDP Energias de Portugal
FCT/UNL Faculdade de Ciências e Tecnologia da Universidade Nova de Lisboa
ICOLD International Commission on Large Dams
INAG Instituto da Água
LNEC Laboratório Nacional de Engenharia Civil
NOVA.ID.FCT Associação para a Inovação e Desenvolvimento da FCT
ABBREVIATIONS
2D 2 dimensions
3D 3 dimensions
CE construction earthquake
DBE design basis earthquake
xxiii
FEM finite element method
HN hydraulic node
JE joint element
MC Mohr-Coulomb
MCE maximum credible earthquake
MDE maximum design earthquake
OBE operating basis earthquake
PGA peak ground acceleration
PSHA probabilistic seismic hazard analysis
RCC roller-compacted concrete
SC seepage channel
1
1
INTRODUCTION
1.1
Background
Dams are built on rivers or water streams with the purpose of storing water. The need to construct dams all over the world is not recent and goes back 5 000 years, proving to be a necessary element for populations to adapt and improve their quality of life. However, more than half of the dams that exist today were built in the past 50 years due to the steadily increasing demand for water resources and to technology advances (INAG, 2001).
According to the International Commission on Large Dams (ICOLD), the world population has increased by a factor of 8 in the past century and the demand for water resources naturally followed this tendency. Moreover, hydropower production which is generated without polluting the atmosphere is a major advantage that pushes technology advances for dams.
A dam with a height greater than 15 metres measured from the lowest foundation to the crest, or a dam between 5 and 15 metres high with a reservoir storage of more than 3 million cubic metres is considered a large dam (ICOLD, 2017). When a large dam is constructed, it can be a single-purpose or it can be a multi-purpose dam. Nowadays, according to ICOLD, there are 28 614 single-purpose large dams and 9 930 multipurpose large dams. Irrigation accounts for almost 50 % of the single purpose dams, but hydropower, water supply and flood control are among other main purposes for a dam (ICOLD, 2017). Figure 1.1 shows the distribution for each purpose of single-purpose dams and the distribution for purposes of multipurpose dams.
2
a) Single-purpose dams b) Multi-purpose dams
Figure 1.1 – Single-purpose and multi-purpose dams’ distribution
Concrete and masonry dams have their foundations in rock masses, which are made of rock blocks separated by discontinuities that result from natural events. Thus, the foundation structure is discontinuous, anisotropic and heterogenous. Rock masses on which dams are built are usually treated with the purpose of improving their mechanical and hydraulic characteristics.
3
a) Grande Dixence dam
(www.swissinfo.ch/eng)
b) Jinping 1 dam
(www.chinadaily.com.c
n)
c) Roselend dam
(www.structurae.net)
4
The mechanical and hydraulic behaviors are not independent: alterations in the stress state of the rock mass lead to the opening or closing of the dam foundation discontinuities, changing the paths through where the water flows. At the same time, these alterations in the hydraulic behavior change the stress field.
Although there are no recorded life losses so far following a concrete dam’s failure caused by an earthquake, there are several reports of local cracks that reduce the structure safety. Consequently, seismic action must be taken into account when designing new dams as well as when reassessing the safety of operating dams.
The study of the coupled hydromechanical behavior taking into account hydrodynamic components requires numerical tools with a certain degree of complexity. In addition to being necessary the use of heavy calculation programs, it is required to fully know the mechanical and hydraulic characteristics of the rock mass, as well as its geometry, which can be very difficult to characterize due to its heterogeneity. Therefore, it is not easy to develop a realistic model. To evaluate the seismic action, data from a real earthquake is required, such as velocity or stress history records, in order to simulate the structural response.
The numerical models used to perform seismic stability evaluation of dams can be of two types: continuum equivalent models or discontinuous models. The main difference between these two approaches is the representation of the rock mass discontinuities. The choice between the continuum or discontinuum approach depends on many specific factors, namely the joint pattern, the spacing of the discontinuities and their influence on the overall behavior. These two distinct types of models may be combined and used simultaneously.
5
1.2
Objectives and methodology
The main objective of this research is to assess the stability of a concrete gravity dam for a shear sliding failure scenario under the maximum design earthquake (MDE) loading, taking into account the coupled hydromechanical behavior of the dam foundation.
The numerical investigation is carried out with two dams of different height and foundations with the same joint pattern. The effect of the dam/foundation interface stiffness on shear sliding displacements is evaluated. The results obtained using two different damping approaches are discussed and compared.
1.3
Thesis outline
7
2
GRAVITY DAMS
Gravity dams, as previously mentioned, are one of the main types of concrete or masonry dams, along with buttress and arch dams. The studies in this thesis focus only on the behavior of concrete gravity dams during an earthquake.
In the case of concrete gravity dams, the seismic evaluation should consider the maximum design earthquake, MDE, and the possibility of sliding along the dam/foundation interface. The structural behavior and the main failure causes of these constructions are presented. In addition, the safety aspects for concrete gravity dams against earthquakes considered at the design stage and during the dam operation are mentioned. A reference is made to the monitoring plans designed for structural safety control during the dam’s life span and to emergency plans in case of failure. Lastly, a brief description of the visit to Pocinho dam is presented.
2.1
Structural stability
Gravity dams are designed and built to rely entirely on their self-weight to balance the pressure on the dam caused by the water stored in the reservoir, transferring the actions to the foundation. The typical cross section of a gravity dam is a triangle and the base width is, normally, 80 % of the height, as shown in Figure 2.1 (INAG, 2001).
In plan, gravity dams can be straight or with a slight curvature. Gravity dams are suited for wide valleys and require sound rock masses as foundation. The first gravity dams were constructed with masonry blocks, but since the 19th century their main material is mass concrete or roller compacted
concrete, RCC.
8
Figure 2.1 - Gravity dam. Typical cross section (adapted from INAG, 2001)
Figure 2.2 – Main forces acting on a concrete gravity dam (adapted from www.hydroworld.com)
When designing and assessing the safety of a gravity dam, it is very important to ensure safety against sliding. On the contrary, overturning around a left abutment/right abutment axis is not usually considered. Nevertheless, earthquakes can cause sliding of a gravity dam and high tensile stresses may build up close to the crest of the dam.
9
a magnitude of 7.9 in the Richter scale. Due to the earthquake, around 69 000 people were killed, 80 % of the city buildings were destroyed and 403 hydropower plants were damaged. The Committee on Seismic Aspects of Dam Design of ICOLD has recently addressed the state of the seismic design and safety aspects of large dams (Wieland, 2016; ICOLD, 2016).
2.2
Main failure causes
The main problems that can occur in gravity dams are:
i) lack of shear resistance in the dam/rock mass foundation interface or in the rock mass discontinuities;
ii) loss of connection to the rock mass foundation due to high tensile stresses;
iii) high quantities of water that flow through the dam foundation.
In a rock mass, failure is frequently controlled by the presence of discontinuities such as faults, shear zones, bedding planes and joints (Hoek, 2017). Due to lack of shear resistance of the discontinuities, deformation and failure are caused by sliding along individual discontinuity surfaces or along other planes such as the interface between the dam and the rock mass. The failure of the intact rock is rarely a problem. Because the area of the interface between the dam and the rock mass is very large, the uplift pressure is substantial, acting as an opposite force to the self-weight. The water pressure at the upstream face of the dam can also be harmful to the dam if the construction joints in the dam’s body are, by some reason, altered.
The loss of connection with the foundation at the heel of the dam is a problem that can occur in concrete gravity dams. The hydrostatic pressure on the upstream face of the dam transmits tensile stresses to the heel of the dam and to the rock mass foundation. The cycle of filling and emptying a reservoir creates stresses and deformation cycles in the foundation, opening and closing horizontal and sub-horizontal discontinuities, eventually producing new cracks and increasing the length of the existent ones.
10
Weathering processes due to erosion and dissolution actions in rock masses normally leads to the loss of strength of the foundation, ultimately causing the failure of a dam. Another factor that underlines the importance of the rock mass foundation of a dam is the lack of shear resistance in rock masses along weak planes of unfavorable direction.
The first filling of a reservoir corresponds to the first loading test of a dam. Therefore, it is extremely important to follow the structural behavior during this phase. As an example, the Austin dam in Austin, Pennsylvania, USA, collapsed in January 1911 due to a structural failure with foundation sliding during unusually heavy rains. The dam was 15 m high and 165 m long and was constructed on horizontally bedded sandstone with interbedded layers of shale and disintegrated sandstone. The failure occurred when the foundation slid in one of its weaker layers (Anderson et al., 1998). Figure 2.3 shows Austin dam after the accident.
Figure 2.3 - Austin dam ruins (pabook2.libraries.psu.edu/palitmap/AustinDam.html)
2.3
Dam safety against earthquakes
11
When selecting the seismic parameters, the type of dam and the possible modes of failure must be considered, along with the site hazard and the structure risk rating (Bozovic, 1989). In the case of gravity dams, both stress and stability assessments need to be performed, as well as additional assessments related to appurtenant structures, foundation and reservoir bank (Darbre, 2004).
Several types of analysis can be performed, either preliminary or more elaborate. For straight concrete gravity dams, a two-dimensional model is generally sufficient for a simplified analysis. For a more complex analysis, a finite element method (FEM) analysis is usually performed, which for the case of gravity dams, can also be planar. Dynamic finite element response analyses may be performed using either response spectra or acceleration time histories. If linear elastic behavior is assumed, both procedures are considered appropriate. However, if non-linear analysis is contemplated, acceleration time histories must be used exclusively (Darbre, 2004).
12
Figure 2.4 - Koyna dam view (adapted from http://indianexpress.com/article/india/studying-seismic-activity-epicentre-zone-shifting-towards-warna-reservoir-4950512/)
The two main goals of every safety concept for large storage dams and infrastructure projects are the minimization of all risks and the mastering of the remaining risk in the best conceivable way. Therefore, for sustainable storage dams emphasis must be placed on the long-term safety of the dam. To reach these goals, a comprehensive safety concept is adopted, comprising the following key elements (Wieland, 2012):
i) structural safety;
ii) dam safety monitoring;
iii) operational safety;
iv) emergency planning.
A brief review of each of these items is presented below.
2.3.1 Structural safety
13
environment and project and site-specific hazards. The design must be carried out assuming the dam may become exposed to the worst possible scenarios.
In the past, the seismic coefficient used to represent ground shaking had no clear physical relation to the design ground motions and the seismic hazard at the dam site. The dynamic response was not correctly determined because it was based in a pseudo-static analysis (Wieland, 2012). Today the seismic design criteria, last revised in 2010 by ICOLD, are clear and methods of dynamic analyses have been developed which allow the calculation of the inelastic seismic response of concrete dams (Wieland, 2014).
2.3.2 Dam safety monitoring
Dam safety monitoring is a key activity in dam safety management and includes two main activities:
i) visual inspections of the entire dam and appurtenant structures;
ii) monitoring of different physical quantities such as deformations, pressure, flow and temperature.
The monitoring data is used to assess the status of both the dam and its foundation. Monitoring includes both the equipment and the methodologies used to collect and collate the data.
The main advantage of monitoring is that it provides a rational insight into the safety of the dam-foundation system. Modern automatic data acquisition systems allow real-time developing deficiencies and rapidly changing conditions to be timely detected. Piezometers, plumb lines, foundation extensometers and seepage weirs are some examples of equipment usually installed in large dams to measure the structure’s response. It is also necessary to install equipment to measure external data such as hydrostatic pressure, meteorological parameters and seismic events.
14 2.3.3 Operational safety
The importance of operational safety of dams is still overlooked and often seen as not fundamental. When it comes to long-term safety, maintenance is the key factor and it includes operational guidelines for the reservoir for the usual, unusual and extreme conditions, training of personnel, experienced and technically qualified dam maintenance staff and dam maintenance procedures. If a dam designed for 100 years is not maintained, it can become unsafe within a very short period of time (Wieland, 2014).
2.3.4 Emergency planning
In the emergency planning concept, it is assumed that every dam can fail or be destroyed. Therefore, the consequences of a dam failure causing an uncontrolled release of water from the reservoir must be analysed. The main objective of emergency planning is to save lives by alarming and evacuating people on time (Wieland, 2016).
The worst failure case of a dam is with a full reservoir. Extreme flood events with overtopping of the dam and extreme water levels downstream of the dam may also be a dangerous scenario. No failure probabilities are considered for these scenarios. The safety-relevant elements of a dam are spillway gates and bottom outlets which must be operational after an earthquake in order to control the water level in the reservoir so that, in case of damage, the dam can be repaired and/or strengthened (Wieland, 2012).
Emergency Action Plans (EAP) are intended to help dam owners, operators and emergency officials to minimize the consequences of flooding or the uncontrolled release of water from the reservoir. The EAP will guide the responsible personnel in identifying, monitoring, responding to and mitigating emergency situations, answering questions like “who does what, where, when and how”. The EAP should be updated regularly and after important emergency events (Wieland, 2014).
2.4
Seismic hazard
Earthquakes can cause multiple hazards in large storage dam projects, such as:
15
• fault movements in the dam foundation or discontinuities in the dam foundation near major faults which can be activated during strong nearby earthquakes, causing structural distortions;
• fault displacement in the reservoir bottom, causing water waves in the reservoir;
• rockfalls with large rocks causing damage to gates, spillway piers, retaining walls, surface powerhouses, electro-mechanical equipment, etc.;
• mass movements into the reservoir causing impulse waves, increase of the reservoir level and overtopping of dams;
• project and site-specific hazards (ground deformations, seepage, liquefactions, etc.)
The main seismic hazard addressed in codes and regulations is the earthquake ground shaking, which can cause stresses, deformations, cracking, sliding and overturning in the dam’s body (Wieland, 2016). However, movements in a joint of a concrete dam can be more critical than ground shaking, as any of these movements would cause a complicated crack pattern, which cannot be reliably predicted in numerical models.
Every time a strong earthquake occurs, the design guidelines have to be reviewed as new phenomena appear, which may have been overlooked. Usually, seismic hazard analyses are only concerned with the estimation of ground motion parameters such as peak ground acceleration (PGA) and response spectrum. Ground motion parameters can be determined by a probabilistic and/or deterministic seismic hazard analysis (Wieland, 2012).
2.5
Seismic design criteria
The following design earthquakes are needed for the seismic design of the different structures and elements of a large dam project (Wieland, 2016): safety evaluation earthquake (SEE), design basis earthquake (DBE), operating basis earthquake (OBE) and construction earthquake (CE).
16
• The DBE, with a return period of 475 years, is the reference design earthquake for the appurtenant structures. The DBE ground motion parameters are estimated based on a probabilistic seismic hazard analysis (PSHA).
• The OBE is expected to occur during the life span of a dam and no loss or damage of service should happen. It has a probability of happening of about 50 % during a service life of 100 years. The ground motion parameters are also estimated based on a PSHA.
• The CE is to be used for the design of temporary structures such as coffer dams and takes into account the service life of these temporary structures.
The SEE ground motion can be obtained from a probabilistic and/or deterministic seismic hazard analysis:
• The maximum credible earthquake (MCE) is the event that produces the largest ground motion expected at the dam site based on the seismic history and the seismotectonic setup in the region. It is estimated based on deterministic earthquake scenarios.
• The maximum design earthquake (MDE) is used in the analysis presented in this thesis and the ground motion parameters are estimated on a PSHA. For large dams, the return period is taken as 10 000 years but for smaller, more limited damage potential, shorter return periods can be specified.
The different design earthquakes are characterized by the PGA horizontal and vertical components and the acceleration response spectra of horizontal and vertical earthquake components, typically for 5 % damping and obtained from the PSHA (mean values) for the MDE. In case of fault movements, similar seismic parameters are required but it is quite difficult for a dam designer to obtain quantitative estimates because the seismic analyses are mainly concerned with ground shaking.
2.6
Visit to Pocinho dam
17
system. Specialty and exceptional visits involve the dam owner, the authority (APA – Agência Portuguesa do Ambiente) and LNEC, as an external consultor of the authority. Routine visual inspection visits are usually carried out monthly, specialty visits every two years and exceptional visits only after a flood, an earthquake or when there is an emptying and subsequent filling of the reservoir. The main purpose of these visits is to search for eventual signs of deterioration and to check if the observation system is working properly.
While developing this thesis, it was possible to follow a specialty inspection visit to Pocinho dam. The visit took place in the beginning of February of 2018.
Pocinho dam is a concrete gravity dam located on the river Douro national section. The main purposes of the dam are production of energy and navigation. Figure 2.5 shows a scheme of location and storage capacity of the different dams in the river Douro drainage basin, where Pocinho dam is highlighted.
The project of the dam was finished in 1974 and work was concluded in 1982. The developer of the construction was EDP – Energias de Portugal.
18
Figure 2.5 – Dams in river Douro drainage basin
Figure 2.6 - Upstream and downstream views of Pocinho dam
The dam is 49 m high and the total length of the crest is 430 m. In the crest there is a road that connects both banks. The dam has also an auxiliary half-bottom spillway. The normal top water level is 125.5 m and the maximum water level is 134.5 m. Figure 2.7 shows the dam cross-section.
River Tâmega
River Douro
River Paiva
River Paiva
River Côa River Távora
River Varosa
19
Figure 2.7 - Cross-section of Pocinho dam
(http://cnpgb.apambiente.pt/gr_barragens/gbportugal/Pocinhodes.htm)
During the visit it was possible to walk through the inspection galleries and observe different monitoring equipment installed in the dam. This equipment allows measurement data to be taken, such as displacements, movements of cracks, movement of the dam joints or volume of drained water. This data is stored in an informatic system called GestBarragens that allows the engineers responsible to review the safety of the dam to analyse its behavior. Some of the equipment observed during the visit were piezometers installed upstream and downstream of the drainage curtain to measure the water pressure and its variation over time, plumb lines and inverted plumb lines that measure the horizontal displacement in two orthogonal directions, foundation extensometers that allow measurement of the relative displacement between two pre-defined points. According to the current protocol, in the end of the visit a meeting took place with all the entities responsible for the safety of the dam (APA, EDP and LNEC) to further analyse the results.
20
a) Inspection gallery in Pocinho dam b) Gallery close to the dam foundation
c) Plumb line in Pocinho dam d) Piezometer installed upstream from the
drainage curtain in Pocinho dam
21
3
HYDROMECHANICAL BEHAVIOR OF CONCRETE DAM
FOUNDATIONS
3.1
Hydromechanical interaction
The mechanical and hydraulic processes in rock masses are interdependent. Changes in the water flow influence the mechanical behavior due to variations in seepage forces and in the hydraulic uplift. Changes in these mechanical loads cause changes in the stress field of the rock mass, generating deformations. These deformations, in turn, cause variations in permeability hence changes in water flow. This is called a coupled hydromechanical process.
With the purpose of understanding the hydromechanical behavior of concrete dam foundations it is essential to understand how fluid flows through rock joints. This complex phenomenon has been the subject of extensive research since the 1960’s (Snow, 1965; Louis & Maini, 1970 and Brown, 1987). The most commonly applied conceptual model and the one considered in this work is the parallel plate model. This model is made to describe the flow in a void space (without filling material) between two parallel smooth plates (Louis, 1969).
For a steady state laminar incompressible flow in such fracture geometry, the solution for the mean velocity is given as:
𝒗 = 𝒌𝒇 𝒊 (3.1)
where i [m/m] is the hydraulic gradient and 𝑘𝑓 [m/s] is the fracture hydraulic conductivity, given
by:
𝒌𝒇 = 𝒂 𝟐𝒈 𝟏𝟐𝝂𝒌
(3.2)
where a [m] represents the fracture aperture and 𝜈𝑘 [𝑚2/s] is the kinematic viscosity of the fluid.
22
𝒒 = 𝒗 𝒂 =𝒂𝟏𝟐𝒗 𝒊𝟑𝒈 (3.3)
According to this cubic law, the flow of parallel-plate openings is proportional to the cube of the aperture, meaning that it is extremely sensitive to a variation in the aperture.
Laboratory experiments have shown that the roughness and the aperture of a rock joint are the key factors governing fluid flow through a joint (Barton & de Quadros, 1997). The cubic law based on the parallel plate model considers only the influence of the aperture because of the impossibility of measuring the roughness parameter directly in a flow process. However, some studies were carried out trying to establish whether the parallel plate model is adequate for prediction of flow in natural fractures. Some authors have introduced an additional empirical correction factor that considers fracture roughness.
Barton, Bandis, & Bakhtar, (1985) suggested that a rock fracture has both a mechanical and hydraulic aperture. The mechanical joint aperture (a) is defined as the average point-to-point distance between two rock joint surfaces, perpendicular to a selected plane, as shown in Figure 3.1. A single average value can be used to define the aperture, but it can also be described stochastically. The aperture distribution of a joint is only valid at a certain state of rock stress and pore pressure. The mechanical aperture is usually determined from a two-dimensional, (2D) joint section, which is only a part of the real tridimensional (3D) surface and is geometrically measured with epoxy injection. The hydraulic aperture (ah) is measured by analysis of the fluid flow and can be
determined both from laboratory fluid-flow experiments and borehole pump tests in the field (Olsson & Barton, 2001).
Figure 3.1 - Definition of mechanical aperture
23
The values of these model parameters may be calibrated in order to obtain water pressures and flows close to those recorded in situ. When the joints of a rock mass are highly compressed, the value of 𝑎𝑚𝑖𝑛 is used, ensuring it is always possible to calculate a residual permeability. For very high values of hydraulic aperture, 𝑎𝑚𝑎𝑥 is used in order to limitate the joint permeability up to a maximum value. Figure 3.2 is the graphical representation of the physical meaning of the three input model parameters that define the hydraulic aperture.
Figure 3.2 - Hydraulic aperture
According to the scheme presented in the code program UDEC (Itasca, 2004), and in the program Parmac2D-FFlow (Monteiro Azevedo & Farinha, 2015, Monteiro Azevedo, Bretas, & Lemos, 2012), used in this work, the hydraulic aperture associated with each integration point (far points of each SC) is given by:
𝒂𝒉=
{ 𝒂𝒎𝒊𝒏
𝒖𝒏+ 𝒂𝟎
𝒂𝒎𝒂𝒙
If 𝒖𝒏+ 𝒂𝟎< 𝒂𝒎𝒊𝒏
If 𝒂𝒎𝒊𝒏 ≤ 𝒖𝒏+ 𝒂𝟎≤ 𝒂𝒎𝒂𝒙
If 𝒖𝒏+ 𝒂𝟎> 𝒂𝒎𝒂𝒙
(3.4)
3.2
Concrete dam foundations
24
foundation treatment. Such detailed programs are conducted for one or more of the following reasons (Wyllie & Mah, 2004):
• The consequences of failure of a dam are usually very severe and can result in loss of life and property damage;
• The loads on dams can be higher than other structures and non-vertical;
• The loads are cyclic due to fluctuations in the reservoir level and the foundation must be able to withstand these changing stress conditions;
• High hydraulic gradients and water pressures are developed in the dam foundation.
Rock masses where concrete dams are built are discontinuous, heterogeneous and anisotropic. A foundation treatment is normally performed for large dams. This treatment consists in: i) consolidation grouting; ii) grout curtains; iii) drainage systems. The main objective of this treatment is to improve both the mechanical and hydraulic characteristics of the rock mass.
Consolidation grouting strengthens the uppermost strata of the foundation rock mass, that due to excavation works and initial loading is more fractured and altered than the rock mass at higher depth.
Seepage through the rock mass in a concrete dam foundation is a crucial factor. In the context of a project, the uplift pressures must be acceptable. By reducing the uplift pressures, the effective stresses are greater, consequently leading to increased safety. For economic reasons, it is also necessary to guarantee low values of percolated flow.
25
The uplift pressure is a result of the presence of water in the dam’s foundation. Its effect is contrary to the equilibrium effect of the dam’s own-weight. As a way of reducing the uplift pressure values, drainage curtains are built. The drainage curtain is usually a line of boreholes drilled downstream of the grout curtain and, as a general rule, its length is one third to half of the grout curtain. The main objective is to collect and control seepage under the dam. Drainage boreholes are drilled after the grouting of the curtains is complete to avoid the filling of the holes with grout. The boreholes are usually located 3 m apart and their diameter is usually 76 mm. The drain boreholes can be uncoated, if the rock mass where they are drilled is sound rock, or coated with perforated plastic casing when the rock mass is fractured, to allow the hole opening and avoid the rock becoming loose from the hole walls. Figure 3.3 presents a gravity dam cross section, indicating the location of both the grout curtain and the drainage system.
Figure 3.3 - Gravity dam cross section, indicating the location of grout curtain and drainage system (http://www.icold-cigb.net/GB/dams/dams.asp)
26
Figure 3.4 – Uplift pressure diagram in a concrete gravity dam without and with drainage system
3.3
Numerical modelling
3.3.1 Continuum equivalent and discontinuum models
To simulate the complex hydromechanical coupled behavior of fractured rock masses, it is possible to replicate the dam’s foundation using continuum equivalent models or considering the rock mass fracture networks. The choice between continuum or discontinuum models depends on many case-specific factors, but the main one is the size and spacing of the discontinuities, when compared to the size of the problem.
In equivalent continuum models, the rock mass physical behavior needs to be properly represented by adjusting the materials’ properties. To simulate the fluid flow in the foundation, different rock mass areas are identified and the local equivalent permeability is estimated by in-situ Lugeon type tests. The seepage forces induce deformations in the continuous medium, which in turn alters the permeability. This type of analysis requires correlations between stress or strain and permeability to be previously established (Farinha, 2010).
27 3.3.2 Discontinuum analysis with Parmac2D-FFlow
Because rock masses are naturally discontinuous, they may be modelled using the discrete element method. In the discrete element method, blocks interact between each other, representing the rock mass discontinuities. The mechanical characteristics of the model depend not only on the element properties, such as Young’s modulus or Poisson’s ratio, but also on the interface properties, such as the normal and shear stiffnesses, the friction angle, the cohesion and the maximum resistance to tensile and compressive stresses. In the case of non-linear analysis, the model’s behavior is ruled by the interface properties (Bretas, 2012). These properties follow a given constitutive model. The one adopted in this thesis is the Mohr-Coulomb constitutive law with a tensile cut off (Figure 3.5).
As a pre-processing tool, the block generation modulus of the program UDEC (Itasca, 2004) is used to define the block system of the different model examples presented in this work. UDEC is a bi-dimensional numerical code which simulates discontinuous media such as rock masses under static or dynamic actions. The domain is represented as a block system, where a rigid or deformable behavior can be adopted, and the discontinuities are the boundary conditions between blocks.
Figure 3.5 - Mohr-Coulomb constitutive law for the interfaces (adapted from Bretas, 2012)
28
stress/displacement field modelling. However, the model requires a thorough pre-processing stage in order to ensure that the interactions between the blocks are always edge to edge.
3.3.2.1 Mechanical model
The mechanical model used in Parmac2D-FFlow is a model of discrete nature and uses an explicit solution algorithm based on the centered difference method, Monteiro Azevedo, (2003). It is possible to take into account the deformability of the blocks by, after dividing the domain into several blocks, divide internally every block into a mesh of triangular shape elements. Figure 3.6 shows the calculation cycle of the explicit mechanical model.
Figure 3.6 - Calculation cycle of the mechanical model
In this work, the interaction between blocks is done by edge-to-edge joint finite element methods which require each block’s finite element mesh to be compatible and are in general adequate for small displacement analysis. Farinha, Monteiro Azevedo, & Candeias, (2017) show that the hypothesis of small displacements is valid for the analysis of the seepage-stress coupled behavior of concrete dam foundations and for stability analysis in both static and dynamic conditions. In the joint finite elements, as there is perfect compatibility of the displacement field along the interfaces, a more accurate representation of the stress distribution along the joints is obtained compared to the solutions obtained with traditional discrete elements with similar discretization.
29
Figure 3.7 - Joint element model (Monteiro Azevedo & Farinha, 2015)
As previously mentioned, it is necessary that the internal finite element mesh of each block is compatible, in order to ensure that the interactions are always edge-to-edge. To achieve this, it is necessary to implement a pre-processing procedure that guarantees that each edge of a block coincides with an edge of the adjacent block.
3.3.2.2 Hydraulic model
The hydraulic model is compatible with the mechanical model (Figure 3.8 a) because, as the processing operation generates a perfectly compatible mesh of plane triangular elements, the hydraulic nodes (HNs), represented in Figure 3.8 b), coincide with the nodal points from the mesh which have the same coordinates at the beginning of the numerical analysis and the seepage channels of the hydraulic model (SC), Figure 3.8 b), coincide with the midplane of the joint elements. Throughout the calculation process moving occurs and the changes for the nodal points from its initial position to the new one is only possible thanks to the independent mechanical behavior of the nodal points.
30
a) Mechanical model
b) Hydraulic model: hydraulic nodes (HNs) and seepage channels (SC)
c) Hydraulic model: pressures on the hydraulic nodes (P) and discharges in seepage channels (Q)
Figure 3.8 - Superposition of hydraulic and mechanical models
31
The hydraulic aperture (𝑎ℎ) is defined at the seepage channel endpoints. As each SC coincides with a joint element (mechanical model), the joint normal displacement (𝑢𝑛) at the integration points (two Lobatto points at the joint end points) is also known.
At each timestep, taking into account the relative position of the blocks, the mechanical apertures of the joint are known. From these values it is possible to know the hydraulic aperture, the hydraulic conductivity in the SC, the hydraulic head (Φ) and the discharge. Knowing the discharges calculated in each SC, it is possible to establish the discharge associated with each HN so that the new water pressure at the nodes is obtained. Figure 3.9 shows the hydraulic calculation cycle.
Figure 3.9 - Hydraulic calculation cycle
3.3.2.3 Hydromechanical model
32
model. The water pressures are then transferred to the mechanical model and considered in the calculation of the internal forces at the joint elements representing the discontinuities (effective stresses). The hydromechanical calculation cycle is presented in Figure 3.10.
When only a steady state equilibrium position is required, a unitary timestep is adopted on both domains. As a way to guarantee numerical stability, the hydraulic volumes associated with the hydraulic nodal points and the masses associated with the nodal points of the mechanical model are scaled accordingly.
Figure 3.10 - Hydromechanical calculation cycle
3.4
Hydromechanical behavior of gravity dam foundations
As an example of the possible results and analyses performed in Parmac2D-FFlow, a gravity dam was analysed. The water pressure distribution along the dam/foundation interface and the nodal horizontal displacement at the dam upstream face is represented.
The results obtained were compared for different water levels downstream from the dam for:
i) linear elastic analysis and non-linear elastic analysis based on a Mohr-Coulomb constitutive law with a tensile cut-off criterion;
33 3.4.1 Geometry
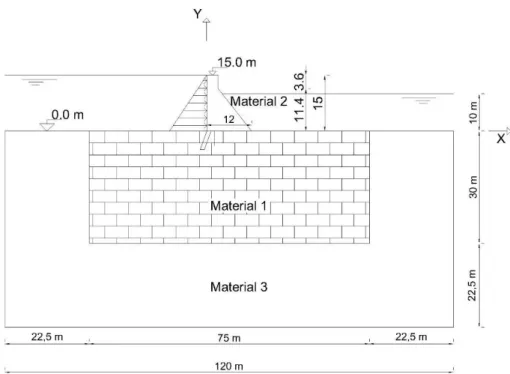
Figure 3.11 presents the geometry of the model used in this example and in the examples presented in chapter 5, to numerically model the foundation. Is this figure, H represents the height of the dam and l is the length of the crest. The initial block model geometry including the foundation discontinuities was generated in UDEC.
Figure 3.11 – Model geometry: dam and foundation
The grout curtain, when considered, starts at the heel of the dam and its width is approximately 1/11 of the dam height. The inclination of the grout curtain is 70º towards upstream and its depth is 0.55 H2, where H2 is the height of the dam minus 2 m, considering the top water level. The drainage
curtain is situated at 1/6 H from the heel of the dam and at a depth of 0.3 H2.
34
Figure 3.13 shows the geometry of the model, considering now the grout curtain and the drainage boreholes. Figure 3.14 presents the same geometry of the dam’s structure, considering there is water downstream from the dam, with a level equal to 10 m.
Figure 3.12 – Model geometry of the dam
35
Figure 3.14 - Model geometry of the dam considering a water level downstream from the dam
3.4.2 Material properties
The fractured rock mass foundation is assigned to material 1, the body of the dam is assigned to material 2 and the homogeneous and continuum foundation is assigned to material 3. The mechanical characteristics adopted for all the materials that are part of the numerical model are presented in Table 3.1.
Table 3.1 - Mechanical characteristics for the dam model
Mechanical
Characteristics Material 1 Material 2 Material 3
E [GPa] 12.0 20.0 10.0
ν 0.2 0.2 0.2
ρ [kg/m3] 2650.0 2400.0 2650.0
g [m/s2] 10.0 10.0 10.0