ORIGINAL ARTICLE
Support vector machine-based classification of
neuroimages in Alzheimer’s disease: direct comparison of
FDG-PET, rCBF-SPECT and MRI data acquired from the
same individuals
Luiz K. Ferreira,
1,2Jane M. Rondina,
1,3Rodrigo Kubo,
4Carla R. Ono,
4,5Claudia C. Leite,
6Jerusa Smid,
7Cassio Bottino,
8Ricardo Nitrini,
7Geraldo F. Busatto,
1,2,8Fabio L. Duran,
1,2Carlos A. Buchpiguel
2,4,51Laborato´rio de Neuroimagem em Psiquiatria (LIM21), Instituto de Psiquiatria, Hospital das Clı´nicas, Faculdade de Medicina, Universidade de
Sa˜o Paulo (USP), Sa˜o Paulo, SP, Brazil.2Nu´cleo de Apoio a` Pesquisa em Neurocieˆncia Aplicada (NAPNA), USP, Sa˜o Paulo, SP, Brazil. 3Sobell Department of Motor Neuroscience and Movement Disorders, Institute of Neurology, University College London, London, United
Kingdom.4Laborato´rio de Medicina Nuclear (LIM43), Departamento de Radiologia e Oncologia, Faculdade de Medicina, USP, Sa˜o Paulo, SP, Brazil.5Servic¸o de Medicina Nuclear, Hospital do Corac¸a˜o da Associac¸a˜o Sanato´rio Sı´rio, Sa˜o Paulo, SP, Brazil.
6Departamento de
Radiologia e Oncologia, Faculdade de Medicina, USP, Sa˜o Paulo, SP, Brazil.7Departamento de Neurologia, Faculdade de Medicina, USP, Sa˜o Paulo, SP, Brazil.8Departamento de Psiquiatria, Faculdade de Medicina, USP, Sa˜o Paulo, SP, Brazil.
Objective:To conduct the first support vector machine (SVM)-based study comparing the diagnostic accuracy of T1-weighted magnetic resonance imaging (T1-MRI), F-fluorodeoxyglucose-positron emi-ssion tomography (FDG-PET) and regional cerebral blood flow single-photon emiemi-ssion computed tomography (rCBF-SPECT) in Alzheimer’s disease (AD).
Method:Brain T1-MRI, FDG-PET and rCBF-SPECT scans were acquired from a sample of mild AD patients (n=20) and healthy elderly controls (n=18). SVM-based diagnostic accuracy indices were calculated using whole-brain information and leave-one-out cross-validation.
Results:The accuracy obtained using PET and SPECT data were similar. PET accuracy was 68B71% and area under curve (AUC) 0.77B0.81; SPECT accuracy was 68B74% and AUC 0.75B0.79, and both had better performance than analysis with T1-MRI data (accuracy of 58%, AUC 0.67). The addition of PET or SPECT to MRI produced higher accuracy indices (68B74%; AUC: 0.74B0.82) than T1-MRI alone, but these were not clearly superior to the isolated neurofunctional modalities.
Conclusion: In line with previous evidence, FDG-PET and rCBF-SPECT more accurately identi-fied patients with AD than T1-MRI, and the addition of either PET or SPECT to T1-MRI data yielded increased accuracy. The comparable SPECT and PET performances, directly demonstrated for the first time in the present study, support the view that rCBF-SPECT still has a role to play in AD diagnosis.
Keywords: Alzheimer’s disease; support vector machine; MRI; FDG-PET; SPECT
Introduction
Alzheimer’s disease (AD) is characterized by structural and metabolic changes in the brain. The most consistent evidence of AD-related neuronal degeneration includes grey matter (GM) atrophy in the temporal lobes and medial parietal cortex and hypometabolism in the temporoparietal cortex.1,2
AD is mainly diagnosed by detecting characteristic patterns of cognitive decline. Its onset is typically insidious– cognitive decline generally begins years before reaching the threshold of clinical significance and functional impair-ment. Neuropsychological testing can help identify and
quantify such cognitive deficits, thus improving diagnostic certainty. The exclusion of other diseases, which requires blood tests and neuroimaging investigations, is also a fun-damental part of the diagnostic process.1,2
T1-weighted magnetic resonance imaging (T1-MRI) is widely used both to rule out non-AD pathological pro-cesses (such as brain tumors and infarcts) and to characterize a typical AD-related pattern of atrophy in the temporal lobe and medial parietal cortex. Functional neuroimaging modalities, including18 F-fluorodeoxyglucose-positron emission tomography (FDG-PET) and regional cerebral blood flow single-photon emission computed tomography (rCBF-SPECT) frequently reveal the typical pattern of hypometabolism/hypoperfusion in temporopar-ietal regions and can be useful in cases of diagnostic uncertainty. While FDG-PET has greater sensitivity and specificity to detect AD-related hypofunctional brain pat-terns, the rCBF-SPECT method is more readily available and less expensive in clinical settings.3,4These functional Correspondence: Luiz Kobuti Ferreira, Centro de Medicina Nuclear,
2oandar, LIM-21, Rua Dr. Ovı´dio Pires de Campos, s/no, CEP 05403-010, Sa˜o Paulo, SP, Brazil.
E-mail: [email protected]
Submitted Aug 26 2016, accepted May 08 2017, Epub Oct 02 2017.
Brazilian Journal of Psychiatry Brazilian Psychiatric Association
modalities should not be used as the only imaging measures during the diagnostic workup because they cannot provide the structural data necessary to exclude non-AD diagnoses that contribute to cognitive decline.1,2 Although AD studies using mean neuroimaging indices have brought major advances in the characterization of group-wise brain abnormalities,5,6 the diagnosis of indivi-dual cases based solely on neuroimaging data is still not possible, given that brain findings can vary greatly between patients.
Diagnosis of early AD can be challenging. The task of summarizing the complex, highly dimensional neuroima-ging data into a single label – the presence or absence of disease – has been addressed with the use of machine learning-based pattern recognition techniques in different neuropsychiatric disorders.7The support vector machine (SVM) is a multivariate machine learning approach for classifying individuals through pattern recognition analy-sis. The aim of SVM is to find the best hyperplane that separates all data points of one group from those of another group.8,9 SVM can potentially be applied to multimodal neuroimaging data to improve the accuracy of AD diagnosis.10,11
Both FDG-PET and rCBF-SPECT can be combined with neurostructural data to provide complementary infor-mation about brain changes associated with AD.1A recent systematic review found that although FDG-PET can help distinguish between different types of dementia, it is at best only slightly better than rCBF-SPECT in differentiating AD patients from healthy controls.12 Nevertheless, evi-dence from studies comparing rCBF-SPECT and FDG-PET is still ‘‘limited and inadequate’’ and none of the studies included in the above-mentioned review performed SVM analyses.12
SVM has been used in AD studies investigating com-binations of T1-MRI + FDG-PET,13-16 but we are not aware of another SVM study that has investigated SVM performance in discriminating AD from controls with a combination of T1-MRI, FDG-PET and rCBF-SPECT scans acquired from the same sample. Thus, it is still unknown whether a combination of T1-MRI plus FDG-PET is superior to T1-MRI plus rCBF-SPECT.
Intensity normalization is a standard step in studies involving FDG-PET and SPECT, whether for total tracer uptake in the brain or for uptake in a single reference brain region. This procedure minimizes the effects of inter-individual differences in whole-brain signal, allow-ing regional patterns of change in metabolic activity to be identified.17,18The cerebellum is often used as reference because it is known to be spared in AD,13,18 and both cerebellar and global uptake normalization have been used in SVM studies on AD.13,19Based on the hypothesis that the reference region is unaffected by the disease under investigation18 and on previous semi-quantitative FDG-PET and rCBF-SPECT studies comparing AD patients and controls,17,20we expected cerebellar normalization to improve diagnostic accuracy. However, no extant SVM study has directly compared the diagnostic accuracy of cerebellar and global normalization when distinguishing AD from controls.
The aim of the present study is to evaluate the diag-nostic accuracy of SVM in distinguishing AD patients from healthy controls using neurostructural (T1-MRI) and neur-ofunctional imaging data (both FDG-PET and rCBF-SPECT). Our intention was to measure SVM performance in conjunction with neuroimaging data (both in isolation and in combination) and characterize the optimal combi-nation of imaging modalities, as well as to test whether normalizing radiotracer uptake in the cerebellum (for PET and SPECT data) would improve the diagnostic perfor-mance of the classifier.
Methods
Study population
Twenty patients with mild AD and a group of 18 healthy elderly controls were enrolled. The investigation was approved by the ethics committees of the institutions where the study was conducted. Informed consent was obtained from all participants.
Patients were recruited on their first visit to the memory outpatient clinics of the Neurology and Psychiatry depart-ments of the Universidade de Sa˜o Paulo Medical School. All patients fulfilled the DSM-III-R21criteria for mild dementia and NINCDS/ADRDA22 criteria for probable AD. The Cli-nical Dementia Rating (CDR) scale23 was used to assess clinical severity, and only patients with CDR equal to 0.5 or 1 (i.e., mild dementia) were included. Patients with an auditory deficit or uncorrected visual impairment that could have interfered with their cognitive evaluation were excluded, as were those undergoing pharmacological AD treatment with cholinesterase inhibitors. Healthy controls were recruited from activity centers and groups for elderly individuals in the community.
Exclusion criteria for both the AD and control groups were: less than four years of education, age below 60 or above 90 years, psychotropic drug use, diabetes mellitus, the presence of systemic disorders associated with cog-nitive impairment, or brain lesions incidentally detected in MRI. Family history of AD and information about current and previous medical, neurological and psychiatric illness was obtained during interviews with the participants and their families. Neurologic or psychiatric disorders prior to the onset of AD were also exclusion criteria.
Patients with AD underwent an extensive neuropsy-chological assessment including the following tests: the Mattis Dementia Rating Scale (DRS),24the Trail-Making Test parts A and B, the Hopper Visual Organization Test, the Rey Auditory Verbal Learning Test, the Wechsler Memory Scale: logic memory and visual reproduction subtests, the Rey-Osterrieth complex figure test, the Boston Naming Test and the Wisconsin Card Sorting Test. Instru-mental activities of daily living were quantified using the Functional Activities Questionnaire.25
Image acquisition and preprocessing
Classification using support vector machine (SVM)
We employed a whole-brain approach involving a mask to exclude voxels outside the brain. This resulted in feature vectors of 219727 voxels for all modalities (each feature corresponds to a brain voxel).
We applied SVM8,9,26,27 using LIBSVM software28 (available in the PRoNTo toolbox)11 to classify controls (class 1) and AD patients (class 2). Considering the large number of features, we used a linear kernel, since there was no need to map them to an even higher dimensional feature space to separate the examples. Due to the comparative nature of our investigation, the soft-margin SVM penalty parameterCwas fixed to 1, so no grid search was perfor-med to find the optimal parameter when classifying.
Given that the AD group tended to be older and have fewer years of education than the control group (Table 1), the neuroimaging data was corrected for the effects of age and education. This was achieved through linear algebra operations involving matrix transformation to remove con-founding effects from kernels using a residual matrix.29,30
During the training phase, the SVM algorithm finds a hyperplane that separates the examples in the input space, thus maximizing the margin of separation between the classes. Support vectors are data points that lie closest to the separating hyperplane. Once the decision function is determined from the training data, it can be used to predict the class label of a new test example.31
To evaluate the generalization ability of the model, the dataset was partitioned into a ‘‘training set’’ and a ‘‘testing set.’’ By repeatedly repartitioning the data this way, we obtained an estimate of the generalization error of the model. We used a leave-one-out cross-validation
approach32,33 in which a single example (i.e., one AD patient or healthy control) was left out of testing in each iteration.
Accuracy was obtained through the number of true positives (patients correctly classified) and true negatives (healthy controls correctly classified). Since the number of examples in each class differed, we calculated a balanced accuracy measure, which takes the number of samples in each class into account, giving equal weight to the accu-racies obtained in test samples. We also compared the different models using receiver operating characteristic (ROC) curves, plotting the true positive rate against the false positive along different threshold values. The area under the curve (AUC) is a summary measure describing a classifier’s performance across all decision thresholds.
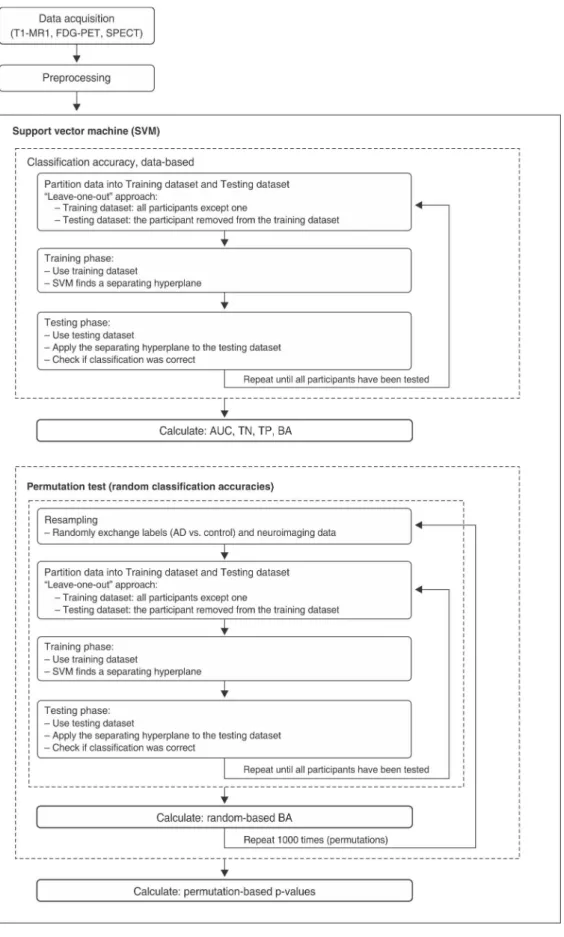
Statistical significance was tested using permuta-tions, a non-parametric approach by which the frequency distribution under the null hypothesis is obtained by cal-culating many possible combinations under rearrange-ments of the labels (i.e., ‘‘AD patients’’ vs. ‘‘controls’’) across the examples. We randomly exchanged the labels associated with the examples and repeated the complete procedure (leave-one-out training and test) 1,000 times. Since permuted labels destroy the correlation between examples and labels, the classification accuracy should be close to chance (around 50%). Figure 1 schematically describes the flow chart of the SVM analysis.
Results
The AD group (11 female) had a mean age of 75.564.0 years and their mean educational level was 7.363.9 years.
Table 1 Demographic characteristics and neuropsychological performance of both groups, and instrumental activities of daily living of the AD group
AD group Control group p-value*
Age 75.5 (4.0) 72.7 (4.2) 0.06
Male/female 9/11 7/11 0.70
Education (years) 7.3 (3.9) 10.4 (4.8) 0.05
MMSE 21.3 (2.8) 28.1 (1.3) o0.01
DRS 109.30 (12.98) 134.44 (6.92) o0.001
Trail-A 112.40 (60.84) 48.11 (16.82) o0.001
Trail-Bw 263.62 (75.04) 132.67 (44.25)
o0.001
HVOT 69.25 (10.80) 58.83 (9.40) 0.004
RAVLT 19.60 (6.19) 36.28 (5.79) o0.001
WMS-R-LM 14.30 (8.32) 33.56 (7.68) o0.001
WMS-R-VR 12.25 (4.61) 27.39 (7.45) o0.001
ROCFw 19.76 (10.10) 26.69 (7.38) 0.002
BNT 32.85 (9.21) 44.39 (7.06) o0.001
WCSTw 22.31 (11.86) 29.29 (9.24) 0.046
FAQ 10.00 (6.19) N/A
-Data presented as mean (standard deviation), unless otherwise specified. AD = Alzheimer’s disease.
*p-value for Mann-Whitney tests (continuous variables) or chi-square test (gender). Wilcoxon rank-sum test for neuropsychological performance variables and FAQ.
AD = Alzheimer’s disease; BNT = Boston naming test; DRS = Mattis Dementia Rating Scale (total points)24; FAQ = Functional Activities Questionnaire25; HVOT = Hopper Visual Organization Test (tscore, with higher scores reflecting worse performance); MMSE = Mini-Mental State Examination; N/A = not available; RAVLT = Rey Auditory Verbal Learning Test; ROCF = Rey-Osterrieth complex figure test, copy subtest; SD = standard deviation; Trail-A and Trail-B = Trail Making Test parts A and B (time in seconds); WCST = Wisconsin Card Sorting Test, number of correct responses; WMS-R-LM = Wechsler Memory Scale logic memory subtest, immediate recall; WMS-R-VR = Wechsler Memory Scale visual reproduction subtest, immediate recall.
Figure 1 Flow chart of SVM analysis. AD = Alzheimer’s disease; AUC = area under curve; BA = balanced accuracy; FDG-PET =
18F-fluorodeoxyglucose-positron emission tomography; SPECT = single-photon emission computed tomography; SVM =
The mean Mini-Mental State Examination (MMSE) score was 21.362.3, and the mean time of AD was 22.56 11.0 months. All patients presented a typically slow and gradual symptom onset, with clinically relevant cognitive changes beginning 22.5611 months before study enroll-ment. The AD group’s mean Functional Activities Ques-tionnaire25 score for instrumental activities of daily living was 1066.2 points. All AD patients were right-handed. Five patients had a family history of dementia, but without a dominant pattern of inheritance.
Healthy controls (11 female, mean age 72.764.2 years, mean education 10.464.8 years) presented no memory complaints, their physical and neurological examination was normal and their CDR score was 0 (no deficit). They underwent a comprehensive neuropsychological evalua-tion (including MMSE) to objectively rule out cognitive deficits,34and a self-reporting questionnaire35was used to exclude depression and other mental disorders (all scores were less than 8). All controls except one were right-handed. Volunteers with a family history of AD or any other form of dementia were excluded.
The demographic characteristics of the two groups are presented in Table 1. There was a trend towards greater age and fewer years of formal education in the AD group. Table 1 also presents the neuropsychological assessment data for both groups, as well as the Functional Activities Questionnaire25 scores for the AD group (instrumental activities of daily living). As expected, the neuropsycholo-gical performance of the AD group was worse than con-trols. Further details about the enrolment requirements and sample characteristics have been described in Buchpiguel et al.36
Single modality
Table 2 presents the results of analyses performed for each modality individually, while Figure 2 presents the ROC curve for each of the functional imaging modalities compared with the T1-MRI data. The best accuracy in distinguishing AD patients from controls was obtained using neurofunctional data. Classification using rCBF-SPECT resulted in an AUC of 0.75B0.79 and an accu-racy of 68B74%, while FDG-PET data resulted in an AUC of 0.77B0.81 and an accuracy of 68B71%. T1-MRI presented the worst performance, with 58% accuracy and an AUC of 0.67. Classification accuracy using neurofunctional data reached statistically signifi-cant values, although this did not occur when using only MRI (Table 2). The different preprocessing pipelines for neurofunctional data did not yield clear differences in diagnostic performance.
Figure 3 is a graphical representation of predictions for each single modality classification (T1-MRI, FDG-PET and rCBF-SPECT). Since multiple analyses were per-formed for FDG-PET and rCBF-SPECT, this figure pre-sents only the classifications that resulted in the best accuracies for each modality (i.e., rCBF-SPECT without correction for PVE and both FDG-PET and rCBF-SPECT with cerebellar normalization). Subjects classified as healthy controls are plotted to the left of the dotted vertical line (i.e., with negative SVM projections) while subjects to
the right of the vertical line presented positive SVM projections and were thus classified as having AD. Classification using only T1-MRI data resulted in more incorrect labeling than either FDG-PET or rCBF-SPECT alone.
Figure 4 presents the three discriminant maps showing the relative weight of brain voxels resulting from the appli-cation of linear SVM to classify AD patients vs. controls using each imaging modality (T1-MRI, FDG-PET and rCBF-SPECT). It is clear in this figure that classifications based on each modality produce different global patterns of anatomical distribution of voxel weights.
Combining modalities
Combining neurofunctional data (FDG-PET or rCBF-SPECT) with T1-MRI yielded better classification accu-racies (68B74% vs. 58%) and improved AUC (0.74B 0.82 vs. 0.67) than neuroanatomical data alone. However, the combination of modalities did not present a clear improvement over isolated neurofunctional data. Table 2 presents the results of analyses with a combination of modalities and Figure 5 shows the ROC curves for each combination of modalities.
Discussion
To the best of our knowledge, this is the first SVM-based neuroimaging study to conduct comparative diagnostic accuracy assessments of brain T1-MRI, FDG-PET and rCBF-SPECT data acquired from the same AD patients and controls.
The lowest diagnostic accuracy resulted from using only T1-MRI data. One possibility is that nonspecific find-ings of brain atrophy – variably detected in cognitively preserved elderly subjects – may complicate the discri-mination when SVM methods are applied. Moreover, in SVM investigations with a modest sample size (as in our case), variations in a single MRI dataset (for instance due to movement during scanning) may more significantly affect diagnostic performance.37 The higher accuracy indices of neurofunctional data relative to MRI-based data is in accordance with previous T1-MRI and FDG-PET studies,13,14 confirming the idea that brain metabolic markers more accurately differentiate AD-related patho-logical changes from the effects of healthy aging on the brain.14Moreover, multimodal neuroimaging studies have suggested that metabolic changes precede atrophy in AD.38Accordingly, using imaging modalities sensitive to hypometabolism, such as FDG-PET and rCBF-SPECT, resulted in better accuracy than classification with T1-MRI, especially considering that the sample consisted of patients with mild dementia.
AD diagnosis, especially given its broader availability in certain regions than FDG-PET.
In the present study, combining neurofunctional and neuroanatomical data yielded higher accuracy indices than T1-MRI images alone, which agrees with previous studies.13,14Although adding neurofunctional data to neu-roanatomical data yielded better results, the accuracy resulting from the combination of modalities was not clearly superior to that of neurofunctional modalities
alone, which also agrees with previous PET and MRI studies.13,14This may be due to the whole brain approach, since it has been previously shown that using data extrac-ted only from disease-relaextrac-ted regions of interest can result in increased MRI-T1+FDG-PET classification accuracy compared to single modality FDG-PET.13,45
Previous SVM-based investigations using FDG-PET or rCBF-SPECT data did not compare the diagnostic accu-racy of cerebellar vs. global normalization for distinguishing
AD from controls. In this study the accuracy indices were similar for the two tracer normalization procedures. This suggests that although the normalization procedure can yield different results in studies comparing mean functional data between groups of healthy controls and AD,46 the normalization approach is not as critical when classifying individuals using pattern recognition analysis.
There are a number of strengths in the present study that should be highlighted, such as the careful selection and clinical assessment of controls and patients in early-stage AD. All three image modalities were performed with all subjects, allowing for direct comparison of the classifier performance between modalities and combinations of modalities. Moreover, we employed state-of-the-art meth-ods to correct functional neuroimaging data for PVE.
However, the relatively modest sample size is an important limitation, and this probably influenced our relatively low accuracy figures compared to studies with larger samples,37 particularly regarding T1-based MRI data. However, the novelty of our study lies not in report-ing how well neuroimagreport-ing-based diagnostic performance indices can discriminate AD from controls using SVM, but rather in its direct comparisons of neuroimaging mod-alities, particularly since both the PET and SPECT data were acquired from the same AD patients and controls. Indeed, the SVM-based evaluation of such a modestly sized but carefully screened sample has still provided sufficient power to produce high diagnostic accuracy scores when either of these neurofunctional modalities was included in the analyses. Another limitation of our
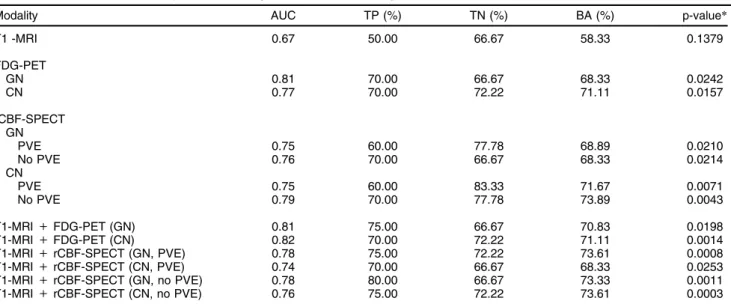
Table 2 Classification accuracy for each image and combined image modalities
Modality AUC TP (%) TN (%) BA (%) p-value*
T1 -MRI 0.67 50.00 66.67 58.33 0.1379
FDG-PET
GN 0.81 70.00 66.67 68.33 0.0242
CN 0.77 70.00 72.22 71.11 0.0157
rCBF-SPECT GN
PVE 0.75 60.00 77.78 68.89 0.0210
No PVE 0.76 70.00 66.67 68.33 0.0214
CN
PVE 0.75 60.00 83.33 71.67 0.0071
No PVE 0.79 70.00 77.78 73.89 0.0043
T1-MRI+FDG-PET (GN) 0.81 75.00 66.67 70.83 0.0198
T1-MRI+FDG-PET (CN) 0.82 70.00 72.22 71.11 0.0014
T1-MRI+rCBF-SPECT (GN, PVE) 0.78 75.00 72.22 73.61 0.0008
T1-MRI+rCBF-SPECT (CN, PVE) 0.74 70.00 66.67 68.33 0.0253
T1-MRI+rCBF-SPECT (GN, no PVE) 0.78 80.00 66.67 73.33 0.0011
T1-MRI+rCBF-SPECT (CN, no PVE) 0.76 75.00 72.22 73.61 0.0003
AUC = area under curve; BA = balanced accuracy; CN = cerebellar normalization; FDG-PET =18F-fluorodeoxyglucose-positron emission tomography; GN = global normalization; PVE = partial volume effect correction; rCBF-SPECT = regional cerebral blood flow single-photon emission computed tomography; T1-MRI = T1-weighted magnetic resonance imaging; TN = true negative; TP = true positive.
*Non-parametric statistical significance.
study is that we estimated neither the intelligence coeffi-cient of the AD patients and controls nor used a scale to document the presence, severity and clinical impact of neuropsychiatric symptoms, which are very common in AD.47 Nevertheless, the lack of this information is a common limitation in the field, shared by other SVM studies on AD.13-16It is important to point out that neuro-logic or psychiatric disorders prior to the onset of AD were exclusion criteria and that the development of neuropsy-chiatric symptoms has been considered a core feature of AD.47 Therefore, we believe that our study required no data correction for the presence of these symptoms. A third limitation worth mentioning is that the T1-MRI data was acquired using a 1.5 Tesla scanner, and it is possible that higher accuracies would emerge if a 3T scanner had
been used. Finally, although the SVM analysis conduc-ted herein allowed the accuracy of a machine learning-based approach to be tested with no need for a priori
definitions of anatomical hypotheses, such a whole-brain multivariate approach limits the interpretability of anato-mical results. Therefore, although the attribution of voxel weights was available, we refrain from drawing any con-clusions about the involvement of specific brain regions. We intend to address this issue in additional investiga-tions involving our multimodal imaging data, using an approach more suitable for extracting anatomical informa-tion from SVM analyses.48
A growing number of studies are employing machine learning approaches to deal with the large quantities of data generated by neuroimaging investigations, and future
Figure 4 Patterns of anatomical distribution of voxel weights resulting from single modality classifications. Positive weights mean a higher relative measure in that voxel for AD patients than controls. Conversely, a negative weight means a higher relative measure for controls. The measures are: GM volume for T1-MRI, regional brain metabolism for FDG-PET and regional cerebral blood flow for rCBF-SPECT. CN = cerebellar normalization; FDG-PET =18F-fluorodeoxyglucose-positron emission
studies should provide new insights and possibilities. For instance, the application of SVM techniques to neurofunc-tional and neurostructural data has already shown the potential to predict future cognitive decline and conversion from mild cognitive impairment to AD.49Another possibility is using longitudinal neuroimaging data (i.e. rate of change) as an input for the classifier.50,51 One additional alterna-tive is to apply a probabilistic framework that allows the
likelihood of diagnosis to be determined so that the concept of disease as a spectrum from normality to overt AD can be reflected in the analytical approach.52Another interesting idea is to apply machine-learning techniques to combine neuroimaging data with other types of biomarkers (e.g., CSF Ab42, t-tau and p-tau; APOE genotype) to further improve accuracy.52,53Finally, it should be pointed out that although SVM is a popular multivariate machine learning
approach, other similar methods have been applied to AD neuroimaging studies, such as the naive-Bayes clas-sifier, the Gaussian process and neural network classifi-cations.52,54-56
In conclusion, SVM performance in distinguishing AD from controls was better with neurofunctional data (FDG-PET and rCBF-SPECT) than with T1-MRI. The combina-tion of neurofunccombina-tional and volumetric data also yielded higher accuracies than T1-MR alone. Classification using SPECT presented similar results to those obtained with FDG-PET.
Acknowledgements
This study was supported by Fundac¸a˜o de Amparo a`
Pesquisa do Estado de Sa˜o Paulo (FAPESP; grants 2004/05551-6 and 2012/50329-6). JMR is supported by the Efficacy and Mechanism Evaluation (EME) Programme of the Medical Research Council (MRC) and National Institute for Health Research (NIHR, United Kingdom) partnership. GFB is supported by Conselho Nacional de Desenvolvi-mento Cientı´fico e Tecnolo´gico (CNPq) and FAPESP (grant 2012/50329-6). CAB is supported by FAPESP (grant 2004/05551-6).
Disclosure
The authors report no conflicts of interest.
References
1 Ferreira LK, Busatto GF. Neuroimaging in Alzheimer’s disease: cur-rent role in clinical practice and potential future applications. Clinics (Sa˜o Paulo). 2011;66:19-24.
2 McKhann GM, Knopman DS, Chertkow H, Hyman BT, Jack CR Jr, Kawas CH, et al. The diagnosis of dementia due to Alzheimer’s dis-ease: Recommendations from the National Institute on Aging-Alzheimer’s Association workgroups on diagnostic guidelines for Alzheimer’s disease. Alzheimers Dement. 2011;7:263-9.
3 Brooks DJ. Positron emission tomography and single-photon emis-sion computed tomography in central nervous system drug devel-opment. NeuroRx. 2005;2:226-36.
4 Matsuda H. Role of neuroimaging in Alzheimer’s disease, with emphasis on brain perfusion SPECT. J Nucl Med. 2007;48:1289-300. 5 Busatto GF, Diniz BS, Zanetti MV. Voxel-based morphometry in
Alzheimer’s disease. Expert Rev Neurother. 2008;8:1691-702. 6 Frisoni GB, Pievani M, Testa C, Sabattoli F, Bresciani L, Bonetti M,
et al. The topography of grey matter involvement in early and late onset Alzheimer’s disease. Brain. 2007;130:720-30.
7 Orru` G, Pettersson-Yeo W, Marquand AF, Sartori G, Mechelli A. Using support vector machine to identify imaging biomarkers of neurological and psychiatric disease: A critical review. Neurosci Biobehav Rev. 2012;36:1140-52.
8 Boser BE, Guyon IM, Vapnik VN. A training algorithm for margin optimal classifiers [Internet]. Proceedings of the Fifth Annual Work-shop on Computational Learning Theory. 1992 [cited 2017 May 22]. svms.org/training/BOGV92.pdf
9 Cortes C, Vapnik V. Support-vector networks. Mach Learn. 1995;20: 273-97.
10 Dyrba M, Ewers M, Wegrzyn M, Kilimann I, Plant C, Oswald A, et al. Combining DTI and MRI for the automated detection of Alzheimer’s disease using a large European multicenter dataset. In: Yap PT, Liu T, Shen D, Westin CF, Shen L, editors. Multimodal brain image analysis. Berlin: Springer; 2012. p.18-28.
11 Schrouff J, Rosa MJ, Rondina JM, Marquand AF, Chu C, Ashburner J, et al. PRoNTo: pattern recognition for neuroimaging toolbox. Neuroinformatics. 2013;11:319-37.
12 Davison CM, O’Brien JT. A comparison of FDG-PET and blood flow SPECT in the diagnosis of neurodegenerative dementias: a sys-tematic review. Int J Geriatr Psychiatry. 2014;29:551-61.
13 Dukart J, Mueller K, Horstmann A, Barthel H, Mo¨ller HE, Villringer A, et al. Combined evaluation of FDG-PET and MRI improves detection and differentiation of dementia. PLoS One. 2011;6:e18111. 14 Dukart J, Mueller K, Barthel H, Villringer A, Sabri O, Schroeter ML,
et al. Meta-analysis based SVM classification enables accurate detection of Alzheimer’s disease across different clinical centers using FDG-PET and MRI. Psychiatry Res. 2013;212:230-6. 15 Jie B, Zhang D, Cheng B, Shen D. Alzheimer’s Disease
Neuroima-ging Initiative. Manifold regularized multitask feature learning for multi-modality disease classification. Hum Brain Mapp. 2015;36:489-507. 16 Liu F, Wee CY, Chen H, Shen D. Inter-modality relationship
con-strained multi-modality multi-task feature selection for Alzheimer’s disease and mild cognitive impairment identification. Neuroimage. 2014;84:466-75.
17 Dukart J, Mueller K, Horstmann A, Vogt B, Frisch S, Barthel H, et al. Differential effects of global and cerebellar normalization on detection and differentiation of dementia in FDG-PET studies. Neuroimage. 2010;49:1490-5.
18 Yakushev I, Landvogt C, Buchholz HG, Fellgiebel A, Hammers A, Scheurich A, et al. Choice of reference area in studies of Alzheimer’s disease using positron emission tomography with fluorodeoxyglucose-F18. Psychiatry Res. 2008;164:143-53.
19 Horn JF, Habert MO, Kas A, Malek Z, Maksud P, Lacomblez L, et al. Differential automatic diagnosis between Alzheimer’s disease and frontotemporal dementia based on perfusion SPECT images. Artif Intell Med. 2009;47:147-58.
20 Rasmussen JM, Lakatos A, van Erp TG, Kruggel F, Keator DB, Fallon JT, et al. Empirical derivation of the reference region for computing diagnostic sensitive 18 fluorodeoxyglucose ratios in Alzheimer’s disease based on the ADNI sample. Biochim Biophys Acta. 2012;1822:457-66.
21 American Psychiatric Association. Diagnostic and Statistical Manual of Mental Disorders, Third Revised Edition (DSM-III-R).Washington: American Psychiatric Association; 1987.
22 McKhann G, Drachman D, Folstein M, Katzman R, Price D, Stadlan EM. Clinical diagnosis of Alzheimer’s disease: report of the NINCDS-ADRDA work group under the auspices of department of health and human services task force on Alzheimer’s disease. Neurology. 1984;34:939-44.
23 Morris JC. The Clinical Dementia Rating (CDR): current version and scoring rules. Neurology. 1993;43:2412-4.
24 Mattis S. Dementia rating scale - professional manual. Florida: Psy-chological Assessment Resources; 1988.
25 Pfeffer RI, Kurosaki TT, Harrah CH Jr, Chance JM, Filos S. Mea-surement of functional activities in older adults in the community. J Gerontol. 1982;37:323-9.
26 Davatzikos C, Shen D, Gur RC, Wu X, Liu D, Fan Y, et al. Whole-brain morphometric study of schizophrenia revealing a spatially complex set of focal abnormalities. Arch Gen Psychiatry. 2005;62:1218-27. 27 Magnin B, Mesrob L, Kinkingne´hun S, Pe´le´grini-Issac M, Colliot O,
Sarazin M, et al. Support vector machine-based classification of Alzheimer’s disease from whole-brain anatomical MRI. Neuroradiol-ogy. 2009;51:73.
28 Chang CC, Lin CJ. LIBSVM: a library for support vector machines. J ACM TIST. 2011;2:27.
29 Chu C, Ni Y, Tan G, Saunders CJ, Ashburner J. Kernel regression for fMRI pattern prediction. Neuroimage. 2011;56:662-73.
30 Rondina JM, Squarzoni P, Souza-Duran FL, Tamashiro-Duran JH, Scazufca M, Menezes PR, et al. Framingham coronary heart disease risk score can be predicted from structural brain images in elderly subjects. Front Aging Neurosci. 2014;6:300.
31 Byun H, Lee SW. Applications of support vector machines for pattern recognition: a survey. In: Lee SW, Verri AL, editors. Pattern recog-nition with support vector machines; 2002. First International Work-shop. 2002 Aug 10. Niagara Falls, Canada. p.213-36.
34 Nitrini R, Caramelli P, Porto CS, Charchat-Fichman H, Formigoni AP, Carthery-Goulart MT, et al. Brief cognitive battery in the diagnosis of mild Alzheimer’s disease in subjects with medium and high levels of education. Dement Neuropsychol. 2007;1:32-6.
35 Harding TW, de Arango MV, Baltazar J, Climent CE, Ibrahim HH, Ladrido-Ignacio L, et al. Mental disorders in primary health care: a study of their frequency and diagnosis in four developing countries. Psychol Med. 1980;10:231-41.
36 Buchpiguel CA, Smid J, Duran FL, Bottino C, Ono CR, Leite CC, et al. Brain MRI, SPECT and PET in early Alzheimer’s disease: a minor mismatch between volumetric and functional findings. Curr Mol Imaging. 2014;3:1-9.
37 Kloppel S, Stonnington CM, Chu C, Draganski B, Scahill RI, Rohrer JD, et al. A plea for confidence intervals and consideration of gen-eralizability in diagnostic studies. Brain. 2009;132:e102.
38 Jack CR Jr, Knopman DS, Jagust WJ, Shaw LM, Aisen PS, Weiner MW, et al. Hypothetical model of dynamic biomarkers of the Alzheimer’s pathological cascade. Lancet Neurol. 2010;9: 119-28.
39 Herholz K, Schopphoff H, Schmidt M, Mielke R, Eschner W, Scheidhauer K, et al. Direct comparison of spatially normalized PET and SPECT scans in Alzheimer’s disease. J Nucl Med. 2002;43:21-6. 40 Morinaga A, Ono K, Ikeda T, Ikeda Y, Shima K, Noguchi-Shinohara M, et al. A comparison of the diagnostic sensitivity of MRI, CBF-SPECT, FDG-PET and cerebrospinal fluid biomarkers for detecting Alzheimer’s disease in a memory clinic. Dement Geriatr Cogn Disord. 2010;30:285-92.
41 Nihashi T, Yatsuya H, Hayasaka K, Kato R, Kawatsu S, Arahata Y, et al. Direct comparison study between FDG-PET and IMP-SPECT for diagnosing Alzheimer’s disease using 3D-SSP analysis in the same patients. Radiat Med. 2007;25:255-62.
42 Silverman DH. Brain 18F-FDG PET in the diagnosis of neurode-generative dementias: comparison with perfusion SPECT and with clinical evaluations lacking nuclear imaging. J Nucl Med. 2004;45: 594-607.
43 Lo´pez MM, Ramı´rez J, Go´rriz JM, Alvarez I, Salas-Gonzalez D, Segovia F, et al. SVM-based CAD system for early detection of the Alzheimer’s disease using kernel PCA and LDA. Neurosci Lett. 2009;464:233-8.
44 Padilla P, Go´rriz JM, Ramı´rez J, Lang EW, Chaves R, Segovia F, et al. Analysis of SPECT brain images for the diagnosis of Alzhei-mer’s disease based on NMF for feature extraction. Neurosci Lett. 2010;479:192-6.
45 Yun HJ, Kwak K, Lee JM. Alzheimer’s Disease Neuroimaging Initia-tive. Multimodal discrimination of Alzheimer’s disease based on regional cortical atrophy and hypometabolism. PLoS One. 2015;10:e0129250. 46 Duran FL, Zampieri FG, Bottino CC, Buchpiguel CA, Busatto GF.
Voxel-based investigations of regional cerebral blood flow abnorm-alities in Alzheimer’s disease using a single-detector SPECT system. Clinics (Sa˜o Paulo). 2007;62:377-84.
47 Lyketsos CG, Carrillo MC, Ryan JM, Khachaturian AS, Trzepacz P, Amatniek J, et al. Neuropsychiatric symptoms in Alzheimer’s disease. Alzheimers Dement. 2011;7:532-9.
48 Castro E, Go´mez-Verdejo V, Martı´nez-Ramo´n M, Kiehl KA, Calhoun VD. A multiple kernel learning approach to perform classification of groups from complex-valued fMRI data analysis: application to schi-zophrenia. Neuroimage. 2014;87:1-17.
49 Zhang D, Shen D. Alzheimer’s Disease Neuroimaging Initiative. Predicting future clinical changes of MCI patients using longitudinal and multimodal biomarkers. PLoS One. 2012;7:e33182.
50 Ardekani BA, Bermudez E, Mubeen AM, Bachman AH. Alzheimer’s Disease Neuroimaging Initiative. Prediction of incipient Alzheimer’s disease dementia in patients with mild cognitive impairment. J Alzheimers Dis. 2017;55:269-81.
51 Farzan A, Mashohor S, Ramli AR, Mahmud R. Boosting diagnosis accuracy of Alzheimer’s disease using high dimensional recognition of longitudinal brain atrophy patterns. Behav Brain Res. 2015;290: 124-30.
52 Young J, Modat M, Cardoso MJ, Mendelson A, Cash D, Ourselin S, et al. Accurate multimodal probabilistic prediction of conversion to Alzheimer’s disease in patients with mild cognitive impairment. Neuroimage Clin. 2013;2:735-45.
53 Zhang D, Wang Y, Zhou L, Yuan H, Shen D. Alzheimer’s Disease Neuroimaging Initiative. Multimodal classification of Alzheimer’s dis-ease and mild cognitive impairment. Neuroimage. 2011;55:856-67. 54 Challis E, Hurley P, Serra L, Bozzali M, Oliver S, Cercignani M.
Gaussian process classification of Alzheimer’s disease and mild cognitive impairment from resting-state fMRI. Neuroimage. 2015;112: 232-43.
55 Dyrba M, Ewers M, Wegrzyn M, Kilimann I, Plant C, Oswald A, et al. Robust automated detection of microstructural white matter degen-eration in Alzheimer’s disease using machine learning classification of multicenter DTI data. PLoS One. 2013;8:e64925.