Glutathione depletion triggers actin cytoskeleton changes
via actin-binding proteins
Nahum Zepeta-Flores
1, Mahara Valverde
1, Alejandro Lopez-Saavedra
2and Emilio Rojas
1 1Departamento de Medicina Genómica y Toxicología Ambiental, Instituto de Investigaciones Biomédicas,
Universidad Nacional Autónoma de México, México D.F., Mexico.
2
Unidad Biomédica de Investigación en Cáncer, Instituto de Investigaciones Biomédicas, Universidad
Nacional Autonóma de México, Instituto Nacional de Cancerología, México. D.F., Mexico.
Abstract
The importance of glutathione (GSH) in alternative cellular roles to the canonically proposed, were analyzed in a model unable to synthesize GSH. Gene expression analysis shows that the regulation of the actin cytoskeleton pathway is strongly impacted by the absence of GSH. To test this hypothesis, we evaluate the effect of GSH de-pletion via buthionine sulfoximine (5 and 12.5 mM) in human neuroblastoma MSN cells. In the present study, 70% of GSH reduction did not induce reactive oxygen species, lipoperoxidation, or cytotoxicity, which enabled us to evaluate the effect of glutathione in the absence of oxidative stress. The cells with decreasing GSH levels ac-quired morphology changes that depended on the actin cytoskeleton and not on tubulin. We evaluated the ex-pression of three actin-binding proteins: thymosinb4, profilin and gelsolin, showing a reduced expression, both at gene and protein levels at 24 hours of treatment; however, this suppression disappears after 48 hours of treat-ment. These changes were sufficient to trigger the co-localization of the three proteins towards cytoplasmic pro-jections. Our data confirm that a decrease in GSH in the absence of oxidative stress can transiently inhibit the actin binding proteins and that this stimulus is sufficient to induce changes in cellular morphology via the actin cytoskeleton.
Keywords: Glutathione, BSO, thymosinb4, gelsolin, profiling.
Received: June 01, 2017; Accepted: November 18, 2017.
Introduction
Gluthathion (GSH) is a tripeptide synthesized in two adenosine triphosphate-dependent steps: the glutamate cys-teine ligase (GCL; rate-limiting enzyme in GSH synthesis) forms the dipeptideg-L-glutamyl-L-cysteine, and then the glutathione synthetase binds a glycine to form GSH or
g-L-glutamyl-L-cysteinyl-glycine (Bains and Shaw, 1997; Dringen, 2000). GSH acts as a redox buffer due to its cysteine sulfhydryl group (-SH); GSH can therefore react directly with radicals through non-enzymatic reactions and constitutes the main barrier against oxidative damage cau-sed by reactive oxygen species (ROS). GSH can also form xenobiotic conjugates through its enzymatic glutathione S-transferase activity and acts as an electron donor in the peroxide reduction catalyzed by the glutathione peroxidase enzyme (GPx) (Camera and Picardo, 2002).
Additionally, GSH and GSH metabolism have been implicated in cancer prevention, progression and treatment response. As a scavenger molecule, GSH can inhibit the
ac-tion of different molecules through their interacac-tion, in-cluding harmful molecules and anticancer drugs (Siddik, 2003; Wang and Lippard, 2005; Franco and Cidlowski, 2009; Chen and Tien Kuo, 2010). Also, GSH levels appear to be reduced after exposure to some xenobiotics (Becker and Soliman, 2009; Pierozanet al., 2016). In the nervous system, GSH is needed for defense against oxidative stress, and alterations in GSH metabolism have been reported in different pathologies including Parkinson’s disease and Al-zheimer’s disease (Bains and Shaw, 1997; Ramaekers and Bosman, 2004). Thus, a reduced level of GSH appears to represent an important step in cell destabilization.
In addition to its several functions, data generated in our workgroup on a GCS-2 cell line (a GCL knockout cell line that is unable to synthesize GSH (Shi et al., 2000; Rojaset al., 2003; Valverdeet al., 2006) suggested that the reduced level of intracellular GSH (2% of the wild type value of GSH) could generate changes in the expression of several genes. In addition, these cells can survive in the complete absence of GSH if N-acetyl cysteine is provided in the medium; thus, the reducing equivalents provided by GSH, and not GSH itself, protect cells from apoptosis. This means that GCS-2 cells with a severe reduction in GSH produce a metastable state compatible with survival. The
DOI: http://dx.doi.org/10.1590/1678-4685-GMB-2017-0158
Send correspondence to Emilio Rojas. Depto. Medicina Genómica y Toxicología Ambiental, Instituto de Investigaciones Biomédicas, Universidad Nacional Autónoma de México, C.P. 04510. México, Mexico. E-mail: emilior@biomedicas.unam.mx.
results provided by this particular cell model could indicate that cell survival is compatible with low GSH intracellular levels without alterations of redox. In the present study, from the analysis of global expression of the GSC-2 model identifies the role of the absence of GSH in the pathways in-volved in the remodeling of the actin cytoskeleton and ex-plores the hypothesis in a neuroblastoma model, under intracellular GSH modulation.
This study used MSN neuroblastoma cells to repre-sent an early stage in neuronal development in which cells are pluripotent and retain the capability of expressing mul-tiple neural crest-derived phenotypes (Abemayor and Si-dellt, 1989). These cells also appear to be very sensitive to thiols depletion and have been used previously to observe changes in the cytoskeleton (Ariaset al., 1993; Koet al., 1997; Stabel-Burowet al., 1997).
The cytoskeleton is a dynamic system that consists of several filamentous networks that extend from the plasma membrane to the nuclear envelope and interconnect the cell nucleus to the extracellular matrix. Actin polymerizes to form filaments and participates in the generation and main-tenance of cell morphology, polarity, endocytosis, intra-cellular trafficking, contractility, motility and cell division (Ramaekers and Bosman, 2004; Fuet al., 2015). However, actin filaments by themselves are not able to perform the processes involved. Instead, these processes require many proteins, including actin-binding proteins. Actin-binding proteins are responsible for orchestrating rounds of poly-merization-depolymerization of the actin filaments. Our work focuses on three of the relevant functions of the actin binding proteins in disease development: thymosin b4, gelsolin and profilin (Winder and Ayscough, 2005; Leeet al., 2013; Cuiet al., 2016).
Thymosinb4 is a monomer-sequestering protein that maintains a large pool of actin that allows rapid filament growth, clamps ATP-actin, and prevents its incorporation into filaments (Dedovaet al., 2006). Gelsolin is a capping and severing protein that controls filament length by cap-ping the barbed end, blocking the addition of new mono-mers and severing actin filaments to increase actin dynam-ics (Sun et al., 1999). Finally, profilin is also a monomer-sequestering protein but is involved in binding to ADP-actin to promote the nucleotide exchange (ADP for ATP) and facilitate new rounds of polymerization (Hertzog
et al., 2004; Birbach, 2008).
Abnormalities in these essential cell components of-ten result in disease (Ramaekers and Bosman, 2004). Stu-dies have shown that the actin cytoskeleton and the actin-binding proteins participate in many processes related to carcinogenesis, such as invasion, metastasis and the epi-thelial-mesenchymal transition (Kedrinet al., 2007; Lo-renteet al., 2014; Cuiet al., 2016). Moreover, alterations in cytoskeletal components have been implicated in the pro-gression of some neurodegenerative disorders (McMurray, 2000; Yinget al., 2004).
Given the essential roles of the actin cytoskeleton and GSH in physiological and pathological processes, the aim
of the present study was to confirm the hypothesis gener-ated by the model GCS-2 in a scenario of GSH depletion in the regulation and remodeling of the actin cytoskeleton in human MSN neuroblastoma cells.
Materials and Methods
GCS-2 cell model
Cell culture
All studies used M15 complete medium, “knockout” DMEM supplemented with 15% embryonic stem cell-qua-lified FBS, 2 mM glutamine, 0.1 mMb-mercaptoethanol (BME), 100 units/mL of penicillin, and 100 mg/mL of streptomycin (all from GIBCO/BRL, Carlsbad, CA, USA, except BME, from Sigma-Aldrich, St. Louis, MO, USA). Mouse blastocyst cells derived from GCS -/- and the +/+ BDC1 mice were obtained.gGCS-deficient cells (GCS-2) were maintained in the above medium with 2.5 mM GSH (Sigma-Aldrich) and changed with fresh GSH containing medium daily. In the experiments involving GSH with-drawal, cells were washed twice with 1X PBS (GIBCO/BRL) and replaced with complete medium with-out supplemental GSH. Cultures were maintained at 37 °C in humidified incubators containing 5% CO2. Intracellular
GSH levels ingGCS-deficient cells grown in the presence or absence of GSH were determined using HPLC/EC de-tection as described by Kleinman and Riche Jr (1995). Via-bility and cell number were determined using trypan blue exclusion staining (Sigma-Aldrich). Briefly, aliquots of 2.5 x 10⁵cells/mL were mixed with the trypan blue, and cells were examined by light microscopy. The results repre-sent the average of three independent experiments with du-plicate determinations.
cRNA preparation
We isolated total RNA using Trizol reagent (Invi-trogen, Carlsbad, CA, USA) and purified the RNeasy Total RNA Isolation Kit (Qiagen, Hilden, Germany). The Super-Script Choice system (Invitrogen) was used to synthesize double-stranded cDNA. Phase Lock Gels-phenol and chlo-roform extractions (Eppendorf, Hamburg, Germany) were used to clean up the cDNA template. We then generated bi-otin-labeled cRNA from this template using a BIOARRAY HIGHYIELD RNA Transcript Labeling Kit (Enzo Life Sciences, Farmingdale, NY, USA).In vitro transcription products were purified using RNeasy spin columns (Qia-gen) and were quantified by spectrophotometric analysis. After the purification, the cRNA was fragmented using the standard procedure by Affymetrix to obtain a distribution of RNA fragments sized from approximately 35 to 200 bases. Fragmented RNA was checked with agarose gel electrophoresis.
Microarray analysis
cR-NA, 50 pM control oligonucleotide B2, 1.5, 5, 25 and 100 pM eukaryotic hybridization controls withbioB, bioC, bioDandcregenes, respectively, 0.1 mg/mL herring sperm DNA, 0.5 mg/ml acetylated BSA and 1X hybridization buffer. This hybridization cocktail was heated to 99 °C for 5 min and then used to fill the probe array cartridge. Hy-bridization was performed for 16 h with a rotation of 60 rpm in a rotisserie oven at 4 5°C.
After 16 h of hybridization, the hybridization cocktail was removed from the probe array, and the array was filled with non-stringent wash buffer. The GeneChipÒFluidics Station 400 (Affymetrix, Inc., Santa Clara, CA, USA) oper-ated using Microarray Suite was used to wash and stain the probe arrays. We followed the manufacturer’s single stain protocol for eukaryotic targets. Arrays were washed twice and stained with a 10mg/L streptavidin phycoerythrin solu-tion. After staining, a final wash with non-stringent buffer was performed, and the arrays were scanned.
Data analysis
Image quantification, background subtraction and scaling were carried out with dChip software (Harvard, Boston, MA, USA) with 100% recall between control and lower GSH level chips andp<0.05 for the statistical algo-rithm (Li and Wong, 2001). DAVID Bioinformatics re-sources 6.8 was used to analyze the impacted pathways (Huanget al., 2009).
MSN cell model
Adherent human neuroblastoma MSN cells were grown in monolayers (Reynoldset al., 1986; Ramos-Es-pinosaet al., 2012). The cells were cultured in RPMI 1640 medium (Sigma-Aldrich) supplemented with 10% fetal bo-vine serum (Gibco, Life Technologies Corporation, Grand Island, NY, USA), 1% antibiotic-antimycotic (penicillin-streptomycin-amphotericin) (Gibco), 1% MEM non-essen-tial amino acids (Gibco) and 1% QSN (glutamine-seri-ne-asparagine) in tissue culture dishes in a humidified incu-bator under 95% air and a 5% CO2atmosphere at 37 °C.
Cells were subcultured at a density of 1x10⁶cells per dish and harvested by gently pipetting.
GSH depletion (BSO treatments)
A total of 1x10⁶ MSN cells were seeded into a 100 mm tissue culture dish with 7 mL of supplemented RPMI 1640 medium. After 72 h, the culture was gently washed with PBS buffer, and 10 mL of supplemented RPMI 1640 medium was added. Buthionine sulfoximine (BSO, L-Buthionine-sulfoximine Sigma-Aldrich) treat-ments were administered at final concentrations of 0, 5, 12.5, 25 and 50 mM.
Cell viability
Cell viability was measured using the dual stain fluo-rescein diacetate (FDA)/ethidium bromide (BrEt) method as previously described (Hartmann and Speit, 1997). Brie-fly, the cells were mixed with a fluorochrome solution
con-taining 0.02mg/mL Et-Br and 0.015mg/mL FDA (Sigma-Aldrich). The cells were then analyzed under an Olympus BX-60 fluorescence microscope with a UM61002 filter (Olympus, Tokyo, Japan). One hundred randomly chosen cells were evaluated per condition.
Reduced glutathione quantification
We used o-phthalaldehyde (OPT) (Sigma-Aldrich) as the fluorescent reagent to quantify the level of reduced glutathione due its specificity for GSH. A total of 100mL of cells in PBS supplemented with protease inhibitors and 100mL of meta-phosphoric acid (Sigma-Aldrich) precipi-tating reagent (1.67 g meta-phosphoric acid, 0.2 g EDTA (AMRESCO, Solon, OH, USA) and 30 g NaCl in 100 mL of distilled water) were added to a 0.6 mL Eppendorf tube, vortexed and centrifuged. The supernatant was decanted and frozen at -70 °C prior to further quantification. A total of 50mL of the supernatant was added to a 1.5 mL Ep-pendorf tube with 1 mL of GSH buffer (0.1 M NaH2PO4
and 0.005 M EDTA, pH 8.0). Then, 50 mL of OPT (1mg/mL in methanol) was added to obtain a GSH-fluo-rescent conjugate. Next, 200mL of the mixture from each Eppendorf tube was plated in an opaque 96-well plate and incubated for 15 min in the dark. The fluorescence was read in a BioTek FLx800 Fluorescence Microplate Reader (Wi-nooski, VT, USA) with the emission set at 420 nm and the excitation set at 350 nm (Browne and Armstrong, 1998).
Reactive Oxygen Species (ROS)
ROS were determined with a modified fluorometric assay (Leeet al., 2003), which employs dihydrorhodamine 123 (DHR; Calbiochem-EMD Chemicals Inc. San Diego, CA, USA) as the probe. When DHR is oxidized by H2O2in
the presence of peroxidases, it produces the fluorescent compound rhodamine 123. Briefly, 100mL of cells in PBS supplemented with protease inhibitors were centrifuged at 1,200 rpm for 5 min. Then, the supernatant was discarded, and 180mL of buffer A (140 mM NaCl, 5 mM KCl, 0.8 mM MgSO4•7H2O, 1.8 mM CaCl2, 5 mM glucose and 15 mM
HEPES, Sigma-Aldrich) and 20mL of DHR (1mM) were added and incubated at 37 °C for 2 min. The fluorescent product rhodamine 123 was measured using a spectro-photometer at 505 nm and interpolated in a curve of rho-damine 123.
Lipid peroxidation (Lpx)
absorbance of the thiobarbituric acid-MDA complex was measured at 532 nm using an ELISA spectrophotometer (Model 550 microplate reader, Bio-Rad, Hercules, Cali-forna, USA). The data were interpolated onto a concentra-tion curve of MDA (1,1,3,3-tetraethoxypropane) ranging from 0 to 10 nM.
Reverse transcriptase-polymerase chain reaction
Total RNA was isolated using TRIzol Reagent (Inv-itrogen) following the manufacturer’s protocol. The RNA quantity and purity were determined spectrophotometri-cally. The reverse transcriptase-polymerase chain reactions (RT-PCR) were performed using the Access RT-PCR Sys-tem (Promega, MADISON, WI, USA) according to the manufacturer’s recommendations. The RT-PCR products were loaded onto a 3% agarose gel, and the mRNA levels were analyzed using the Kodak 1D v3.5.3 software. The following primers were used:
Actin (forward: catcatgaagtgtgacgtgg; reverse: ata-ctcctgcttgctgatcc),
Thymosin b4 (forward: tgaacaggagaagcaagcag; re-verse: tagacagatgggaaaggcag),
Gelsolin (forward: acggctgaaggacaagaaga; reverse: ttccaacccagacaaagacc),
Profilin (forward: ggaggcggattgaataagaag; reverse: c-catcaccctgcattgctaa) and
Ribosomal Protein L32 (forward: aagaagttcatccggca-ccag; reverse: gcgatctcggcacagtaagat).
Western blot analysis
MSN cells were lysed in RIPA buffer (150 mM NaCl, 0.1% Triton X-100, 0.5% sodium deoxycholate, 0.1% so-dium dodecyl sulfate and 50 mM Tris-HCl, pH 8.0) with a protease inhibitor mixture and then centrifuged. Total pro-teins were quantified using a bicinchoninic acid kit (Ther-mo-Fisher Scientific Inc., Rockford, IL, USA). Equal amo-unts of protein were loaded onto a polyacrylamide gel and then transferred to a nitrocellulose or polyvinylidene fluo-ride membrane as required (Schägger, 2006). The mem-brane was blocked with 5% nonfat milk and 1% albumin in TBS and then sequentially incubated with a primary anti-body and horseradish peroxidase-conjugated secondary an-tibody. The primary antibodies employed were goat po-lyclonal anti-Thymosin b4 (1:2000), mouse monoclonal anti-Gelsolin (1:2000), rabbit polyclonal anti-Profilin 1/2 (1:2000), and mouse monoclonal anti-bTubulin (1:2000) (all Santa Cruz Biotechnology, Santa Cruz, CA, USA); the antibodies were dissolved in blocking solution and incu-bated at 37 °C for 1 h. Then, the membranes were washed with TBS-0.1% Tween-20 and incubated with the second-ary antibody. The secondsecond-ary antibodies employed were HRP-conjugated goat anti-rabbit, HRP-conjugated rabbit anti-goat and HRP-conjugated goat anti-mouse, all sup-plied by Zymed (San Francisco, CA, USA). The antibodies were dissolved in blocking solution and incubated at 37 °C for 1 h. The bands were visualized using the Amersham
ECL Western blotting detection reagents according to the manufacturer’s guidelines (GE Healthcare, Piscataway, NJ. USA).
Immunofluorescence
A total of 105MSN cells were seeded onto coverslips coated with 0.1% gelatin in a 12-well plate and incubated for 72 h or until sub-confluent. Then, the culture was gently washed with PBS buffer, the medium was renewed and the 5 and 12.5 mM BSO treatments were added. After 24 or 48 h of BSO treatment, the media was removed and the MSN cells were fixed with 4% paraformaldehyde and per-meabilized with PBS-0.2% Triton X-100. Prior to antibody incubation, the samples were blocked with 1% albumin and 5% fetal bovine serum in PBS. The primary antibodies em-ployed were mouse anti-b-Tubulin (1:50; Invitrogen), goat polyclonal anti-Thymosinb4 (1:50, Santa Cruz Biotechno-logy), mouse monoclonal anti-Gelsolin (1:50, Santa Cruz Biotechnology) and rabbit polyclonal anti-Profilin 1/2 (1:50, Santa Cruz Biotechnology). The antibodies were dis-solved in blocking solution and incubated at 37 °C for 1 h. Then, the coverslips were washed three times with PBS-0.2% Triton X-100 for 5 min. The secondary antibodies employed were FITC-goat anti-mouse (1:100, Invitrogen), FITC-goat anti-rabbit (1:100, Invitrogen) and FITC-bovine anti-goat (1:100, Santa Cruz Biotechnology). Alexa Fluor® 594 Phalloidin (1:50, Invitrogen) was also em-ployed to stain the actin filament, and 300 nM 4’,6-dia-midino-2-phenylindole (DAPI, Sigma-Aldrich) was used to counterstain the cell nuclei. All of the secondary antibod-ies were dissolved in blocking solution. The cells were in-cubated with the secondary antibodies and Alexa Fluor® 594 Phalloidin at 37 °C for 1 h; DAPI was added during the last 5 min of the secondary antibody incubation. Finally, the coverslips were washed three times with PBS-0.2% Tri-ton X-100 for 5 min, embedded in Dako Fluorescent Mounting Medium (Dako North America, Inc., Carpin-teria, CA, USA) and mounted onto slides. The slides were examined using an Axio Observer inverted microscope (Carl Zeiss, Oberkochen, Germany) coupled to a confocal laser scanning LSM 710 DUO from Carl Zeiss (Plan Apochromat 40X/1.3 oil objective). Images were acquired using the ZEN 2008 software (Carl Zeiss) and analyzed us-ing the Fiji image processus-ing package, which is distributed by ImageJ (Schindelinet al., 2012).
Statistical analysis
soft-ware to determine whether the BSO treatments were related to the changes in cell viability, ROS and lipid peroxidation.
Results
Expression of actin cytoskeleton genes in cells unable to synthesize GSH-GCS-2
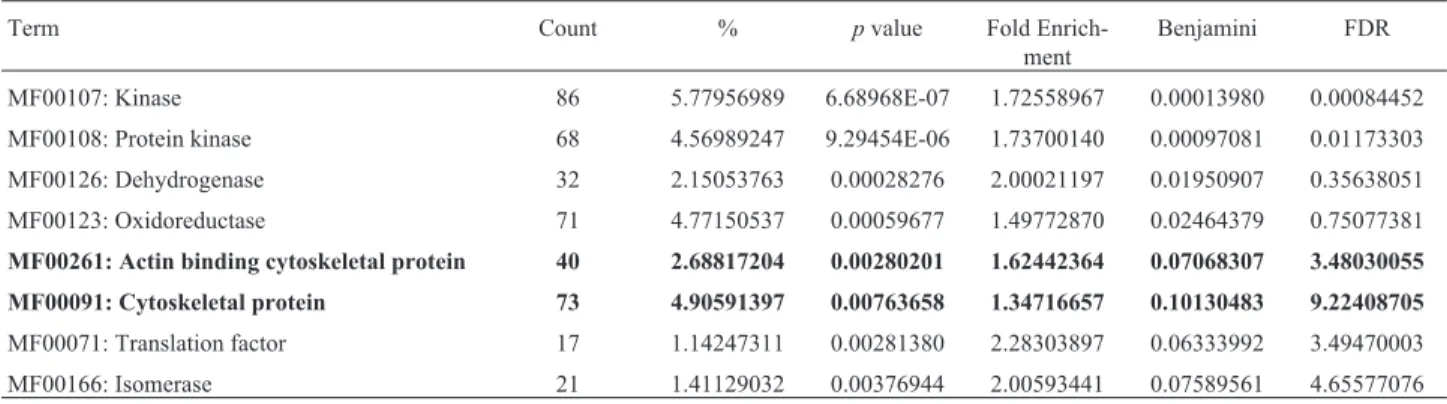
Global analysis of molecular functions in cells unable to synthesize GSH, obtained by the gene expression pat-terns and the number of genes involved with their respec-tivep-value is presented in Table 1.
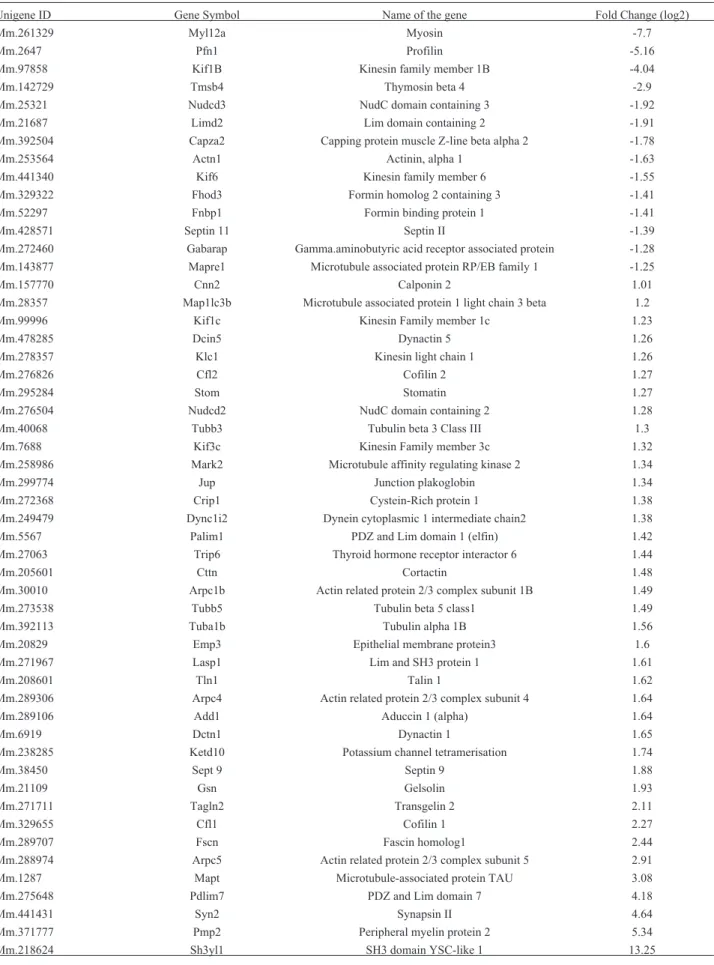
Expression analysis showed that the actin cytoske-leton pathway is largely impacted by GSH absence and that actin binding proteins, such as cofilin 1 and 2, fascin ho-molog and gelsolin, were overexpressed. In contrast, the thymosin B4, profilin and capping protein muscle z-line beta alpha-2 were underexpressed (Table 2).
Depletion of intracellular GSH levels
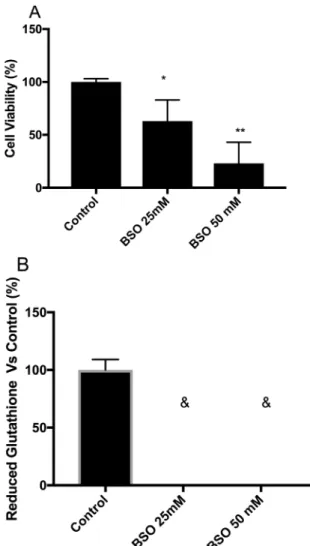
To achieve the maximum GSH depletion in the short-est amount of time, MSN cells were treated with 25 and 50 mM BSO for 24 h. We found significantly decreased cell viability and GSH levels at both concentrations (Figure 1A and 1B, respectively). Therefore, we tested lower BSO con-centrations (5 and 12.5 mM) without a cell viability effect (Table 3). The 5 and 12.5 mM BSO treatments for 24 h could decrease the GSH level to approximately 70% com-pared with the control (Table 3). Therefore, we used these conditions for the assays. After we set up the working BSO concentrations, we evaluated the cell viability and GSH level following treatment for 48 h. The BSO treatments did not affect the cell viability of the MSN cells (Table 3), and the intracellular GSH level was decreased to approximately 80% compared with the control (Table 3).
Absence of oxidative stress under GSH depletion
The redox state evaluation of MSN cells after BSO treatment was determined by measuring ROS levels and the end products of Lpx. It is important to emphasize that our
aim was to decrease intracellular GSH levels without initi-ating an oxidative stress state to establish the effect trigger by GSH depletion on the regulation of the actin cytoske-leton. ROS were measured by the generation of rhodamine 123 in MSN cells treated with 5 and 12.5 mM BSO for 24 and 48 h. No changes in the ROS level were found com-pared to the control condition, suggesting that the depletion of the intracellular GSH level did not induce ROS genera-tion (Table 3). Addigenera-tionally, we measured Lpx end prod-ucts and found that MSN cells treated with 5 and 12.5 mM BSO for 24 h were unable to generate Lpx end products; in contrast, a slight increase was observed after the 48 h treat-ment with 12.5 mM BSO. To ensure that the loss of GSH did not induce oxidative stress, we conducted a multiple linear regression analysis to evaluate the influence of ROS and Lpx due to GSH depletion by BSO treatment for cell vi-ability (Table 4). Neither ROS nor lipid peroxidation ap-peared to be necessary to predict cell viability. Thus, the detected ROS and Lpx levels did not affect cell viability, and non-oxidative stress generation could be inferred.
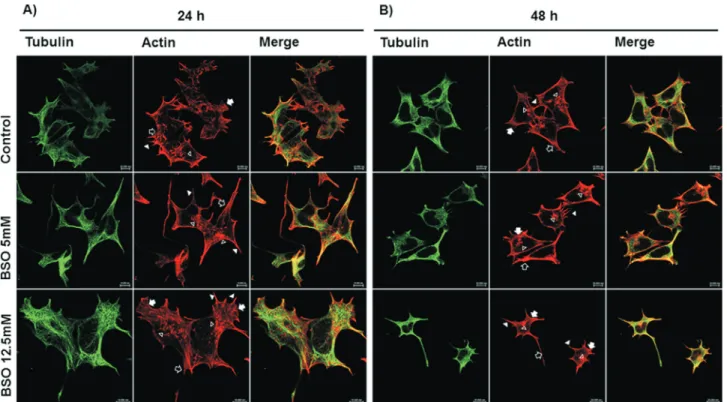
Glutathione depletion triggers changes in the cell shape
Confocal microscopy images showed drastic mor-phological changes in the MSN cells when GSH was de-pleted by the BSO treatments (Figure 2). After 24 h of GSH depletion, the actin confocal images showed that the con-trol cells displayed the characteristic cell shape and were polarized. Lamellipodia (arrow) with some cytoplasmic projections or filopodia (arrowhead) were observed at one end, whereas a cone shape (empty arrow) with a few cyto-plasmic projections and dot-shaped structures (empty ar-rowhead) that appeared to be focal adhesions was observed at the other end. In the confocal images of control cells the microtubules were clearly resolved as long fibers that were distributed throughout the cytoplasm to the cell periphery and delimited the space occupied by the nucleus. Actin con-focal images following the 5 mM BSO treatment showed the loss of the characteristic cell shape and changes in cell
Table 1- Analysis of molecular functions impacted by the lack of GSH in mouse embryonic cells GCS-2 by DAVID Bioinformatics Resources 6.8.
Term Count % pvalue Fold
Enrich-ment
Benjamini FDR
MF00107: Kinase 86 5.77956989 6.68968E-07 1.72558967 0.00013980 0.00084452
MF00108: Protein kinase 68 4.56989247 9.29454E-06 1.73700140 0.00097081 0.01173303
MF00126: Dehydrogenase 32 2.15053763 0.00028276 2.00021197 0.01950907 0.35638051
MF00123: Oxidoreductase 71 4.77150537 0.00059677 1.49772870 0.02464379 0.75077381
MF00261: Actin binding cytoskeletal protein 40 2.68817204 0.00280201 1.62442364 0.07068307 3.48030055
MF00091: Cytoskeletal protein 73 4.90591397 0.00763658 1.34716657 0.10130483 9.22408705
MF00071: Translation factor 17 1.14247311 0.00281380 2.28303897 0.06333992 3.49470003
MF00166: Isomerase 21 1.41129032 0.00376944 2.00593441 0.07589561 4.65577076
DAVID Bioinformatics Resources 6.8;Term: Enrichment terms associated with the gene list; Count: Gene involved in the term; % : involved genes / total
genes;p-value: modified Fisher exactp-value; Fold Enrichment: To globally correct enrichmentp-values of individual term members.; Benjamini and
Table 2- Analysis of gene expression involved in actin cytoskeleton pathway in mouse embryonic cells GCS-2 by DAVID Bioinformatics Resources 6.8.
Unigene ID Gene Symbol Name of the gene Fold Change (log2)
Mm.261329 Myl12a Myosin -7.7
Mm.2647 Pfn1 Profilin -5.16
Mm.97858 Kif1B Kinesin family member 1B -4.04
Mm.142729 Tmsb4 Thymosin beta 4 -2.9
Mm.25321 Nudcd3 NudC domain containing 3 -1.92
Mm.21687 Limd2 Lim domain containing 2 -1.91
Mm.392504 Capza2 Capping protein muscle Z-line beta alpha 2 -1.78
Mm.253564 Actn1 Actinin, alpha 1 -1.63
Mm.441340 Kif6 Kinesin family member 6 -1.55
Mm.329322 Fhod3 Formin homolog 2 containing 3 -1.41
Mm.52297 Fnbp1 Formin binding protein 1 -1.41
Mm.428571 Septin 11 Septin II -1.39
Mm.272460 Gabarap Gamma.aminobutyric acid receptor associated protein -1.28
Mm.143877 Mapre1 Microtubule associated protein RP/EB family 1 -1.25
Mm.157770 Cnn2 Calponin 2 1.01
Mm.28357 Map1lc3b Microtubule associated protein 1 light chain 3 beta 1.2
Mm.99996 Kif1c Kinesin Family member 1c 1.23
Mm.478285 Dcin5 Dynactin 5 1.26
Mm.278357 Klc1 Kinesin light chain 1 1.26
Mm.276826 Cfl2 Cofilin 2 1.27
Mm.295284 Stom Stomatin 1.27
Mm.276504 Nudcd2 NudC domain containing 2 1.28
Mm.40068 Tubb3 Tubulin beta 3 Class III 1.3
Mm.7688 Kif3c Kinesin Family member 3c 1.32
Mm.258986 Mark2 Microtubule affinity regulating kinase 2 1.34
Mm.299774 Jup Junction plakoglobin 1.34
Mm.272368 Crip1 Cystein-Rich protein 1 1.38
Mm.249479 Dync1i2 Dynein cytoplasmic 1 intermediate chain2 1.38
Mm.5567 Palim1 PDZ and Lim domain 1 (elfin) 1.42
Mm.27063 Trip6 Thyroid hormone receptor interactor 6 1.44
Mm.205601 Cttn Cortactin 1.48
Mm.30010 Arpc1b Actin related protein 2/3 complex subunit 1B 1.49
Mm.273538 Tubb5 Tubulin beta 5 class1 1.49
Mm.392113 Tuba1b Tubulin alpha 1B 1.56
Mm.20829 Emp3 Epithelial membrane protein3 1.6
Mm.271967 Lasp1 Lim and SH3 protein 1 1.61
Mm.208601 Tln1 Talin 1 1.62
Mm.289306 Arpc4 Actin related protein 2/3 complex subunit 4 1.64
Mm.289106 Add1 Aduccin 1 (alpha) 1.64
Mm.6919 Dctn1 Dynactin 1 1.65
Mm.238285 Ketd10 Potassium channel tetramerisation 1.74
Mm.38450 Sept 9 Septin 9 1.88
Mm.21109 Gsn Gelsolin 1.93
Mm.271711 Tagln2 Transgelin 2 2.11
Mm.329655 Cfl1 Cofilin 1 2.27
Mm.289707 Fscn Fascin homolog1 2.44
Mm.288974 Arpc5 Actin related protein 2/3 complex subunit 5 2.91
Mm.1287 Mapt Microtubule-associated protein TAU 3.08
Mm.275648 Pdlim7 PDZ and Lim domain 7 4.18
Mm.441431 Syn2 Synapsin II 4.64
Mm.371777 Pmp2 Peripheral myelin protein 2 5.34
polarity, including large cytoplasmic projections along the cell surface, the presence of both lamellipodia (arrow) and filopodia (arrowhead) and dot-shaped structures (empty ar-rowhead) near the projections. In contrast, the microtubules showed the same characteristics and distribution as the con-trol treatment. Following the 12.5 mM BSO treatment, the actin confocal images showed drastic changes in cell polar-ity, with the presence of lamellipodia (arrow), many filo-podia (arrowhead) and several dot-shaped structures (emp-ty arrowhead). A large filopodium that resembled a neurite (in this case an axon) was observed at one end of the cell. Conversely, the microtubules remained unchanged in st-ructure and organization. The microtubules in both the con-trol and GSH-depleted conditions showed changes in dis-tribution that corresponded to the changes in cell shape due to the actin cytoskeletal rearrangements (Figure 2A).
After the 48 h treatments, the actin filaments and microtubules in the MSN control cells showed a similar pattern to that described following the 24 h control ment. In the confocal images of the 48 h 5 mM BSO treat-ment, the loss of the characteristic cell shape present in the MSN control cells was evident, with dramatic polarity changes, retraction of the cytoplasm resulting in a round shape, cytoplasmic projections (filopodia, arrowhead) that extended beyond the leading edge of the membrane and the marked presence of dot-shaped structures (empty
arrow-Figure 1- Maximum depletion of intracellular GSH levels generate ef-fects on survival. (A) Cell viability of MSN cells treated with high concen-trations of buthionine sulfoximine, BSO, (25 and 50 mM) for 24 h as-sessed by fluorescein diacetate/ethidium bromide (FDA/EtBr) dual fluorochrome staining. (B) Corresponding intracellular GSH levels of
MSN cells treated with BSO (&: not detected) determined
fluorometrically (estimated limit of detection for the fluorometric method was 0.31 nmol of GSH/mg of protein). Statistical significance was deter-mined by Student’st-test. *p<0.05, **p<0.01. Experiments were per-formed three times.
Table 3- Absence of oxidative stress under GSH depletion.
Hoursa Treatment Cell viabilityb, c GSHb, d ROSb, e LPxb, f
Control 100.00±4.82 100.00±9.05 100.00±6.95 100.00±14.02
24 BSO 5 mM 105.40±2.88 31.33±6.03* 106.75±10.03 82.21±22.06
BSO 12.5 mM 102.35±0.36 23.21±6.23* 100.91±12.87 104.26±19.08
Control 100.00±0.74 100.00±6.05 100.00±6.95 100.00±14.02
48 BSO 5 mM 92.21±5.07 15.45±6.10* 109.50±9.35 103.61±19.59
BSO 12.5 mM 89.14±0.36 18.21±5.09* 113.06±13.96 128.81±19.74
aLength of treatment in hours.bData are expressed as the percentage with respect to controls±standard error.cCell viability after BSO treatments assessed
by FDA/EtBr dual fluorochrome stain.dGSH values determined by o-phthalaldehyde (OPT) method after BSO treatment.eROS: reactive oxygen species;
ROS were measured by the generation of rhodamine 123 in MSN cells after BSO treatment. ROS positive control (Cadmium chloride 50mM, 2 h): 138.29
±13.55.fLPx: Lipid peroxidation; LPx level assessed with the TBARS method using a MDA curve in MSN cells after treatment with BSO. Experiments
were performed three to seven times. * Student’st-test;p<0.01 versus control.
Table 4- Multivariate analysis of oxidative stress markers with cell viabil-ity.
Multiple linear regression
Coefficient Standard Error p VIFa
Constant 139.162 50.107 0.069
ROSb -0.222 0.568 0.722 2.425
LPxc -0.153 0.118 0.284 2.425
a
head). No changes were observed in the microtubules. Af-ter the 48 h 12.5 mM BSO treatment, the MSN cells showed changes similar to those observed after the 48 h 5 mM BSO treatment: the cytoplasm retracted and became rounded, filopodia (arrowhead) were present along the cell periphery and in some cells a neurite axon-like structure was very evi-dent and gave the cells a neuron-like shape (empty arrow). No important changes were evident in the structure or the organization of the microtubules, however they exhibited changes in distribution corresponding to the actin cytos-keletal rearrangements and the changes in cell shape (Figure 2B).
Comparison of cell shapes
To visualize the changes in cell shape in the confocal images we used the image processing package Fiji (distrib-uted by ImageJ) to isolate 25 images of the predominant cell shapes in the control and BSO treatments. For this, we used the actin confocal images. Figure 3 shows the predom-inant cell shapes in the control conditions (24 and 48 h, up-per panel). In these images, the cells are polarized, one end has a lamellipodium (arrow) with some cytoplasmic pro-jections or filopodia (arrowhead), and the far end has a cone shape (empty arrow) with a few filopodia (arrowhead). In contrast, the different BSO treatments (lower panel) re-sulted in the constant (approximately 70% of the cells) and very evident loss of the characteristic cell shape, dramatic changes in polarity, more evident cytoplasmic projections,
either lamellipodia (arrow) or filopodia (arrowhead) and in some cases the filopodia resembles an axon (empty arrow) and gives the cell a neuron-like cell shape (lower panel).
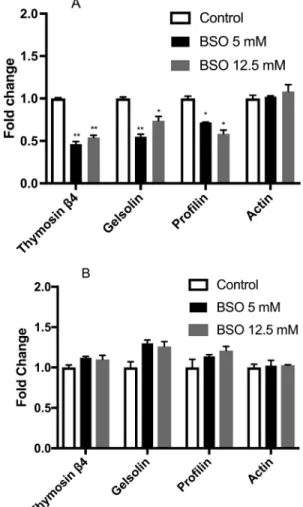
Gene expression levels of actin-binding proteins under GSH depletion
Gene expression of the actin-binding proteins thy-mosinb4, gelsolin, profilin and actin was evaluated after treatment with 5 and 12.5 mM BSO for 24 and 48 h. The GSH depletion for 24 h induced an important decrease in the expression of thymosin b4, gelsolin and profiling
Figure 2- Comparative morphological changes induced by 24 and 48 h BSO treatments. Confocal microscopy images of MSN cells showing that the 48 h BSO treatments caused more drastic morphological changes compared to the 24 h BSO treatments. Panel A corresponds to Control, BSO 5 mM and BSO 12.5 mM 24 h treatments; Panel B corresponds to Control, BSO 5 mM and BSO 12.5 mM 48 h treatments. Microtubules were visualized by staining with
FITC-labeledb-Tubulin (mouse anti-b-tubulin/FITC-goat anti-mouse), and actin filaments were visualized by staining with Alexa Fluor® 594
Phalloidin-labeled F-actin. The bar represents 10mm 40X. Arrow: lamellipodia; arrowhead: filopodia; empty arrow: cone shape; empty arrowhead:
cyto-plasmic projections and dot-shaped structures.
(Figure 4A). However, 48 h of GSH depletion show that this sub-expression is lost (Figure 4B).
Protein expression levels of actin-binding proteins under GSH depletion
The protein expression of thymosinb4, gelsolin, pro-filin and actin were evaluated after treatment with 5 and 12.5 mM BSO for 24 and 48 h. Analysis showed that gelsolin and thymosinb4 had a 20% reduction in their ex-pression at 24 h after 5 mM treatment. For the treatment with 12.5 mM, however, we only observed an effect on the profilin protein. For 48 h of treatment with 5 mM, we ob-served only a slight decrease for thymosinb4 and profilin (Figure 5A,B).
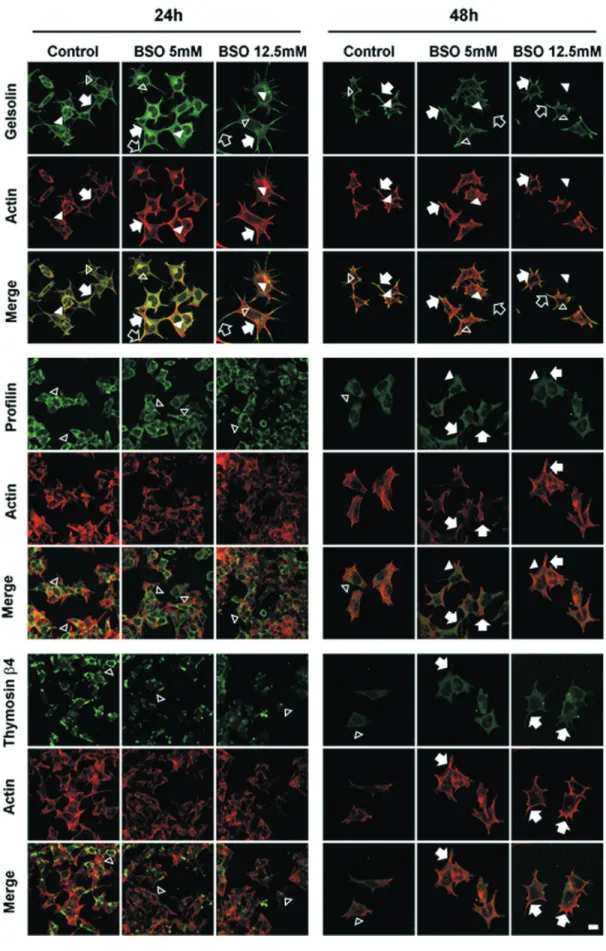
Cell localization of actin-binding proteins: thymosin b4, gelsolin and profilin
We performed an immunofluorescence analysis of thymosinb4, gelsolin and profilin for a comparison with
the actin filament distributions (Figure 6). After 24 h treat-ment, gelsolin was widely distributed in both the cytoplasm and cytoplasmic projections of the control cells (either lamellipodia or filopodia). In the cytoplasm, we found gelsolin both free (empty arrowhead) and somewhat localized with actin filaments (arrowhead), whereas it co-localized with actin filaments when near the membrane and cytoplasmic projections (arrow). After the 5 and 12.5 mM BSO treatments, gelsolin was found free in the cytoplasm (empty arrowhead) and co-localized with actin filaments, similar to the control cells (arrowhead). However, near the cell membrane and in the cytoplasmic projections, gelsolin was strongly co-localized with the actin filaments. This co-localization was more evident in the cytoplasmic pro-jections (arrow). Notably, in the BSO treatments, espe-cially with 12.5 mM, free gelsolin was present at the distal ends of the projections (empty arrow). After 48 h in the control cells, gelsolin was distributed in both the cytoplasm and the cytoplasmic projections; some cytoplasmic gelsolin was free (empty arrowhead), whereas it was found co-localized with actin filaments near the cell membrane (ar-rowhead) and in the cytoplasmic projections (arrow). After 48 h in the 5 and 12.5 mM BSO treatments, gelsolin was distributed in the cytoplasm (empty arrowhead), in the vi-cinity of the cell membrane (arrowhead) and in the cyto-plasmic projections (arrow). Its co-localization with actin
Figure 4- Gene expression. (A) Gene expression in MSN cells treated with 5 and 12.5 mM BSO for 24 h (black and grey bars, respectively). (B) Gene expression in MSN cells treated with 5 and 12.5 mM BSO for 48 h (black and grey bars, respectively). The bars represent fold changes versus the control (open bars); all control values are set to 1. All data were
previ-ously normalized to the housekeeping geneRPL32. Statistical
signifi-cance was determined by Student’st-test. *p<0.05. Experiments were per-formed three times.
Figure 6- Cell distribution of the actin-binding proteins gelsolin, profilin and thymosinb4. Gelsolin was stained with mouse anti-Gelsolin/FITC-goat
anti-mouse (green), Profilin was stained with rabbit anti-Profilin/FITC-goat anti-rabbit (green), Thymosinb4 was stained with goat anti-Thymosin
b4/FITC-rabbit anti-goat (green) and actin filaments were stained with Alexa Fluor® phalloidin (red), 40X. Arrows: lamellipodia; arrowheads: filopodia;
filaments was more evident in the cytoplasmic projections, where it strongly co-localized with the actin filaments (ar-row). Similar to the 24 h treatments, free gelsolin was pres-ent at the distal end of the cytoplasmic projections or filopodia (empty arrow).
After 24 h of treatments, profilin showed a similar distribution in both the control cells and the cells treated with 5 and 12.5 mM BSO. Profilin was confined in the cy-toplasm located away from the cell membrane and did not co-localize with the actin filaments (empty arrowhead). Af-ter 48 h of treatment, the control cells exhibited the same behavior, with the protein confined to the cytoplasm with-out reaching the region of the cytoplasmic membrane (empty arrowhead). In contrast, the distribution of the pro-tein became more widespread in the cells treated with 5 and 12.5 mM BSO (arrowhead), even reaching the cell mem-brane and co-localizing with actin filaments (arrow).
Thymosinb4 distribution in the control cells was re-stricted to the cytoplasm, and no co-localization with actin filaments was observed (empty arrowhead), after 24 h of 5 and 12.5 mM BSO treatments, Thymosinb4 also showed the same distribution in the cytoplasm as the control cells (empty arrowhead). After 48 h of treatment, thymosinb4 in the control cells was distributed in the cytoplasm (empty ar-rowhead). However, after treatment with 5 and 12.5 mM, the distribution of thymosinb4 reached the cytoplasmic projections and was co-localized with the actin filaments (arrow).
Discussion
Considering the essential role of glutathione in physi-ological cell functions and from the predictions obtained from genomic analysis in GCS-2 cells, unable to synthesize GSH (Rojas et al., 2003; Valverde et al., 2006), it was shown that the remodeling of the actin cytoskeleton and ac-cessory pathways are regulated by the tripeptide. To test this hypothesis we evaluated the role of GSH in regulating the actin cytoskeleton in neuroblastoma MSN cells. We as-sessed the 5 and 12.5 mM BSO concentrations, which de-pleted GSH by 70% but did not affect cell viability at 24 or 48 h. These results show that MSN cells are more sensitive to GSH depletion than other tissues (such as those in the kidney or liver) and agree with previous research (Sta-bel-Burowet al., 1997).
BSO treatment triggers a consistent but not complete GSH depletion. According to the literature, the GSH deple-tion was partial, suggesting that two pools of GSH are pres-ent in MSN cells: one that is easily depleted by BSO and another that is more resistant to depletion (Chen et al., 2005). This finding supported the existence of two sources of GSH.
Having demonstrated the decrease in intracellular GSH levels, we evaluated the redox state in MSN cells after treatment with BSO by measuring the ROS levels and end products of lipid peroxidation. Notably, our aim was to de-crease the intracellular GSH level without reaching
oxida-tive stress to determine the role of GSH in regulating the actin cytoskeleton because oxidative stress has already be-en demonstrated to alter the actin cytoskeleton (Fiaschiet al., 2006; Johansson and Lumberg, 2007; Pierozanet al., 2016).
No changes in the ROS level were found compared to the control condition, suggesting that the depletion of the intracellular GSH level did not induce ROS generation (Table 3). Additionally, we measured lipid peroxidation end products and found that MSN cells treated with 5 and 12.5 mM BSO for 24 h were unable to generate lipid peroxidation end products; in contrast, a slight increase was observed after the 48 h treatment with 12.5 mM BSO. To ensure that the loss of GSH did not induce oxidative stress, we conducted a multiple linear regression analysis to evalu-ate the influence of ROS and lipid peroxidation due to GSH depletion by BSO treatment on cell viability (Table 4). The analysis showed that neither ROS nor lipid peroxidation appeared to be necessary to predict cell viability.
Thus, the detected ROS and lipid peroxidation levels did not affect cell viability and non-oxidative stress genera-tion could be inferred. This agrees with Franco and Cidio-swki (2009), as well as Hanet al.(2007), who support the notion of a direct role for GSH independent from oxidative stress. ROS overload may simply be an epiphenomenon as-sociated with the depletion of GSH.
GSC-2 microarray data and MSN gene and protein expression results confirms that the lack of intracellular GSH modulate the gene expression of thymosinb4, gel-solin and profilin. We observed an important decrease in the expression of these genes. However, the microarray data indicated only the down-regulation of thymosin b4 and profilin, while gelsolin was up-regulated. This discrep-ancy could be due to different cell types used in each study (blastocysts and neuroblasts), or because blastocyst cells were unable to synthesize GSH, with approximately 2% of the normal amount of GSH. Our study never reached the levels of GSH inhibition obtained by previous research (Shi
et al., 2000). The same behavior was observed at the protein level, where we observed only a discrete 20% reduction at 24 h that was absent at 48 h.
The confocal microscopy images showed drastic morphological changes in MSN cells when GSH was de-pleted by BSO treatment. We stained actin filaments and microtubules (another important component of the keleton) to visualize the distribution of the actin cytos-keleton and, therefore, the cell shape compared to the mi-crotubule distribution. Actin filaments are abundant beneath the plasma membrane, where they form a network and extend throughout the cytoplasm. The control cells showed a characteristic cell shape and were polarized: a lamellipodium and some filopodia were present at one end, while the far end had a cone shape and focal adhesions were present.
both lamellipodia and filopodia were present and focal ad-hesions with a re-localization of thymosinb, gelsolin and profilin proteins were detected. Moreover, the cells con-tained a neurite-like structure. In this case, the structure re-sembled an axon due to the neuronal origin of the MSN cells. These observations agree with our previous results (Ramos-Espinosaet al., 2012) and with Mollinari et al.
(2009), which showed enhanced neurite outgrowth accom-panied by increased focal adhesions due to the down-re-gulation of thymosinb4.
To visualize the changes described above, we used the image processing package Fiji to analyze 25 representa-tive images of the cell shapes in the control and BSO-treated cells. The predominant cell shapes in the control conditions were polarized with a lamellipodium, with filo-podia present at one end, whereas the far end had a cone shape. However, the different BSO treatments resulted in the constant and evident loss of the characteristic cell sha-pe, dramatic polarity changes, more evident cytoplasmic projections, the presence of either lamellipodia or filopodia and in some cases filopodia that resembled an axon that gave the cell a neuron-like cell shape. The drastic changes induced by the BSO treatments went beyond the ultra-structure of the actin cytoskeleton. Notably, we found that GSH depletion could alter the regulation of actin cytoske-leton dynamics, thereby causing the formation of neurites in cultured MSN cells. Notably, these changes did not oc-cur in an undifferentiated cell culture, eliminating a possi-ble effect of BSO per se. The neurite formation process is regulated in complex ways. Its growth and guidance de-pend on well-coordinated cytoskeletal dynamics and occur in conjunction with differentiation and plasticity processes (Wilsonet al., 2016). Thus, these results suggest that a de-crease in the intracellular GSH content can affect processes involved in the signaling pathway that regulates neurite growth (Bradke and Dotti, 2000a,b; Luo, 2002; Madduri
et al., 2009; Wilsonet al., 2016).
In conclusion, GSH depletion produced a downre-gulation of the actin binding proteins profilin, thymosinb4 and gelsolin after 24 h BSO treatments. This down-re-gulation appears to be sufficient to trigger important chan-ges in their localization and cellular shape in a non-oxi-dative stress-dependent manner. These results are relevant because exposures to xenobiotics could decrease the levels of GSH and could represent a cofactor that triggers changes in the cytoskeleton to facilitate the acquisition of several disease hallmarks including those related to cancer and neurodegenerative diseases.
Acknowledgments
We thank Dr. Miguel Tapia from the Unidad de Microscopia del Instituto de Investigaciones Biomedicas for his confocal technical assistance and helpful comments. This work was supported by PAPIIT (IN214410). NZF is a recipient of the CONACyT scholarship 231665 and grate-fully acknowledges the Programa de Doctorado en
Cien-cias Biomédicas, Universidad Nacional Autónoma de Mé-xico. This publication is part of his doctoral thesis. We thank the technical support of Dr. Maria Alexandra Ro-dríguez-Sastre.
References
Abemayor E and Sidellt N (1989) Human neuroblastoma cell lines as models for the in vitro study of neoplastic and neuronal cell differentiation. Environ Health 80:3–15. Arias C, Sharma N, Davies P and Shafit-Zagardo B (1993)
Oka-daic acid induces early changes in microtubule-associated protein 2 and tau phosphorylation prior to neurodegenera-tion in cultured cortical neurons. J. Neurochem 61:673-682. Bains JS and Shaw C (1997) Neurodegenerative disorders in
hu-mans: The role of glutathione in oxidative stress-mediated neuronal death. Brain Res Rev 25:335–358.
Becker A and Soliman KF (2009) The role of intracellular glu-tathione in inorganic mercury-induced toxicity in neuro-blastoma cells. Neurochem Res 34:1677-1684.
Birbach A (2008) Profilin, a multi-modal regulator of neuronal plasticity. BioEssays 30:994–1002.
Bouaïcha N and Maatouk I (2004) Microcystin-LR and nodularin induce intracellular glutathione alteration, reactive oxygen species production and lipid peroxidation in primary cul-tured rat hepatocytes. Toxicol Lett148:53–63.
Bradke F and Dotti CG (2000a) Differentiated neurons retain the capacity to generate axons from dendrites. Curr Biol 10:1467–1470.
Bradke F and Dotti CG (2000b) Establishment of neuronal polar-ity: Lessons from cultured hippocampal neurons. Curr Opin Neurobiol10:574–581.
Browne RW and Armstrong D (1998) Reduced glutathione and glutathione disulfide. Methods Mol Biol 108:347–352. Camera E and Picardo M (2002) Analytical methods to
investi-gate glutathione and related compounds in biological and pathological processes. J Chromatogr B Analyt Technol Biomed Life Sci 781:181–206.
Chen HHW and Tien Kuo M (2010) Role of glutathione in the regulation of cisplatin resistance in cancer chemotherapy. Metal-based Drugs 430939-7.
Chen J, Small-Howard A, Yin, A and Berry MJ (2005) The re-sponses of Ht22 cells to oxidative stress induced by bu-thionine sulfoximine (BSO). BMC Neurosci 6:10.
Cui X, Zhang S, Xu Y, Dang H, Liu C, Wang L, Yang L, Hu J, Liang W, Jiang J,et al.(2016) PFN2, a novel marker of un-favorable prognosis, is a potential therapeutic target in-volved in esophageal squamous cell carcinoma. J Translat Med 14:137.
Dedova IV, Nikolaeva OP, Safer D, De La Cruz EM and dos Remedios CG (2006) Thymosin beta4 induces a confor-mational change in actin monomers. Biophys J 90:985–992. Dringen R (2000) Metabolism and functions of glutathione in
brain. Progr Neurobiol 62:649–671.
Fiaschi T, Cozzi G, Raugei G, Formigli L, Ramponi G and Chiarugi P (2006) Redox regulation of beta-actin during in-tegrin-mediated cell adhesion. J Biol Chem 281:22983–22991.
Franco R and Cidlowski J (2009) Apoptosis and glutathione: Be-yond an antioxidant. Cell Death Diff 16:1303–1314. Fu X, Cui P, Chen F, Xu J, Gong L, Jiang L, Zhang D and Xiao Y
via the induction of epithelial-mesenchymal transition. Mol Med Rep 12:127-132.
Han YH, Kim SZ, Kim SH and Park WH (2007) Apoptosis in pyrogallol-treated Calu-6 cells is correlated with the chan-ges of intracellular GSH levels rather than ROS levels. Lung Cancer 59:301–314.
Hartmann A and Speit G (1997) The contribution of cytotoxicity to DNA-effects in the single cell gel test (comet assay). Toxicol Lett 90:183–188.
Hertzog M, van Heijenoort C, Didry D, Gaudier M, Coutant J, Gigant B, Didelot G, Préat T, Knossow M, Guittet E and Carlier MF (2004) The beta-thymosin/WH2 domain; struc-tural basis for the switch from inhibition to promotion of actin assembly. Cell 117:611–623.
Huang DW, Sherman BT and Lempicki RA (2009) Systematic and integrative analysis of large gene list using DAVID bioinformatics resources. Nat Protoc. 4:44-57.
Johansson M and Lundberg M (2007) Glutathionylation of beta-actin via a cysteinyl sulfenic acid intermediary. BMC Biochem 8:26.
Kedrin D, van Rheenen J, Hernandez L, Condeelis J and Segall JE (2007) Cell motility and cytoskeletal regulation in invasion and metastasis. J Mamm Gland Biol Neoplasia 12:143–152. Kleinman WA and Richie Jr JP (1995) Determination of thiols
and disulfides using high-performance liquidchromatogra-phy with electrochemical detection. J Chromatogr B Bio-med Appl 72:73-80.
Ko L, Odawara T and Yen SH (1997) Menadione-induced tau dephosphorylation in cultured human neuroblastoma cells. Brain Res 760:118-128.
Lee CW, Vitriol EA, Shim S, Wise AL, Velayutham RP and Zheng, JQ (2013) Dynamic localization of G-actin during membrane protrusion in neuronal motility. Curr Biol 23:1046-1056.
Lee VM, Quinn P, Jennings S and Ng L (2003) NADPH oxidase activity in preeclampsia with immortalized lymphoblasts used as models. Hypertension 41:925–931.
Li C and Wong WH (2001) Model-based analysis of oligonucleo-tide arrays: Expression index computation and outlier detec-tion. Proc Natl Acad Sci U S A 98: 31-36.
Lorente G, Syriani E and Morales M (2014) Actin filaments at the leading edge of cancer cells are characterized by a high mo-bile fraction and turnover regulation by profilin I. PLoS One 9:e85817.
Luo L (2002) Actin cytoskeleton regulation in neuronal morpho-genesis and structural plasticity. Annu Rev Cell Dev Bi-ol18:601–635.
Madduri S, Papaloizos M and Gander B (2009) Synergistic effect of GDNF and NGF on axonal branching and elongation in vitro. Neurosci Res 65:88–97.
McMurray CT (2000) Neurodegeneration: Diseases of the cy-toskeleton? Cell Death Diff 7:861–865.
Mollinari C, Ricci-Vitiani L, Pieri M, Lucantoni C, Rinaldi AM, Racaniello M, De Maria R, Zona C, Pallini R, Merlo D and Garaci E (2009) Downregulation of themosinb4 in neural progenitor grafts promotes spinal cord regeneration. J Cell Sci 122:4195- 4207.
Pierozan P, Biasibetti H, Schmitz F, Avila H, Fernandes CG, Pesooa-Pureur R and Wyse AT (2016) Neurotoxicity of methylmercury in isolated astrocytes and neurons: the cytos-keleton as a main target. Mol Neurobiol 54:5752-5767. Ramaekers F and Bosman F (2004) The cytoskeleton and disease.
J Pathol 204:351–354.
Ramos-Espinosa P, Rojas E and Valverde M (2012) Differential DNA damage response to UV and hydrogen peroxide de-pending of differentiation stage in a neuroblastoma model. Neurotoxicology 33:1086–1095.
Reynolds CP, Biedler JL, Spengler BA, Reynolds DA, Ross RA, Frenkel EP and Smith RG (1986) Characterization of human neuroblastoma cell lines established before and after ther-apy. J Natl Cancer Inst 76:375–387.
Rojas E, Shi ZZ, Valverde M, Paules RS, Habib GM and Lie-berman MW (2003) Survival and changes in gene expres-sion in cells unable to synthesize glutathione. BioFactors 17:13–19.
Schägger H (2006). Tricine-SDS-PAGE. Nat Protoc 1:16–22. Schindelin J, Arganda-Carreras I, Frise E, Kaynig V, Longair M,
Pietzsch T, Preibisch S, Rueden C, Saalfed A, Schmid Bet al. (2012) Fiji: An open-source platform for biological-image analysis. Nat Methods 9:676–682.
Shi ZZ, Osei-Frimpong J, Kala G, Kala SV, Barrios RJ, Habib GM, Lukin DJ, Danney CM, Matzuk MM and Lieberman MW (2000) Glutathione synthesis is essential for mouse de-velopment but not for cell growth in culture. Proc Natl Acad Sci U S A 97:5101–5106.
Siddik ZH (2003). Cisplatin: Mode of cytotoxic action and molec-ular basis of resistence. Oncogene 22:7265-7279.
Stabel-Burow J, Kleu A, Schuchmann S and Heinemann U (1997) Glutathione levels and nerve cell loss in hippocampal cul-tures from trisomy 16 mouse- a model of Down syndrome. Brain Res 765:313-318.
Sun HQ, Yamamoto M, Mejillano M and Yin HL (1999) Regula-tory protein. J Biol Chem 274:33179–33182.
Valverde M, Rojas E, Kala SV, Kala G and Lieberman MW (2006) Survival and cell death in cells constitutively unable to synthesize glutathione. Mutat Res 594:172–180. Wang D and Lippard SJ (2005) Cellular processing of platinium
anticancer drugs. Nat Rev Drug Discov 4:307-320 Wilson C, Terman JR, Gonzalez-Billault C and Ahmed G (2016)
Actin filaments - a target for redox regulation. Cytoskeleton 73:577–595.
Winder SJ and Ayscough KR (2005) Actin-binding proteins. J Cell Sci 118:651–654.
Ying GX, Liu X, Wang WY, Wang Y, Dong JH, Jin HF, Huang C and Zhou CF (2004) Regulated transcripts in the hippocam-pus following transections of the entorhinal afferents. Bio-chem Biophys Res Commun 322:210–216.
Associated Editor: Carlos F.M. Menck