Abstract
Submitted: March 5, 2018 Modification: May 11, 2018 Accepted: June 7, 2018
Correlation of salivary immunoglobulin
A with Body Mass Index and fat
percentage in overweight/obese
children
Obesity is considered a risk factor for periodontal health due to the low-grade inflammation promoted by the increased adipose tissue. Objective: This study aimed to determine correlations and associations between gingival inflammation (Simplified Oral Hygiene Index, and Gingival Index), salivary immunoglobulin A (s-IgA), and salivary parameters (salivary flow and osmolality) in normal-weight and overweight/obese children. Material and Methods: Ninety-one children, aged 6 to 12 years old (8.6±1.9 years), were divided into two groups according to their body mass index (BMI), circumferences, skinfold measurements and body fat percentage: normal-weight group (NWG; n=50) and overweight/obese group (OG; n=41). A calibrated examiner performed the clinical examination using the Simplified Oral Hygiene Index, Gingival Index, and salivary collection. Data analysis included descriptive statistics and association tests (p<0.05). Results: OG presented statistically higher s-IgA values compared with NWG, especially among the obese children (p<0.05). Significant positive correlations between s-IgA and salivary osmolality in OG (p<0.05), and between s-IgA and BMI values (p<0.05) and body fat percentage (p<0.05) were observed among all the children. Effect size varied from moderate for s-IgA values (d=0.57) to large for BMI (d=2.60). Conclusion: Gingival inflammation and salivary parameters were similar for NWG and OG; however, s-IgA presented higher values in OG, with correlations between BMI and body fat percentage.
Keywords: Gingivitis. Saliva. Pediatric obesity. Mayra Manoella PEREZ1
Juliana Souza PESSOA1
Ana Lídia CIAMPONI2
Michele Baffi DINIZ1
Maria Teresa Botti Rodrigues SANTOS1
Heloísa Helena de Oliveira ALVES3
Renata GORJÃO3
Renata Oliveira GUARÉ1
1Universidade Cruzeiro do Sul, Programa de Pós-Graduação em Odontologia, São Paulo, São Paulo,
Brasil.
2Universidade de São Paulo, Faculdade de Odontologia, Departamento de Ortodontia e
Odontopediatria, São Paulo, São Paulo, Brasil.
3Universidade Cruzeiro do Sul, Programa Interdisciplinar de Pós-Graduação em Ciências da Saúde,
Instituto de Ciências da Atividade Física e Esporte, São Paulo, São Paulo, Brasil.
Introduction
The prevalence of obesity has increased in recent
decades and is a public health concern, given that
this condition is an important risk factor for the onset
of several systemic diseases.1 In addition, obesity
can alter the production and release of important
defense cells, such as neutrophils, recognized as the first line of defense for periodontal tissues, and T and B lymphocytes, responsible for cellular and humoral responses.2 The inflammatory state is reflected by
an increase in circulating levels of proinflammatory
proteins and occurs not only in adults but also in
children and adolescents. Inflammatory mediators
are secreted by the adipose tissue and the immune
system, which can lead to a hyperinflammatory state.3,4
Most oral inflammatory diseases seem to originate locally, but present predisposing systemic factors.5
Thus, obesity is considered a risk factor for periodontal health.6 Although systematic reviews of the literature
have observed a higher prevalence of periodontal
disease in obese adults,7 few studies have investigated
periodontal health in overweight/obese children
and adolescents.3,8 Gingivitis is widely prevalent in
subjects of all ages, including children and adolescents, and usually precedes periodontitis.9 Thus, general
practitioners should be aware of the link between
obesity and periodontal health.10 A recent systematic
review and meta-analysis suggested periodontal
alterations might be associated with obesity in
children.1
Salivary immunoglobulins play an important role in inflammatory diseases of the oral mucosa.5
Salivary immunoglobulin A secretion has a protective effect against oral bacteria, inhibiting the adhesion of microorganisms to the surface of mucosal cells,
thus preventing their penetration into the organic
tissues.5,11 Studies have been suggesting an elevated
s-IgA level is associated with a lower risk of developing
gingivitis;12 however, studies on this association in
children remain scarce. In addition, studies have
shown chronic stress promotes a decrease in s-IgA in
children.13 Therefore, s-IgA is an important biomarker
of immune imbalances in children and may be related
to oral disease development.
There is a known association between obesity
and inflammation,8 and periodontal disease is a rare
finding in children.10 Therefore, the purpose of this
study was to determine correlations and associations
between gingival inflammation, s-IgA, and salivary
parameters in normal-weight and overweight/obese
children classified according to Body Mass Index(BMI),
skinfold measurements, and fat percentage. The
hypothesis is that overweight/obese children present
greater gingival inflammation and different salivary parameters compared with normal-weight children.
Materials and methods
Ethical statement
This study was approved by the local Research Ethics Committee under protocol CE-UCS-031/2012 (Cruzeiro do Sul University).
Sample selection
The study population consisted of children who
sought dental care at a dental school in São Paulo, SP, Brazil, from October 2014 to May 2016. Healthy children of both genders, aged 6 to 12 years old, in the mixed-teething phase were selected. They were divided into two groups: normal weight group (NWG) and an overweight/obese group (OG), based on anthropometric assessments.
The exclusion criteria were: children who had any type of infection, diabetes, and leukemia, as well as asthmatic bronchitis; those who were administered
any drug that could interfere with salivary secretion
(anticholinergics, neuroleptics, and benzodiazepines) at least 72 h before salivary collection; and those who refused to cooperate with data collection.
Sample size was based on a previous study by Modéer, et al.3 (2011) on obesity and periodontal risk
factors in adolescents. This was calculated at a 95% confidence interval and a study power of 80%. The OpenEpi software (http://www.openepi.com) was used, and a sample size of 52 children per group was
calculated.
Short talks were held with the children’s parents or guardians to explain the project and the importance of nutritional and dental assessment. Parents/guardians
were interviewed to complete a medical history
questionnaire, to identify possible health problems.
The research was carefully explained to the parents/
guardians of the participants, who signed a term of free, informed consent.
for saliva collection, oral cavity examinations, and bioimpedance, according to availability of the children and their parents/guardians. Children who required dental treatment were attended at the university.
Body Composition Assessments
Body composition assessments were performed
by a trained and calibrated examiner (intraclass correlation coefficient >0.9), who has significant experience in the field (R.G.).
To calculate the BMI (mass/height2), height
was measured with a portable vertical stadiometer
(Personal Sanny®, São Bernardo do Campo, SP, Brazil),
2 m in length, accurate to 0.1 cm. Body mass (kg) was measured with an electronic scale, accurate to 100 g. BMI was calculated using the formula: BMI= body weight (kg)/height² (m). For the nutritional profile, benchmarks in z score based on BMI curves
for boys and girls proposed by the World Health Organization (WHO) in 200714 were used: z score
<85 was designated as normal weight, z score of 85 to 97 was designated as overweight, and >97 was designated as obese.
A measuring tape, accurate to 1 mm, was used to determine the following body circumferences: forearm, abdomen, hip, waist, and calf. An adipometer (Sanny®,
São Bernardo do Campo, SP, Brazil) accurate to 0.5 mm, was used to measure skinfolds. The percentage of fat was calculated using the formula of Slaughter, et al.15 (1988), and was performed by measuring triceps
skinfold (TR) and subscapularis skinfold (SS). The formulas were: Body fat (BF)= 0.783x(TR+SS)+1.6 for boys and BF= 0.546x(TR+SS)+9.7 for girls.
The standards adopted to classify children were
based on the Lohman classification16; from 11 to
20% children are classified as eutrophic; from 21 to 25%, as overweight; and above 25%, as obese. The
circumference and skinfold measurements were used
to confirm the BMI classification for children.
Moreover, body composition (percentage fat, fat body mass, and lean body mass) was estimated using the bioimpedance analysis (BIA) to characterize the
sample and detect possible nutritional problems. In
the BIA analysis, a low-level electric current is passed through the body of the subject and the impedance (z), or opposition to the current flow, is measured with a BIA analyzer A310 (Biodynamics®, Shoreline, WA, USA). The BIA measurement was performed on the right side of the body, with the child lying supine
on a non-conductive surface in a room with a normal
temperature (~22°C). The volunteers were on an eight-hour fast in the test day. First, the skin was cleaned at the electrode placement points with alcohol. Subsequently, the electrode sensors (proximal) were placed on the dorsal surface of the wrist joint so that
the upper edge of the electrode aligned to the head
of the ulna, and the dorsal surface of the ankle so
that the upper edge of the electrode aligned with
the medial and lateral malleoli. The placement of the source electrodes (distal) was at the base of the second or third metacarpophalangeal joint of the hand and the metatarsophalangeal of the foot. The individual’s arms and legs were spaced approximately 45° from each other.17
Assessment of gingival inflammation
Another experienced and calibrated examiner
(weighted Kappa >0.8) (R.O.G.) assessed the children’s gingival status in a dental office with a reflector light, a triple syringe, a flat mouth mirror, a WHO periodontal probe with 3.5, 5.5, 8.5, and 11.5 mm markings, and sterile gauze. Then, the same examiner calculated the Simplified Oral Hygiene Index (OHI-S) and Gingival Index (GI) coefficients.
The patient’s oral hygiene assessment followed the criteria used in the OHI-S proposed by Greene and
Vermillion18 (1964): on the buccal surfaces of teeth
11/51, 31/71, 16/55, 26/65, and the lingual surfaces of teeth 36/75 and 46/85. The OHI-S is a combination of plaque indices and calculations, with scores ranging from 0 to 3. The plaque indices and the sum of the
assigned scores were calculated separately and then
divided by the number of surfaces examined. Dye was not used to obtain this index.
The gingival index, proposed by Löe and Silness19
(1963), was determined for each child based on the same teeth assessed in the OHI-S: 11/51, 31/71, 16/55, 26/65, 36/75, and 46/85. The presence or absence of bleeding was verified by pressure stimulus (probing) against the inserted and papillary gingivae, again scored from 0 to 3. The tissues around each tooth, the distobuccal papilla, vestibular margin, mesiobuccal papilla, and linguogingival margin, were also assessed.
Assessment of salivary parameters
Samples of unstimulated total saliva were collected
from children who had not performed physical
morning, between 8 and 10 am, for 5 min (timed by a stopwatch), to minimize the circadian rhythm effects. The child was seated in a relaxed position, with their head slightly lowered.
Before saliva collection, the mouth was sanitized with distilled water, and the initial saliva was discarded
before the stopwatch was used to determine salivary
flow (mL/min).
The saliva was collected using a funnel into a 50 mL
conical tube. Immediately after completing collection,
the samples were stored on ice and transported in
a styrofoam box to the salivary analysis laboratory. Salivary volume and flow (mL/min) were calculated,
and then the saliva was centrifuged at 5000 rpm for
5 min (Hettich® centrifuge, Universal 320R model,
Tuttlingen, Germany). The samples were stored at -80°C until analysis.
Salivary osmolality was determined after thawing the samples. Ten microliters of centrifuged saliva were
placed on the optical reading disk of the osmometer
(VAPRO® Vapor Pressure Osmometer, model 56000;
New Instrument, Washington, DC, USA). The
osmometer was calibrated by the comparison method
using standard solutions for salivary osmolality
(Opti-MoleTM 290 and 1000 mmol/kg Osmolality Standard
ELITech Group, WESCOR, Washington, DC, USA) before readings were taken.
Salivary IgA was determined using the indirect competitive enzyme immunoassay (EIA) method, according to the manufacturer’s instructions (SpectraMax Plus®, Molecular Devices, CA, USA and
Salimetrics® IgA Kits, PA, USA) and the protocol
adapted by Sari-Sarraf, et al.20 (2011). A standard
curve was generated using known concentrations
of IgA. Subsequently, 25 μL of each sample was aspirated, then poured into a microplate together with
equal aliquots of the working reagents provided in the
kit, according to the manufacturer’s specifications. After adding the samples, the staining was analyzed
by reading the microplate in a spectrophotometer at
a wavelength of 450 nm. The results were expressed as μg/mL.
Statistical analysis
Data analyses included descriptive statistics and association tests. Subsequently, groups were
compared to verify the homogeneity in relation to
the characteristics studied. Normality assumption and
homogeneity of variances were evaluated using the
Kolmogorov-Smirnov and Levene tests, respectively. The body composition, salivary composition, and gingival inflammation variables for the two groups were compared by Student’s t-test (parametric data)
and the Mann-Whitney test (nonparametric data). The
magnitude of the statistical difference was assessed by
determining the effect size (ES).21 The classification of
ES was as follows: ≤0.2 indicated a small effect, 0.3– 0.7 indicated a moderate effect and ≥ 0.8 indicated
a large effect. Correlations between the variables
were verified by the Spearman correlation coefficient (nonparametric data). The level of significance was set at 5%.
In addition, analysis of the s-IgA data, considering the normal-weight, overweight, and obese children separately, was performed using the Kruskal-Wallis
and Bonferroni post hoc tests. Finally, a linear
regression was performed to predict IgA levels, using BMI as the main predictor, adjusting for gingival inflammation, age, and gender. All statistical analyses were performed using IBM SPSS software version 20.0.
Results
The final study sample consisted of 91 children of both sexes, 50 normal-weight children and 41 overweight/obese children, aged 6 to 12 years old (8.6±1.9 years). In the OG, 16 children were overweight and 25 were obese. During data collection, the NWG had a sample loss of two children, while the OG lost eleven children, who were unable to attend every stage of the research.
Children in the NWG (n=50) had a mean age of
8.1±1.7 years old; 26 (52%) were female and 24 (48%) were male. Children in the OG (n=41) had
a mean age of 8.6±1.8 years old; 27 (65.8%) were female and 14 (34.2%) were male. The sample was homogeneous in terms of age (Mann-Whitney test,
p=0.185) and sex (Chi-square test, p=0.182).
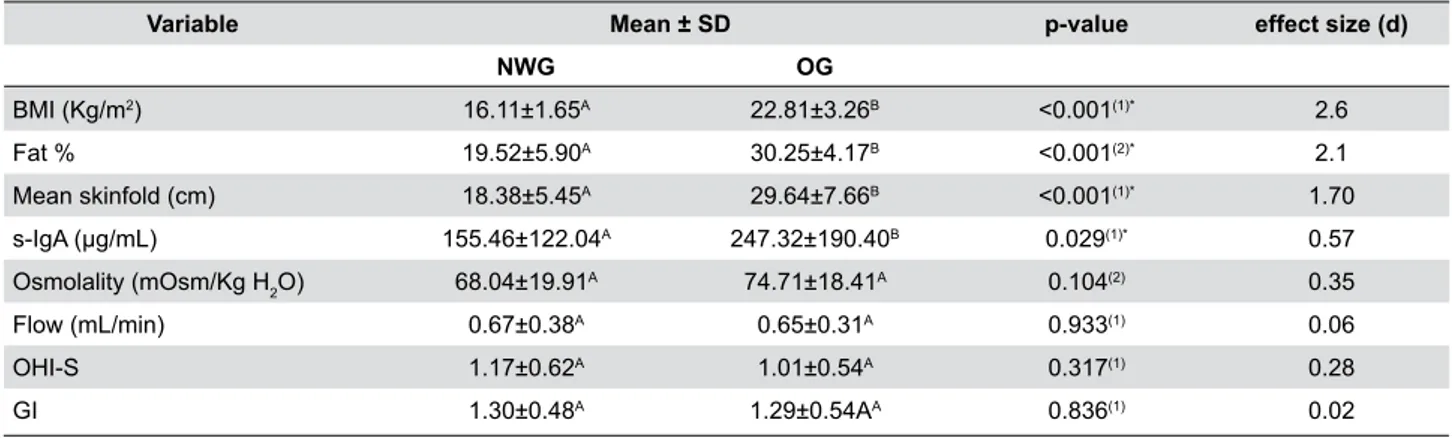
Statistically significant differences were observed
between the groups regarding body composition and
salivary variables (BMI, mean skinfold measurement, fat percentage, and s-IgA values), nonparametric values were higher in OG (p<0.05) (Table 1). ES
estimates were large for BMI (d=2.60), fat percentage
(d=2.10) and mean skinfold measurement (d=1.70),
and moderate for s-IgA values (d=0.57).
normal-weight, overweight, and obese children, and a significant difference was observed between normal-weight and obese children (p=0.037), demonstrating
that s-IgA levels increase as weight status classification
increases (Figure 1).
The correlation between s-IgA levels and
parameters related to obesity (BMI and fat %) among all the children in the sample was significantly positive between s-IgA and BMI values, and s-IgA and fat percentage values (p<0.05) (Table 2).
Correlations were tested between salivary
parameters (salivary flow, osmolality, and s-IgA) and gingival inflammation (OHI-S and GI) in the NWG and OG. No significant correlations were verified in the NWG between the variables investigated (p>0.05).
However, a significant correlation was verified between s-IgA and salivary osmolality in the OG (p<0.05)
(Table 3).
The results of linear regression analysis revealed
that BMI (B=12.98; SE=4.07; p=0.002) remained as a
significant predictor of s-IgA after adjusting the model for gingival inflammation, age, and gender (Table 4).
Variable Mean ± SD p-value effect size (d)
NWG OG
BMI (Kg/m2) 16.11±1.65A 22.81±3.26B <0.001(1)* 2.6
Fat % 19.52±5.90A 30.25±4.17B <0.001(2)* 2.1
Mean skinfold (cm) 18.38±5.45A 29.64±7.66B <0.001(1)* 1.70
s-IgA (μg/mL) 155.46±122.04A 247.32±190.40B 0.029(1)* 0.57
Osmolality (mOsm/Kg H2O) 68.04±19.91
A 74.71±18.41A 0.104(2) 0.35
Flow (mL/min) 0.67±0.38A 0.65±0.31A 0.933(1) 0.06
OHI-S 1.17±0.62A 1.01±0.54A 0.317(1) 0.28
GI 1.30±0.48A 1.29±0.54AA 0.836(1) 0.02
Note: NWG, normal-weight group; OG, overweight/obese group; OHI-S, Simplified Oral Hygiene Index, GI, gingival index. Different upper-case letters indicate a statistically significant difference on the same line. (1) Mann-Whitney test; (2) Student t test; * p<0.05
Table 1- Body composition, salivary composition and gingival inflammation of normal-weight and overweight/obese children
* p=0.037 between normal-weight and obese children
Figure 1- Salivary IgA concentrations according to the classification of weight status.
Variable Spearman's rho p-value
IgA-s x BMI 0.287 0.006*
IgA-s x Fat % 0.266 0.011*
IgA-s x mean skinfold % 0.087 0.410
Note: * Correlation is significant at p<0.05
Discussion
This investigation observed overweight/obese
children showed higher s-IgA values, with correlations between BMI and body fat percentage. Thus, confirming the study the hypothesis that obesity can influence immunological and inflammatory processes.3
It is known that salivary proteins are a more
sensitive and specific indicator for certain oral
diseases. Although our study did not evaluate IgA in plasma, other authors have assessed this condition22
in plasma and saliva, and have reported a good relationship between these variables. Thus, saliva
collection is a valid, non-invasive method that is easy to perform and requires less pre-analysis handling,
and as reduces the pain and anxiety that is typically
associated with blood tests.23
To our knowledge, this is the first study to
determine correlations and associations between
gingival inflammation in children classified according to BMI, skinfold measurements, and body fat percentage.
Most of epidemiological studies use BMI as a method
to assess excess body fat because it is easily applied
during surveys.24 The z score based on BMI curves
for boys and girls proposed by WHO in 200714 is the
main measurement used to determine overweight
and obesity in children. However, the accuracy of BMI in defining obesity is questionable, as it does not distinguish between adipose mass and muscle mass. Thus, the abdominal circumference measurements and
skinfolds in association with BMI are recommended
to eliminate the inconsistencies in the latter, thus
improving the assessment of overweight and obesity
in the children studied.24
Surveys in different parts of the world have
Normal-weight group
Variable Flow Osmolality IgA-s OHI-S GI
Flow Spearman's rho 1
p-value
Osmolality Spearman's rho -0.189 1
p-value 0.188
IgA-s Spearman's rho -0.232 0.202 1
p-value 0.104 0.160
OHI-S Spearman's rho 0.050 -0.098 -0.137 1
p-value 0.731 0.498 0.341
GI Spearman's rho -0.073 0.011 -0.233 0.436** 1
p-value 0.614 0.942 0.104 0.002
Overweight/obese group
Variable Flow Osmolality IgA-s OHI-S GI
Flow Spearman's rho 1
p-value
Osmolality Spearman's rho -0.197 1
p-value 0.216
IgA-s Spearman's rho -0.157 0.326* 1
p-value 0.328 0.038
OHI-S Spearman's rho -0.174 0.157 -0.071 1
p-value 0.278 0.327 0.660
GI Spearman's rho -0.240 0.160 -0.268 0.455** 1
p-value 0.131 0.317 0.091 0.003
Note: Simplified Oral Hygiene Index, GI, Gingival Index. **. Correlation is significant at p<0.01; * Correlation is significant at p<0.05 Table 3- Spearman coefficient of correlation between salivary variables (salivary flow, osmolality, s-IgA) and gingival inflammation in normal-weight and overweight/obese children
Coefficients
Model(a) B SE p-value
(Constant) 20.39 110.59
BMI 12.98 4.07 0.002*
Note: R2=0.183; *p<0.05; (a) Model adjusted for gingival inflammation, age, and gender
reported that gingivitis is prevalent in children and
adolescents.9 Gingival status should be accurately
defined, to determine and control risk factors when assessing these data. Several gingival indices
have been proposed in the literature on gingival
inflammation in children and young adults.25 The GI
was used in this investigation because it has good
sensitivity and reproducibility and provides optimal
knowledge of periodontal biology and pathology for
the examiners. Moreover, this index [proposed by Löe and Silness19 (1963)] has been used in previous studies
involving young children.26,27 GI may be scored for the
all surfaces of all the teeth or the selected teeth or for
selected areas of all the teeth or the selected teeth.25
In this study, GI was performed on six index teeth,
as suggested by a clinical protocol in the periodontal
management of children and adolescents.28 Gingival
status evaluation of all surfaces and teeth in young
children is very difficult due to behavioral aspects.
A recent systematic review1 suggested a significant
positive association between periodontal disease and
obesity in children. In this study, the amount of biofilm (assessed by OHI-S) and inflammation (assessed by GI) were similar between the two groups. These results disagree with the consensus in the literature, which
shows individuals with obesity have more gingivitis and
more biofilm than the respective control group.3,27 We
believe that the differences between the literature and
our results could be explained by the methodology of
periodontal assessment (periodontal pocket probing and bone loss) and the age range of the individuals studied (10 to 17 years old).
The reduction in salivary flow is considered an important risk factor for periodontal diseases.29
However, the salivary flow herein was considered normal, and no significant differences were observed between the groups. A previous study verified a correlation between salivary osmolality (which reflects the individual’s hydration status) and gingival inflammation.29 The authors reported that increased
osmolality reduced salivary flow by increasing
molecular cohesion, leading to increased risk of development of gingivitis.30
A cross-sectional study demonstrated that
individuals with obesity had significantly more
gingival bleeding than the controls in adolescents.6
In our study, although no differences were observed in gingival status among children of either group, the s-IgA values were statistically higher for the OG.
Moreover, a significant positive correlation between s-IgA and parameters related to obesity (BMI and fat %) and linear regression analysis confirmed BMI as
the main predictor of s-IgA levels for all of the children
studied. However, NWG and OG showed no significant correlation between s-IgA and GI. Salivary IgA is responsible for the immune response in the oral cavity,
inhibiting the adhesion of gram-negative bacteria to
the epithelium, neutralizing certain bacterial toxins and
acting as a defense against microorganisms entering
the gastrointestinal and respiratory tracts.31
A nonsignificant negative correlation was observed between s-IgA and salivary flow for both groups. In contrast, a significant negative correlation was observed between salivary flow rate and IgA levels in healthy adults.32 A moderate positive association was
observed between salivary osmolality and s-IgA in
the OG group. This suggests the higher s-IgA levels in this group may influence salivary viscosity since obese
individuals present a higher concentration of salivary
proteins compared with normal-weight individuals.33
The study shows some limitations, including the study design (cross-sectional), the convenience sample, the age range of the participants, certain difficulties in maintaining the adhesion and involvement of the parents/guardians of the participating children, and evaluation of only six index teeth for GI instead of all the surfaces. Thus, this study shows internal validity. Although the current literature shows an association between periodontal disease and obesity,
longitudinal and experimental studies in different
populations are required to determine whether obesity
is a risk factor for this disease, particularly among children and adolescents.
Analysis of the results herein leads us to conclude
that gingival and salivary inflammation were similar in normal-weight and overweight/obese children. Only
s-IgA presented higher values in overweight/obese
children and showed correlations between BMI and
fat percentage.
Acknowledgements
References
1- Martens L, De Smet S, Yusof MY, Rajasekharan S. Association
between overweight/obesity and periodontal disease in children and
adolescents: a systematic review and meta-analysis. Eur Arch Paediatr Dent. 2017;18(2):69-82.
2- Saito T, Shimazaki Y. Metabolic disorders related to obesity and periodontal disease. Periodontol 2000. 2007;43:254-66.
3- Modéer T, Blomberg C, Wondimu B, Lindberg TY, Marcus C.
Association between obesity and periodontal risk indicators in
adolescents. Int J Pediatr Obes. 2011;6(2-2):e264-70.
4- De Heredia FP, Gómez-Martínez S, Marcos A. Obesity, inflammation and the immune system. Proc Nutr Soc. 2012;71(2):332-8. 5- Sistig S, Vucićević-Boras V, Lukac J, Kusić Z. Salivary IgA and IgG subclasses in oral mucosal diseases. Oral Dis. 2002;8(6):282-6. 6- Fadel HT, Pliaki A, Gronowitz E, Mårild S, Ramberg P, Dahlèn G, et al. Clinical and biological indicators of dental caries and periodontal disease in adolescents with or without obesity. Clin Oral Investig. 2014;18(2):359-68.
7- Keller A, Rohde JF, Raymond K, Heitmann BL. Association between periodontal disease and overweight and obesity: a systematic review. J Periodontol. 2015;86(6):766-76.
8- Sfasciotti GL, Marini R, Pacifici A, Ierardo G, Pacifici L, Polimeni A. Childhood overweight-obesity and periodontal diseases: is there a real correlation? Ann Stomatol (Roma). 2017;7(3):65-72.
9- Botero JE, Rösing CK, Duque A, Jaramillo A, Contreras A. Periodontal disease in children and adolescents of Latin America. Periodontol 2000. 2015;67(1):34-57
10- Katz J, Bimstein E. Pediatric obesity and periodontal disease: a systematic review of the literature. Quintessence Int. 2011;42(7):595-9.
11- Teeuw W, Bosch JA, Veerman EC, Amerongen AV. Neuroendocrine regulation of salivary IgA synthesis and secretion: implications for oral health. Biol Chem. 2004;385(12):1137-46.
12- Schenck K, Poppelsdorf D, Denis C, Tollefsen T. Levels of salivary
IgA antibodies reactive with bacteria from dental plaque are associated
with susceptibility to experimental gingivitis. J Clin Periodontol. 1993;20(6):411-7.
13- Starzak DE, Konkol KF, McKune AJ. Effects of cardiorespiratory fitness and obesity on salivary secretory IgA and alpha-amylase in South African children. Children (Basel). 2016;3(3). pii: E12. 14- World Health Organization. World health statistics. Geneve: WHO; 2007.
15- Slaughter MH, Lohman TG, Boileau RA, Horswill CA, Stillman RJ, Van Loan MD, et al. Skinfold equations for estimation of body fatness in children and youths. Hum Biol. 1988;60(5):709-23.
16- Lohman TG. Applicability of body composition techniques and constants for children and youths. Exerc Sport Sci Rev. 1986;14:325-57.
17- Lukaski HC. Methods for the assessment of human body composition: traditional and new. Am J Clin Nutr. 1987;46(4):537-56. 18- Greene JC, Vermillion JR. The Simplified Oral Hygiene Index. J Am Dent Assoc. 1964;68:7-13.
19- Löe H, Silness J. Periodontal disease in pregnancy. I. Prevalence and severity. Acta Odontol Scand. 1963;21:533-51.
20- Sari-Sarraf V, Doran DA, Clarke ND, Atkinson G, Reilly T. Effects
of carbohydrate beverage ingestion on the salivary IgA response to
intermittent exercise in the heat. Int J Sports Med. 2011;32(9):659-65. 21- Cohen J. The earth is round (p<.05). Am Psychol. 1994;49(12):997-1003.
22- Pineda-Martínez S, Hernández-Islas JL, Escobedo-Torres MP, Paredes-Alonzo IE, López-Candiani C, Correa D, et al. Immunoglobulin concentrations in plasma and saliva during the neonatal period. Pediatr Neonatol. 2016;57(3):213-8.
23- Liu J, Duan Y. Saliva: a potential media for disease diagnostics and monitoring. Oral Oncol. 2012;48(7):569-77.
24- Jensen NS, Camargo TF, Bergamaschi DP. Comparison of methods to measure body fat in 7-to-10-year-old children: a systematic review. Public Health. 2016;133:3-13.
25- Rebelo MA, Queiroz AC. Gingival indices: state of art. In: Panagakos F, organizator. Gingival diseases – their aetiology, prevention and treatment. Croatia: In Tech; 2011. p.41-54.
26- Gopinath VK, Rahman B, Awad MA. Assessment of gingival health among school children in Sharjah, United Arab Emirates. Eur J Dent. 2015;9(1):36-40.
27- Franchini R, Petri A, Migliario M, Rimondini L. Poor oral hygiene
and gingivitis are associated with obesity and overweight status in
paediatric subjects. J Clin Periodontol. 2011;38(11):1021-8. 28- Cabanilla L, Molinari G. Clinical considerations in the management of inflammatory periodontal diseases in children and adolescents. J Dent Child. 2009;76(2):101-8.
29- Santos MT, Ferreira MC, Guaré RO, Diniz MB, Rösing CK, Rodrigues JA, et al. Gingivitis and salivary osmolality in children with cerebral palsy. Int J Paediatr Dent. 2016;26(6):463-70.
30- Biesbrock AR, Dirksen T, Schuster G. Effects of tung oil on salivary viscosity and extent and incidence of dental caries in rats. Caries Res. 1992;26(2):117-23.
31- Brandtzaeg P. Role of secretory antibodies in the defence against infections. Int J Med Microbiol. 2003;293(1):3-15.
32- Cheaib Z, Lussi A. Role of amylase, mucin, IgA and albumin on salivary protein buffering capacity: a pilot study. J Biosci. 2013;38(2):259-65.