Letter
https://doi.org/10.1038/s41586-018-0485-4Acceleration of electrons in the plasma wakefield of
a proton bunch
e. Adli1, A. Ahuja2, O. Apsimon3,4, r. Apsimon4,5, A.-M. Bachmann2,6,7, D. Barrientos2, F. Batsch2,6,7, J. Bauche2,
V. K. Berglyd Olsen1, M. Bernardini2, t. Bohl2, C. Bracco2, F. Braunmüller6, G. Burt4,5, B. Buttenschön8, A. Caldwell6, M. Cascella9,
J. Chappell9, e. Chevallay2, M. Chung10, D. Cooke9, H. Damerau2, L. Deacon9, L. H. Deubner11, A. Dexter4,5, S. Doebert2,
J. Farmer12, V. N. Fedosseev2, r. Fiorito4,13, r. A. Fonseca14, F. Friebel2, L. Garolfi2, S. Gessner2, I. Gorgisyan2, A. A. Gorn15,16,
e. Granados2, O. Grulke8,17, e. Gschwendtner2, J. Hansen2, A. Helm18, J. r. Henderson4,5, M. Hüther6, M. Ibison4,13, L. Jensen2,
S. Jolly9, F. Keeble9, S.-Y. Kim10, F. Kraus11, Y. Li3,4, S. Liu19, N. Lopes18, K. V. Lotov15,16, L. Maricalva Brun2, M. Martyanov6,
S. Mazzoni2, D. Medina Godoy2, V. A. Minakov15,16, J. Mitchell4,5, J. C. Molendijk2, J. t. Moody6, M. Moreira2,18, P. Muggli2,6,
e. Öz6, C. Pasquino2, A. Pardons2, F. Peña Asmus6,7, K. Pepitone2, A. Perera4,13, A. Petrenko2,15, S. Pitman4,5, A. Pukhov12, S. rey2,
K. rieger6, H. ruhl20, J. S. Schmidt2, I. A. Shalimova16,21, P. Sherwood9, L. O. Silva18, L. Soby2, A. P. Sosedkin15,16, r. Speroni2,
r. I. Spitsyn15,16, P. V. tuev15,16, M. turner2, F. Velotti2, L. Verra2,22, V. A. Verzilov19, J. Vieira18, C. P. Welsch4,13, B. Williamson3,4,
M. Wing9*, B. Woolley2 & G. Xia3,4
High-energy particle accelerators have been crucial in providing a deeper understanding of fundamental particles and the forces that govern their interactions. To increase the energy of the particles or to reduce the size of the accelerator, new acceleration schemes need to be developed. Plasma wakefield acceleration1–5, in which the electrons in a plasma are excited, leading to strong electric fields (so called ‘wakefields’), is one such promising acceleration technique. Experiments have shown that an intense laser pulse6–9 or electron bunch10,11 traversing a plasma can drive electric fields of tens of gigavolts per metre and above—well beyond those achieved in conventional radio-frequency accelerators (about 0.1 gigavolt per metre). However, the low stored energy of laser pulses and electron bunches means that multiple acceleration stages are needed to reach very high particle energies5,12. The use of proton bunches is compelling because they have the potential to drive wakefields and to accelerate electrons to high energy in a single acceleration stage13. Long, thin proton bunches can be used because they undergo a process called self-modulation14–16, a particle–plasma interaction that splits the bunch longitudinally into a series of high-density microbunches, which then act resonantly to create large wakefields. The Advanced Wakefield (AWAKE) experiment at CERN17–19 uses high-intensity proton bunches—in which each proton has an energy of 400 gigaelectronvolts, resulting in a total bunch energy of 19 kilojoules—to drive a wakefield in a ten-metre-long plasma. Electron bunches are then injected into this wakefield. Here we present measurements of electrons accelerated up to two gigaelectronvolts at the AWAKE experiment, in a demonstration of proton-driven plasma wakefield acceleration. Measurements were conducted under various plasma conditions and the acceleration was found to be consistent and reliable. The potential for this scheme to produce very high-energy electron bunches in a single accelerating stage20 means that our results are an important step towards the development of future high-energy particle accelerators21,22.
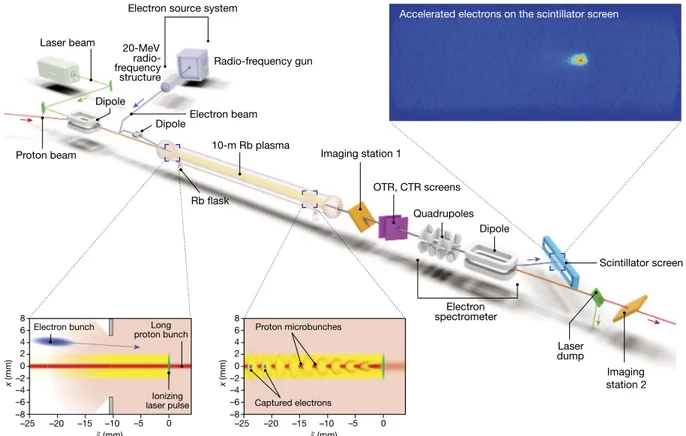
The layout of the AWAKE experiment is shown in Fig. 1. A proton bunch from CERN’s Super Proton Synchrotron (SPS) accelerator co-propagates with a laser pulse (green), which creates a plasma (yellow) in a column of rubidium vapour (pink) and seeds the
modulation of the proton bunch into microbunches (Fig. 1; red, bottom images). The protons have an energy of 400 GeV and the root-mean-square (r.m.s.) bunch length is 6–8 cm18. The bunch is focused to a
transverse size of approximately 200 μm (r.m.s.) at the entrance of the vapour source, with the bunch population varying shot-to-shot in the range Np ≈ (2.5–3.1) × 1011 protons per bunch. Proton extraction
occurs every 15–30 s. The laser pulse used to singly ionize the rubidium in the vapour source23,24 is 120 fs long with a central wavelength of
780 nm and a maximum energy of 450 mJ25. The pulse is focused to a
waist of approximately 1 mm (full-width at half-maximum, FWHM) inside the rubidium vapour source, five times the transverse size of the proton bunch. The rubidium vapour source (Fig. 1; centre) has a length of 10 m and diameter of 4 cm, with rubidium flasks at each end. The rubidium vapour density and hence the plasma density npe can
be varied in the range 1014–1015 cm−3 by heating the rubidium flasks
to temperatures of 160–210 °C. This density range corresponds to a plasma wavelength of 1.1–3.3 mm, as detailed in Methods. A gradient in the plasma density can be introduced by heating the rubidium flasks to different temperatures. Heating the downstream (Fig. 1; right side) flask to a higher temperature than the upstream (left side) flask creates a positive density gradient, and vice versa. Gradients in plasma den-sity have been shown in simulation to produce large increases in the maximum energy attainable by the injected electrons26. The effect of
density gradients here is different from that for short drivers27. In
addi-tion to keeping the wake travelling at the speed of light at the witness position, the gradient prevents destruction of the bunches at the final stage of self-modulation28, thus increasing the wakefield amplitude at
the downstream part of the plasma cell. The rubidium vapour density is monitored constantly by an interferometer-based diagnostic29.
The self-modulation of the proton bunch into microbunches (Fig. 1; red, bottom right image) is measured using optical and coherent transition radiation diagnostics (Fig. 1; purple)30. However, these
diag-nostics have a destructive effect on the accelerated electron bunch and cannot be used during electron acceleration experiments. The second beam-imaging station (Fig. 1; orange, right) is used instead, providing an indirect measurement of the self-modulation by measuring the transversely defocused protons31. These protons are expelled from the
1University of Oslo, Oslo, Norway. 2CERN, Geneva, Switzerland. 3University of Manchester, Manchester, UK. 4Cockcroft Institute, Daresbury, UK. 5Lancaster University, Lancaster, UK. 6Max Planck
Institute for Physics, Munich, Germany. 7Technical University Munich, Munich, Germany. 8Max Planck Institute for Plasma Physics, Greifswald, Germany. 9UCL, London, UK. 10UNIST, Ulsan,
South Korea. 11Philipps-Universität Marburg, Marburg, Germany. 12Heinrich-Heine-University of Düsseldorf, Düsseldorf, Germany. 13University of Liverpool, Liverpool, UK. 14ISCTE—Instituto
Universitéario de Lisboa, Lisbon, Portugal. 15Budker Institute of Nuclear Physics SB RAS, Novosibirsk, Russia. 16Novosibirsk State University, Novosibirsk, Russia. 17Technical University of Denmark,
Lyngby, Denmark. 18GoLP/Instituto de Plasmas e Fusão Nuclear, Instituto Superior Técnico, Universidade de Lisboa, Lisbon, Portugal. 19TRIUMF, Vancouver, British Columbia, Canada. 20
Ludwig-Maximilians-Universität, Munich, Germany. 21Institute of Computational Mathematics and Mathematical Geophysics SB RAS, Novosibirsk, Russia. 22University of Milan, Milan, Italy.
*e-mail: m.wing@ucl.ac.uk
central propagation axis by transverse electric fields that are present only when the proton bunch undergoes modulation in the plasma.
Electron bunches with a charge of 656 ± 14 pC (where the uncer-tainty is the r.m.s.) are produced and accelerated to 18.84 ± 0.05 MeV (where the uncertainty is the standard error of the mean) in a radio- frequency structure upstream of the vapour source32. These electrons
are then transported along a beam line before being injected into the vapour source. Magnets along the beam line are used to control the injection angle and focal point of the electrons. For the results presented here, the electrons enter the plasma with a small vertical offset with respect to the proton bunch and a 200-ps delay with respect to the ionizing laser pulse (Fig. 1, bottom left). The beams cross approx-imately 2 m into the vapour source at a crossing angle of 1.2–2 mrad. Simulations show that electrons are captured in larger numbers and accelerated to higher energies when injected off-axis rather than collinearly with the proton bunch17. The normalized emittance of the
witness electron beam at injection is approximately 11–14 mm mrad and its focal point is close to the entrance of the vapour source. The delay of 200 ps corresponds to approximately 25 proton microbunches resonantly driving the wakefield at npe = 2 × 1014 cm−3 and 50
micro-bunches at npe = 7 × 1014 cm−3.
A magnetic electron spectrometer (Fig. 1, right) enables measurement of the accelerated electron bunch33. Two quadrupole magnets are located
4.48 m and 4.98 m downstream of the exit iris of the vapour source and focus the witness beam vertically and horizontally, respectively, to more easily identify a signal. These are followed by a 1-m-long C-shaped electromagnetic dipole with a maximum magnetic field of
approximately 1.4 T. A large triangular vacuum chamber sits in the cavity of the dipole. This chamber is designed to keep accelerated electron bunches under vacuum while the magnetic field of the dipole induces an energy-dependent horizontal deflection in the bunch. Electrons within a specific energy range then exit this vacuum chamber through a 2-mm-thick aluminium window and are incident on a 0.5-mm-thick gadolinium oxysulfide (Gd2O2S:Tb) scintillator screen (Fig. 1; blue,
right) attached to the exterior surface of the vacuum chamber. The proton bunch is not greatly affected by the spectrometer magnets, owing to its high momentum, and continues to the beam dump. The scintillating screen is 997 mm wide and 62 mm high with semi-circular ends. Light emitted from the scintillator screen is transported over a distance of 17 m via three highly reflective optical-grade mirrors to an intensified charge-coupled device (CCD) camera fitted with a lens with a focal length of 400 mm. The camera and the final mirror of this optical line are housed in a dark room, which reduces ambient light incident on the camera to negligible values.
The energy of the accelerated electrons is inferred from their hori-zontal position in the plane of the scintillator. The relationship between this position and the energy of the electron is dependent on the strength of the dipole, which can be varied from approximately 0.1 T to 1.4 T. This position–energy relationship has been simulated using the Beam Delivery Simulation (BDSIM) code34. The simulation tracks electrons
of various energies through the spectrometer using measured and simulated magnetic-field maps for the spectrometer dipole, as well as the relevant distances between components. The accuracy of the magnetic-field maps, the precision of the distance measurements
Electron bunch Ionizing laser pulse Long proton bunch Captured electrons Proton microbunches Rb flask 10-m Rb plasma Laser beam Laser dump Radio-frequency gun
Electron source system 20-MeV radio-frequency structure Quadrupoles Dipole Dipole Dipole Imaging station 1 Imaging station 2 OTR, CTR screens Scintillator screen Electron spectrometer Proton beam Electron beam –25 –20 –15 –10 –5 0 [ (mm) 8 6 4 x (mm) 2 0 –2 –4 –6 –8 –25 –20 –15 –10 –5 0 [ (mm) 8 6 4 x (mm) 2 0 –2 –4 –6 –8
Accelerated electrons on the scintillator screen
Fig. 1 | Layout of the AWAKE experiment. The proton bunch and
laser pulse propagate from left to right across the image, through a 10-m column of rubidium (Rb) vapour. This laser pulse (green, bottom images) singly ionizes the rubidium to form a plasma (yellow), which then interacts with the proton bunch (red, bottom left image). This interaction modulates the long proton bunch into a series of microbunches (bottom right image), which drive a strong wakefield in the plasma. These microbunches are millimetre-scale in the longitudinal direction (ξ) and submillimetre-scale in the transverse (x) direction. The self-modulation of the proton bunch is measured in imaging stations 1 and 2 and the optical and coherent transition radiation (OTR, CTR) diagnostics. The
rubidium (pink) is supplied by two flasks at each end of the vapour source. The density is controlled by changing the temperature in these flasks and a gradient may be introduced by changing their relative temperature. Electrons (blue), generated using a radio-frequency source, propagate a short distance behind the laser pulse and are injected into the wakefield by crossing at an angle. Some of these electrons are captured in the wakefield and accelerated to high energies. The accelerated electron bunches are focused and separated from the protons by the quadrupoles and dipole magnet of the spectrometer (grey, right). These electrons interact with a scintillating screen, creating a bright intensity spot (top right image), allowing them to be imaged and their energy inferred from their position.
and the 1.5-mm resolution of the optical system lead to an energy uncertainty of approximately 2%. The overall uncertainty, however, is dominated by the emittance of the accelerated electrons, and can be larger than 10%. The use of the focusing quadrupoles limits this uncertainty to approximately 5% for electrons near to the focused energy.
Owing to the difficulty of propagating an electron beam of well-known intensity to the spectrometer at AWAKE, the charge response of the scintillator is calculated using data acquired at CERN’s Linear Electron Accelerator for Research (CLEAR) facility. This calibration is performed by placing the scintillator and vacuum window next to a beam charge monitor on the CLEAR beam line and measuring the scintillator signal. The response of the scintillator is found to depend linearly on charge over the range 1–50 pC. The response is also found to be independent of position and of energies in the range 100–180 MeV, to within the measurement uncertainty. This charge response is then recalculated for the optical system of the spectrometer at AWAKE by imaging a well-known light source at both locations. A response of (6.9 ± 2.1) × 106 CCD counts per incident picocoulomb of charge, given
the acquisition settings used at AWAKE, is determined. The large 1σ uncertainty is due to different triggering conditions at CLEAR and AWAKE and systematic uncertainties in the calibration results.
Reliable acceleration of electrons relies on reproducible self-modulation of the proton beam. As well as the observation of the transverse expansion of the proton bunch, the optical and coherent transition radi-ation diagnostics showed clear microbunching of the beam. The proton microbunches were observed to be separated by the plasma wavelength (inferred from the measured rubidium vapour density, see Methods) for all parameter ranges investigated; they were also reproducible and stable in phase relative to the seeding. The detailed study of the self-modulation process will be the subject of separate AWAKE publications.
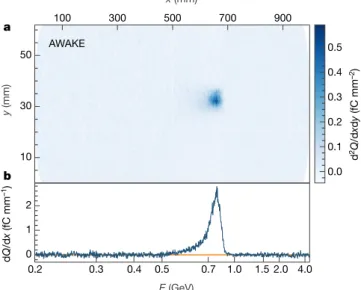
The data presented here were collected in May 2018. In Fig. 2a we show an image of the scintillator from an electron acceleration event at a plasma density of 1.8 × 1014 cm−3, with a measured density
differ-ence of +5.3% ± 0.3% over 10 m in the direction of propagation of the
proton bunch. This image has been background-subtracted and cor-rected for vignetting and electron-angle effects (Methods). The quadru-poles of the spectrometer were focusing at an energy of approximately 700 MeV during this event, creating a substantial reduction in the ver-tical spread of the beam. In Fig. 2b we show a projection obtained by integrating over a central region of the scintillator. A 1σ uncertainty band, which comes from the background subtraction, is shown around zero. The peak in this figure has a high signal-to-noise ratio, which provides clear evidence of accelerated electrons. In both the image and the projection, the charge density is calculated using the central value of 6.9 × 10⁶ CCD counts per picocoulomb. The asymmetric shape of
the peak is due to the nonlinear position–energy relationship induced in the electron bunch by the magnetic field; when re-binned in energy, the signal peak is approximately Gaussian. Accounting for the sys-tematic uncertainties described earlier, the observed peak has a mean of 800 ± 40 MeV, a FWHM of 137.3 ± 13.7 MeV and a total charge of 0.249 ± 0.074 pC. The amount of charge captured is expected to increase considerably17 as the emittance of the injected electron bunch
is reduced and its geometric overlap with the wakefield is improved. The stability and reliability of the electron acceleration is evidenced by Fig. 3, which shows projections from many consecutive electron- injection events. Each row in this plot is the background-subtracted projection from a single event, with the colour representing the signal intensity. The events correspond to a 2-h running period during which the quadrupoles were varied to focus over a range of approximately 460–620 MeV. Other parameters, such as the proton-bunch population, were not deliberately changed but vary naturally on a shot-to-shot basis. Despite the quadrupole scan and the natural fluctuations in the beam parameters, the plot still shows consistent and reproducible acceleration of electron bunches to approximately 600 MeV. The plasma density for these events is 1.8 × 1014 cm−3, with no density gradient. This lack of
gradient is the cause of the difference in energy between the event in Fig. 2 and the events in Fig. 3.
The energy gain achievable by introducing a more optimal gradient is demonstrated in Fig. 4, which shows the peak energy achieved at different plasma densities with and without a gradient. The density gra-dients chosen are those that are observed to maximize the peak energy
100 300 500 700 900 10 30 50 0.2 0.3 0.4 0.5 0.7 1.0 1.5 2.0 4.0 0 1 2 d Q /d x (fC mm –1) 0.0 0.1 0.2 0.3 0.4 0.5 d 2Q /d xd y (fC mm –2) x (mm) y (mm) E (GeV) a b AWAKE
Fig. 2 | Signal of accelerated electrons. a, An image of the scintillator
(with horizontal distance x and vertical distance y) with background subtraction and geometric corrections applied is shown, with an electron signal clearly visible. The intensity of the image is given in charge Q per unit area (d2Q/dxdy), calculated using the central value from the
calibration of the scintillator. b, A projection of the image in a is obtained by integrating vertically over the charge observed in the central region of the image. A 1σ uncertainty band from the background subtraction is shown in orange around zero. Both the image (a) and the projection (b) are binned in space, as shown on the top axis, but the central value from the position–energy conversion is indicated at various points on the bottom axis. The electron signal is clearly visible above the noise, with a peak intensity at an energy of E ≈ 800 MeV.
0.2 0.3 0.5 0.7 1.0 1.5 0 25 50 75 100 125 150 175 Event number 500 700 900 0.0 0.2 0.4 0.6 0.8 1.0 1.2 1.4 x (mm) E (GeV) d Q /d x (fC mm –1) AWAKE
Fig. 3 | Background-subtracted projections of consecutive electron-injection events. Each projection (event) is a vertical integration over
the central region of a background-subtracted spectrometer camera image. Brighter colours indicate regions of high charge density dQ/dx, corresponding to accelerated electrons. The quadrupoles of the spectrometer were varied to focus at energies of 460–620 MeV over the duration of the dataset. No other parameters were varied deliberately. The consistent peak around energy E ≈ 600 MeV demonstrates the stability and reliability of the electron acceleration.
for a given plasma density. At 1.8 × 1014 cm−3 the density difference was
approximately +5.3% ± 0.3% over 10 m, whereas at 3.9 × 1014 cm−3 and
6.6 × 1014 cm−3 it fell to +2.5% ± 0.3% and +2.2% ± 0.1%, respectively.
Given the precise control of the longitudinal plasma density, small density gradients can have a substantial effect on the acceleration because the electrons are injected tens of microbunches behind the ionizing laser pulse26. The charge of the observed electron bunches
decreases at higher plasma densities, owing in part to the smaller transverse size of the wakefield. In addition, the quadrupoles of the spectrometer have a maximum focusing energy of 1.3 GeV, which makes bunches accelerated to higher energies than this harder to detect above the background noise.
The energies shown in Fig. 4 are determined by binning the pixel data in energy and fitting a Gaussian over the electron signal region; the peak energy μE is the mean of this Gaussian. The observed energy
spread of each bunch is determined by the width of this Gaussian and is approximately 10% of the peak energy. The peak energy increases with density, reaching 2.0 ± 0.1 GeV for npe = 6.6 × 1014 cm−3 in the presence
of a density gradient, at which point the charge capture is much lower. The energies of the accelerated electrons are within the range of values originally predicted by particle-in-cell and fluid code simulations of the AWAKE experiment17,18,26. Future data-collection runs will
address the effect of the electron-bunch delay, injection angle and other parameters on the accelerated energy and charge capture. These studies will help to determine what sets the limit on the energy gain.
In summary, we have demonstrated proton-driven plasma wakefield acceleration. The strong electric fields, generated by a series of proton microbunches, were sampled with a bunch of electrons. These electrons were accelerated up to 2 GeV in approximately 10 m of plasma and measured using a magnetic spectrometer. This technique has the potential to accelerate electrons to the teraelectronvolt scale in a single accelerating stage. Although still in the early stages of its programme, the AWAKE experiment is an important step towards realizing new high-energy particle physics experiments.
Online content
Any methods, additional references, Nature Research reporting summaries, source data, statements of data availability and associated accession codes are available at https://doi.org/10.1038/s41586-018-0485-4.
Received: 22 June 2018; Accepted: 14 August 2018; Published online 29 August 2018.
1. Tajima, T. & Dawson, J. M. Laser electron accelerator. Phys. Rev. Lett. 43, 267–270 (1979).
2. Chen, P., Dawson, J. M., Huff, R. W. & Katsouleas, T. C. Acceleration of electrons by the interaction of a bunched electron beam with a plasma. Phys. Rev. Lett. 54, 693–696 (1985); erratum 55, 1537 (1985).
3. Joshi, C. The development of laser- and beam-driven plasma accelerators as an experimental field. Phys. Plasmas 14, 055501 (2007).
4. Esarey, E., Schroeder, C. B. & Leemans, W. P. Physics of laser-driven plasma-based electron accelerators. Rev. Mod. Phys. 81, 1229–1285 (2009). 5. Hogan, M. J. Electron and positron beam-driven plasma acceleration. Rev.
Accel. Sci. Technol. 9, 63–83 (2016).
6. Modena, A. et al. Electron acceleration from the breaking of relativistic plasma waves. Nature 377, 606–608 (1995).
7. Mangles, S. P. D. et al. Monoenergetic beams of relativistic electrons from intense laser–plasma interactions. Nature 431, 535–538 (2004). 8. Geddes, C. G. R. et al. High-quality electron beams from a laser wakefield
accelerator using plasma-channel guiding. Nature 431, 538–541 (2004). 9. Faure, J. et al. A laser–plasma accelerator producing monoenergetic electron
beams. Nature 431, 541–544 (2004).
10. Blumenfeld, I. et al. Energy doubling of 42 GeV electrons in a metre-scale plasma wakefield accelerator. Nature 445, 741–744 (2007).
11. Litos, M. et al. High-efficiency acceleration of an electron beam in a plasma wakefield accelerator. Nature 515, 92–95 (2014).
12. Schroeder, C. B., Esarey, E., Geddes, C. G. R., Benedetti, C. & Leemans, W. P. Physics considerations for laser–plasma linear colliders. Phys. Rev. Spec. Top. Accel. Beams 13, 101301 (2010).
13. Caldwell, A., Lotov, K., Pukhov, A. & Simon, F. Proton-driven plasma-wakefield acceleration. Nat. Phys. 5, 363–367 (2009).
14. Kumar, N., Pukhov, A. & Lotov, K. Self-modulation instability of a long proton bunch in plasmas. Phys. Rev. Lett. 104, 255003 (2010).
15. Schroeder, C. B., Benedetti, C., Esarey, E., Grüner, F. J. & Leemans, W. P. Growth and phase velocity of self-modulated beam-driven plasma waves. Phys. Rev. Lett. 107, 145002 (2011).
16. Pukhov, A. et al. Phase velocity and particle injection in a self-modulated proton-driven plasma wakefield accelerator. Phys. Rev. Lett. 107, 145003 (2011).
17. Caldwell, A. et al. Path to AWAKE: evolution of the concept. Nucl. Instrum. Methods A 829, 3–16 (2016).
18. Gschwendtner, E. et al. AWAKE, the advanced proton driven plasma wake field acceleration experiment at CERN. Nucl. Instrum. Methods A 829, 76–82 (2016).
19. Muggli, P. et al. AWAKE readiness for the study of the seeded self-modulation of a 400 GeV proton bunch. Plasma Phys. Control. Fusion 60, 014046 (2017). 20. Caldwell, A. & Lotov, K. V. Plasma wakefield acceleration with a modulated
proton bunch. Phys. Plasmas 18, 103101 (2011).
21. Caldwell, A. & Wing, M. VHEeP: a very high energy electron–proton collider. Eur. Phys. J. C 76, 463–472 (2016).
22. Xia, G. et al. Collider design issues based on proton-driven plasma wakefield acceleration. Nucl. Instrum. Methods A 740, 173–179 (2014).
23. Öz, E. & Muggli, P. A novel Rb vapor plasma source for plasma wakefield accelerators. Nucl. Instrum. Methods A 740, 197–202 (2014).
24. Plyushchev, G., Kersevan, R., Petrenko, A. & Muggli, P. A rubidium vapor source for a plasma source for AWAKE. J. Phys. D 51, 025203 (2018).
25. Fedosseev, V. N. et al. Integration of a terawatt laser at the CERN SPS beam for the AWAKE experiment on proton-driven plasma waked acceleration. In Proc. 7th International Particle Accelerator Conference 2592–2595 (JACoW, 2016). 26. Petrenko, A., Lotov, K. & Sosedkin, A. Numerical studies of electron acceleration
behind self-modulating proton beam in plasma with a density gradient. Nucl. Instrum. Methods A 829, 63–66 (2016).
27. Sprangle, P. et al. Wakefield generation and GeV acceleration in tapered plasma channels. Phys. Rev. E 63, 056405 (2001).
28. Lotov, K. V. Physics of beam self-modulation in plasma wakefield accelerators. Phys. Plasmas 22, 103110 (2015).
29. Batsch, F. et al. Interferometer-based high-accuracy white light measurement of neutral rubidium density and gradient at AWAKE. Nucl. Instrum. Methods A https://doi.org/10.1016/j.nima.2018.02.067 (2018).
30. Muggli, P. et al. Measuring the self-modulation instability of electron and positron bunches in plasmas. In Proc. 6th International Particle Accelerator Conference 2506–2508 (JACoW, 2015).
31. Turner, M. et al. The two-screen measurement setup to indirectly measure proton beam self-modulation in AWAKE. Nucl. Instrum. Methods A 854, 100–106 (2017).
32. Pepitone, K. et al. The electron accelerators for the AWAKE experiment at CERN—baseline and future developments. Nucl. Instrum. Methods A https://doi. org/10.1016/j.nima.2018.02.044 (2018).
33. Deacon, L. et al. Development of a spectrometer for proton driven plasma wakefield accelerated electrons at AWAKE. In Proc. 6th International Particle Accelerator Conference 2601–2604 (JACoW, 2015).
34. Nevay, L. et al. BDSIM: an accelerator tracking code with particle–matter interactions. Preprint at https://arxiv.org/abs/1808.10745 (2018). Acknowledgements All authors are members of the AWAKE Collaboration. This work was supported in part by: a Leverhulme Trust Research Project Grant RPG-2017-143 and by STFC (AWAKE-UK, Cockroft Institute core and UCL consolidated grants), UK; the Russian Science Foundation (project number 14-50-00080) for simulations of oblique injection performed by Budker INP group; a Deutsche Forschungsgemeinschaft project grant PU 213-6/1 ‘Three-dimensional quasi-static simulations of beam self-modulation for plasma wakefield acceleration’; the National Research Foundation of Korea
2 3 4 5 6 7 npe (1014 cm–3) 0.6 0.8 1.0 1.2 1.4 1.6 1.8 2.0 2.2 PE (GeV) Gradient No gradient AWAKE
Fig. 4 | Measurement of the highest peak energies μE achieved at
different plasma densities npe, with and without a gradient in the
plasma density. The error bars arise from the position–energy conversion.
The gradients chosen are those that were observed to maximize the energy gain. Acceleration to 2.0 ± 0.1 GeV is achieved with a plasma density of 6.6 × 1014 cm−3 with a density difference of +2.2% ± 0.1% over 10 m.
(numbers NRF-2015R1D1A1A01061074 and NRF-2016R1A5A1013277); the Portuguese FCT—Foundation for Science and Technology, through grants CERN/FIS-TEC/0032/2017, PTDC-FIS-PLA-2940-2014, UID/FIS/50010/2013 and SFRH/IF/01635/2015; NSERC and CNRC for TRIUMF’s contribution; and the Research Council of Norway. M. Wing acknowledges the support of the Alexander von Humboldt Stiftung and DESY, Hamburg. For their advice and contributions to the development of the magnetic spectrometer, we acknowledge B. Biskup, P. La Penna and M. Quattri. A. Petrenko acknowledges G. Demeter (Wigner Institute, Budapest) for calculating the rubidium ionization probability at AWAKE. F. Keeble acknowledges the operators of the CLEAR facility for their assistance during the calibration of the spectrometer. The AWAKE collaboration acknowledge the SPS team for proton delivery. Reviewer information Nature thanks T. Tajima and the other anonymous reviewer(s) for their contribution to the peer review of this work.
Author contributions All authors contributed extensively to the work presented in this paper.
Competing interests The authors declare no competing interests.
Additional information
Reprints and permissions information is available at http://www.nature.com/ reprints.
Correspondence and requests for materials should be addressed to M.W. Publisher’s note: Springer Nature remains neutral with regard to jurisdictional claims in published maps and institutional affiliations.
Open Access This article is licensed under a Creative Commons Attribution 4.0 International License, which permits use, sharing, adaptation, distribution and reproduction in any medium or format, as long as you give appropriate credit to the original author(s) and the source, provide a link to the Creative Commons license, and indicate if changes were made. The images or other third party material in this article are included in the article’s Creative Commons license, unless indicated otherwise in a credit line to the material. If material is not included in the article’s Creative Commons license and your intended use is not permitted by statutory regulation or exceeds the permitted use, you will need to obtain permission directly from the copyright holder. To view a copy of this license, visit http:// creativecommons.org/licenses/by/4.0/.
MEthOds
Plasma generation. A CentAurus Ti:sapphire laser system is used to ionize the
rubidium in the vapour source. The rubidium is confined by expansion chambers at the ends of the source with 10-mm-diameter irises through which rubidium flows constantly and condensates on the expansion walls. By the relation λpe = 2πc[ε0me/
(npee2)]1/2, where c is the speed of light, ε0 is the permittivity of free space, me
is the electron mass and e is the electron charge, the available density range of
npe = 1014–1015 cm−3 corresponds to a plasma wavelength of λpe ≈ 1.1–3.3 mm.
The uniformity of the vapour density is ensured by flowing a heat-exchanging fluid around a concentric tube surrounding the source at a temperature stabilized to ±0.05 °C. Longitudinal density differences of between −10% and +10% over 10 m may be implemented, and controlled at the 1% level. The motion of the (heavy) rubidium ions can be neglected during the transit of the proton bunch because they are singly ionized35.
Witness electron beam. Production of the witness electron beam is initiated by
illuminating a Cs2Te cathode by using a frequency-tripled laser pulse derived from
the ionizing laser. Electron bunches with a charge of 656 ± 14 pC are produced and accelerated to an energy of 5.5 MeV in a 2.5 cell radio-frequency gun and are subsequently accelerated up to 18.84 ± 0.05 MeV using a 30 cell travelling wave structure. These electrons are then transported along an 18-m beam line before being injected into the vapour source. The focal point and crossing angle of the witness beam can be controlled via a combination of quadrupole and kicker magnets along this beam line.
Background subtraction. The large distance between the camera and the proton
beam line means that background noise generated by radiation directly incident on the CCD is minimal. The scintillator of the spectrometer, however, is subject to considerable background radiation. The rise and decay of the scintillator signal occur on timescales longer than 1 μs and, as such, the scintillator photons captured by the camera are produced by an indivisible combination of background radiation and accelerated electrons. The majority of this background radiation is due to the passage of the proton bunch and comes from two main sources: a 0.2-mm-thick aluminium window located 43 m upstream of the spectrometer between AWAKE and the SPS transfer line, and a 0.6-mm-thick aluminium iris at the downstream end of the vapour source. The inner radius of this iris is 5 mm, leading to negligible interaction with the standard SPS proton bunch. However, protons that are defocused during self-modulation, such as those measured at the downstream imaging station, can interact with the iris, creating a substantial background. The strength of the transverse fields in the plasma and hence the number of protons that are defocused is strongly dependent on the plasma density. Consequently, the back-ground generated by the defocused protons is more substantial at higher plasma densities, such as the AWAKE baseline density of 7 × 1014 cm−3. At this density, the
radiative flux on the scintillator due to the iris is much higher than that from the thin window. Conversely, at a lower plasma density, such as 2 × 1014 cm−3, the radiation
from the iris disappears completely and the remaining incident radiation is produced almost entirely by the interaction of the protons with the upstream window.
Owing to the variable nature of the radiation incident on the scintillator, back-ground subtraction is a multistep process. A backback-ground data sample with the electron beam off at a plasma density of 1.8 × 1014 cm−3 is taken, such that the
background has two key components: one due to the camera readout and ambient light in the experimental area, and another, Np-dependent background caused by
the proton bunch passing through the thin window. For each pixel imaging the scintillator, a linear function of Np is defined by a χ2 minimization fit to the
back-ground data sample, giving an Np-dependent mean background image. For each
signal event, a region of the scintillator is chosen where no accelerated electrons are expected, typically the lowest-energy part, and the background is rescaled by the ratio of the sums over this region in the signal event and the Np-scaled
back-ground image. At higher plasma densities, a further step is needed to subtract the background from the iris. This background falls rapidly with increasing distance from the beam line and therefore depends on the horizontal position in the plane of the scintillator. A new region where the expected number of accelerated electrons is small is chosen, this time along the top and bottom edges of the scintillator. The mean of each column of pixels in this region is calculated and then subtracted from each pixel in the central region of that same column, leaving only the signal. The semi-circular ends of the scintillator reduce the effectiveness of this technique at the highest and lowest energies.
Signal extraction. To obtain an accurate estimate of the electron-bunch charge,
the background-subtracted signal is corrected for two effects that vary across the horizontal plane of the scintillator. One effect comes from the variation in the horizontal angle of incidence of the electron on the scintillator. This angle is determined by the same tracking simulation used to define the position– energy relationship, and introduces a cosine correction to the signal owing to the variation in the path length of the electron through the scintillator. The second effect is vignetting, which occurs as result of the finite size of the optics of the spectrometer and the angular emission profile of the scintillator photons. A lamp that mimics this emission profile is scanned across the horizontal plane of the scintillator and the vignetting correction is determined by measuring its relative brightness. The increase in radiation accompanying the electron bunch, owing to its longer path length through the vacuum window at larger incident angles, is negligible and therefore does not require an additional correction factor.
Data reporting. No statistical methods were used to predetermine sample size.
Data availability
The datasets generated and analysed during this study are available from the cor-responding author on reasonable request. The software code used in the analysis and to produce Figs. 2–4 is available from the corresponding author on reasonable request.
35. Vieira, J., Fonseca, R. A., Mori, W. B. & Silva, L. O. The ion motion in self-modulated plasma wakefield accelerators. Phys. Rev. Lett. 109, 145005 (2012).