Master Degree in Computer Science
Enhancing Exploratory Analysis across Multiple
Levels of Detail of Spatiotemporal Events
Thesis submitted in partial fulfillment of the requirements for the degree of
Doctor of Philosophy in Computer Science
Adviser: João Moura Pires, Assistant Professor, NOVA University of Lisbon
Examination Committee
Chairperson: Professor Nuno Manuel Robalo Correia Raporteurs: Associate Professor David Taniar
Full Professor Jerome Bernard Gensel Members: Associate Professor Maribel Yasmina Santos
Copyright © Ricardo Almeida Silva, Faculty of Sciences and Technology, NOVA University of Lisbon.
The Faculty of Sciences and Technology and the NOVA University of Lisbon have the right, perpetual and without geographical boundaries, to file and publish this dissertation through printed copies reproduced on paper or on digital form, or by any other means known or that may be invented, and to disseminate through scientific repositories and admit its copying and distribution for non-commercial, educational or research purposes, as long as credit is given to the author and editor.
This document was created using the (pdf)LATEX processor, based in the “unlthesis” template[1], developed at the Dep. Informática of FCT-NOVA [2].
Os meus agradecimentos vão para todos aqueles que tornaram possível a realização desta dissertação, ou que de alguma forma tiveram impacto no resultado da mesma.
Gostaria de agradecer ao meu orientador, Professor João Moura Pires, em primeiro lugar, por ter apostado em mim. Em segundo, agradeço pela sua orientação e por todas as discussões interessantes e conselhos que me colocaram na direcção correcta. Em terceiro, agradeço todo o conhecimento que me foi transmitido. E por último, pelo seu apoio incondicional nos mais variados assuntos, muitas vezes não relacionados com aspectos com a dissertação mas que foram fundamentais para a conclusão desta.
Para a Professora Maribel Yasmina Santos, que desde o primeiro dia sempre esteve disponível. Os seus comentários pertinentes melhoraram, certamente, a qualidade desta dissertação. Para o Professor Nuno Datia, que não só teve uma participação activa no desenvolvimento do protótipo SUITE-VA, como também os seus comentários pertinentes moldaram a dissertação para o que ela é hoje.
Agradeço também ao Rui Leal que me ajudou num dos períodos mais dificeis. Esteve presente no desenvolvimento do primeiro protótipo, cujo trabalho teve contribuições importantes para a dissertação.
Um agradecimento para o Professor Bruno Martins, Professor Carlos Damásio, Pro-fessor Fernando Birra, e ProPro-fessor Alferes. A todos, agradeço os comentários, críticas, sugestões e caminhos apontados.
Para todos os amigos que, de um modo ou outro, me ajudaram, em especial para aqueles que me acompanharam durante este percurso: Ana Sofia Gomes, Diogo Cardoso, Duarte Godinho, Daniela Gortan, Jorge Sousa, Lara Nascimento, Luísa Lourenço, Pedro Estrela, Sinan Elgimez, Jorge Costa, Miguel Domingues, Miguel Lourenço, Mário Pires, and many others.
Finalmente, um agradecimento aos meus pais por me sempre apoiarem incondicional-mente a terminar o doutoramento, mesmo quando parecia impossível.
Crimes, forest fires, accidents, infectious diseases, human interactions with mobile de-vices (e.g., tweets) are being logged as spatiotemporal events. For each event, its spatial location, time and related attributes are known with high levels of detail (LoDs). The LoD of analysis plays a crucial role in the user’s perception of phenomena. From one LoD to another, some patterns can be easily perceived or different patterns may be detected, thus requiring modeling phenomena at different LoDs as there is no exclusive LoD to study them.
Granular computing emerged as a paradigm of knowledge representation and pro-cessing, where granules are basic ingredients of information. These can be arranged in a hierarchical alike structure, allowing the same phenomenon to be perceived at different LoDs. This PhD Thesis introduces a formal Theory of Granularities (ToG) in order to have granules defined over any domain and reason over them. This approach is more general than the related literature because these appear as particular cases of the pro-posed ToG. Based on this theory we propose a granular computing approach to model spatiotemporal phenomena at multiple LoDs, and called it a granularities-based model. This approach stands out from the related literature because it models a phenomenon through statements rather than just using granules to model abstract real-world entities. Furthermore, it formalizes the concept of LoD and follows an automated approach to generalize a phenomenon from one LoD to a coarser one.
Present-day practices work on a single LoD driven by the users despite the fact that the identification of the suitable LoDs is a key issue for them. This PhD Thesis presents a framework forSUmmarizIng spatioTemporalEvents (SUITE) across multiple LoDs. The SUITE framework makes no assumptions about the phenomenon and the analytical task. A Visual Analytics approach implementing the SUITE framework is presented, which allow users to inspect a phenomenon across multiple LoDs, simultaneously, thus helping to understand in what LoDs the phenomenon perception is different or in what LoDs patterns emerge.
Crimes, incêndios florestais, doenças infecciosas estão a ser registados como eventos espácio-temporais. Para cada evento, a sua localização espacial, tempo e atributos re-lacionados são conhecidos com grandes níveis de detalhe (NdDs). O NdD de análise tem um papel fundamental na percepção dos fenómenos. De um NdD para outro, alguns padrões podem ser facilmente perceptíveis ou diferentes padrões podem ser detectados, requerendo que os fenómenos sejam modelados a diferentes NdDs, uma vez que não existe apenas um NdD para os estudar.
A computação granular emergiu como o paradigma de representação de conheci-mento e processaconheci-mento, onde grânulos são ingredientes básicos de informação. Estes podem ser organizados numa estrutura hierárquica, permitindo que o mesmo fenómeno seja observado a diferentes NdDs. Esta dissertação introduz uma teoria formal de gra-nularidades (TdG) de modo a ter grânulos definidos sobre qualquer domínio e a poder raciocinar sobre eles. Esta abordagem é mais geral do que a literatura relacionada por-que as propostas da literatura mostraram-se casos particulares da TdG proposta. Com base nesta, uma abordagem de computação granular é proposta para modelar fenómenos espácio-temporais a múltiplos NdDs, designada de modelo baseado em granularidades. Esta abordagem destaca-se da literatura por modelar um fenómeno através de declara-ções em vez de apenas utilizar os grânulos para modelar entidades abstractas do mundo real. Além disso, formaliza o conceito de NdD e segue uma abordagem automática para generalizar o fenómeno de um NdD para outro menos detalhado.
As práticas actuais trabalham num NdD conduzido pelos utilizadores apesar da iden-tificação dos NdDs apropriados ser um problema chave. É apresentada uma framework para sumarizar eventos espácio-temporais em múltiplos NdDs. Esta framework não faz qualquer assumpção sobre o fenómeno e a tarefa analítica. É apresentada uma aborda-gem de visualização analítica, que permite aos utilizadores inspeccionar um fenómeno em múltiplos NdDs, simultaneamente, ajudando a entender em quais NdDs a percepção do fenómeno se distingue ou em que NdDs emergem padrões.
List of Figures xv
List of Tables xix
1 Introduction 1
1.1 The Level of Detail Matters . . . 5
1.2 Research Statement . . . 7
1.3 Research Goals and Contributions . . . 8
1.3.1 Theory of Granularities . . . 8
1.3.2 Granularities-based Model . . . 9
1.3.3 SUITE Framework and Prototype . . . 10
1.3.4 Evaluation . . . 12
1.4 Thesis Structure . . . 12
2 Background and Related Work 15 2.1 Visual Analytics . . . 15
2.1.1 Understanding Spatiotemporal Data . . . 16
2.1.2 Information Visualization Approaches . . . 18
2.1.3 Automated Approaches . . . 25
2.1.4 Visual Analytics Applications . . . 27
2.2 Granular Knowledge Representation . . . 35
2.3 Modeling Phenomena at Multiple Levels of Detail . . . 38
2.3.1 Multirepresentation Approaches . . . 38
2.3.2 Multiresolution Approaches . . . 39
2.3.3 Granular Computing and Others Approaches . . . 40
2.4 Manifold LoDs Approaches . . . 42
3 Theory of Granularities 51 3.1 Reasoning over Granules . . . 55
3.1.1 Relations between Granules . . . 55
3.1.2 Distance Functions between Granules . . . 60
3.2 Relationships between Granularities . . . 61
3.4 Related Works and their Limitations . . . 64
4 Granularities-based Model 67 4.1 Granular Terms . . . 69
4.2 Predicate and Atoms . . . 71
4.3 Function Symbols . . . 75
4.3.1 Temporal Granular Terms . . . 76
4.3.2 Spatial Granular Terms . . . 80
4.4 Granularities-based Model in Action . . . 83
4.5 Related Works and their Limitations . . . 86
5 SUITE: A framework for SUmmarizIng spatioTemporal Events 87 5.1 SUITE’s Overview . . . 91
5.2 Abstracts . . . 94
5.3 Properties of Abstracts Functions . . . 96
5.4 Discussion . . . 98
5.5 Main Abstracts Implemented . . . 99
5.6 Related Works and their Limitations . . . 102
6 Experiments and Results 105 6.1 SUITE-VA Tool . . . 105
6.2 Experiments on Synthetic Datasets . . . 112
6.2.1 Poisson Cluster Process . . . 113
6.2.2 Contagious Process . . . 124
6.2.3 Log-Gaussian Cox Process . . . 127
6.3 Results on Real Datasets . . . 130
6.3.1 Forest Fires in Portugal . . . 131
6.3.2 Violence against Civilians in Africa . . . 133
6.3.3 Robberies in Chicago . . . 138
7 Conclusions and Future Work 141 7.1 Conclusions . . . 141
7.2 Future Work . . . 145
Bibliography 149
A The induced Relationships: Properties 159
B Topological Relations on Temporal Granular Terms 165
C Abstracts Implemented 173
1.1 An overview of three approaches to explore spatiotemporal events: The tool
onerefers to (Lins et al. 2013);tworefers to CrimeViz (Roth et al. 2010); and,
threecorresponds to VAiRoma (Cho et al. 2016). . . 3
1.2 Many LoDs to look for patterns. . . 6
2.1 Geometry Class from OpenGIS specification from (Ryden 2005). . . 17
2.2 Screenshot showing the entire collection techniques to visualize spatiotempo-ral data, listed atwww.timeviz.net. . . 20
2.3 Summary about Automatic Analysis Methods supported by the commercial VA tools (Zhang et al. 2012). . . 28
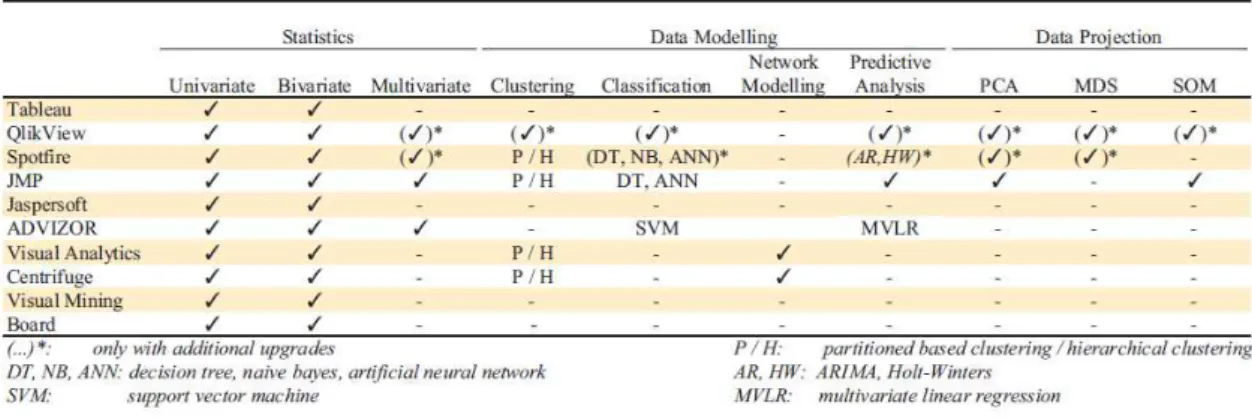
2.4 Summary about Visualization techniques supported by the commercial VA tools (Zhang et al. 2012). . . 28
2.5 Illustration of the space-time-attribute cube(Guo et al. 2006). . . 29
2.6 An overview of the VIS-STAMP interface (Guo et al. 2006). . . 30
2.7 An overview of the VA system proposed by (Maciejewski et al. 2010). . . 32
2.8 An overview of an application developed by (Lins et al. 2013). . . 32
2.9 An overview of the VA system proposed by (Ferreira et al. 2013). . . 33
2.10 An overview of the VAiRoma system proposed by (Cho et al. 2016). . . 34
2.11 Illustration of the Time Maps visualization and their heuristic interpretation Watson 2015. . . 43
2.12 A heated time map for tweets written by @BarackObama (Watson 2015). . . 44
2.13 An overview of the Pinus View prototype proposed by (Sips et al. 2012). . . 44
2.14 An overview of the Goodwin et al. 2016 approach. . . 45
2.15 An overview of the STempo (Robinson et al. 2016). . . 46
2.16 An overview of the PerSE prototype proposed by (Swedberg and Peuquet 2016). 48 3.1 Illustration of the granularity concept. . . 52
3.2 Example of a granularity defined overD1. . . 53
3.3 Example of a granularity defined overD2. . . 54
3.4 Example of a granularity defined over thecauseattribute provided by the data provider. . . 54
3.5 Illustration of the induced relations . . . 56
3.7 Four scenarios for granules belonging to S. . . 58
3.8 A transitive relation induces transitive partial relationships.. . . 59
3.9 Set of induced distances. . . 61
3.10 Illustration of relationships between granularities. . . 63
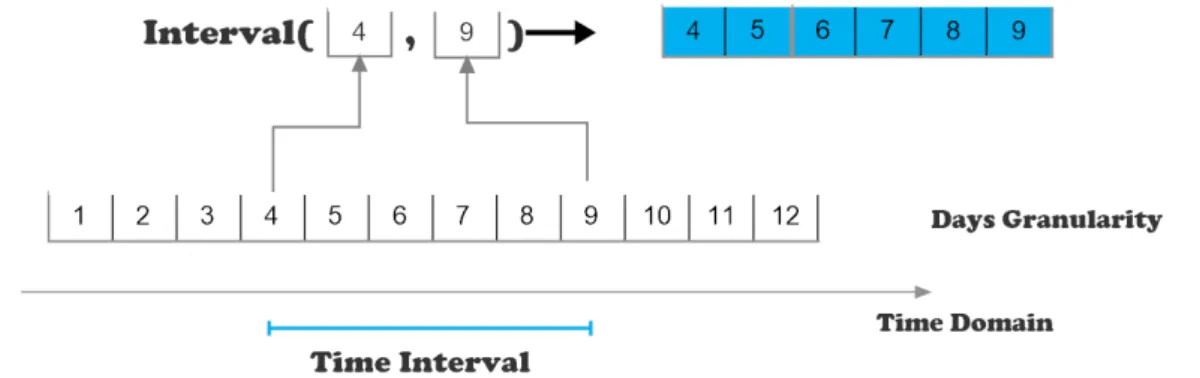
4.1 An illustration of a time interval be defined in terms of a temporal granularity. 70 4.2 Part of the Hasse diagram concerning the posetLstorm. . . 73
4.3 Example of atoms at different valid LoDs of the storm predicate. . . 74
4.4 Example of granular syntheses at theLoD4of the storm predicate. . . 75
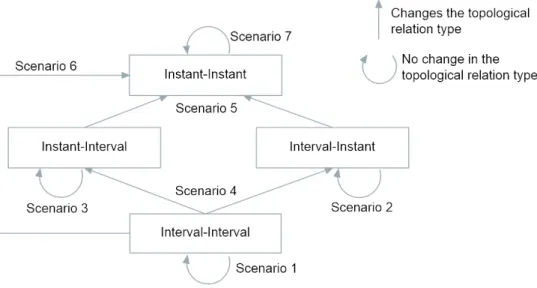
4.5 Possible transitions in the relationships between pairs of temporal terms. . . 79
4.6 Example of two temporal granularities related by the finer-than relationship. 79 4.7 First illustration of the generalization of temporal granular terms. . . 80
4.8 Second illustration of the generalization of temporal granular terms. . . 80
4.9 An example of a curve in the raster space. . . 81
4.10 Illustration of the generalization rules associated toGRasterRegion. . . 83
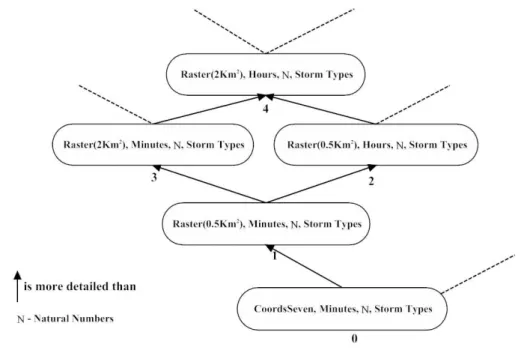
4.11 An overview of all atoms in LoDs containing the granularityRaster0.5km2. 85 4.12 An overview of all atoms in LoDs containing the granularityRaster8km2. . 85
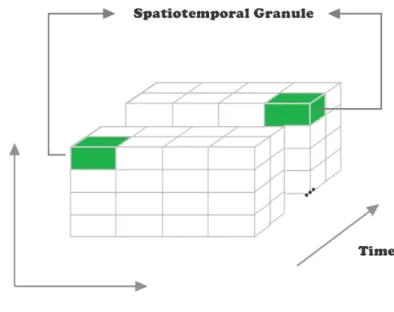
4.13 An overview of all atoms in LoDs containing the granularityRaster32km2. 85 5.1 Schematic representation of spatiotemporal granules. . . 89
5.2 Several graphical representations of atoms in terms of their spatiotemporal granules. . . 89
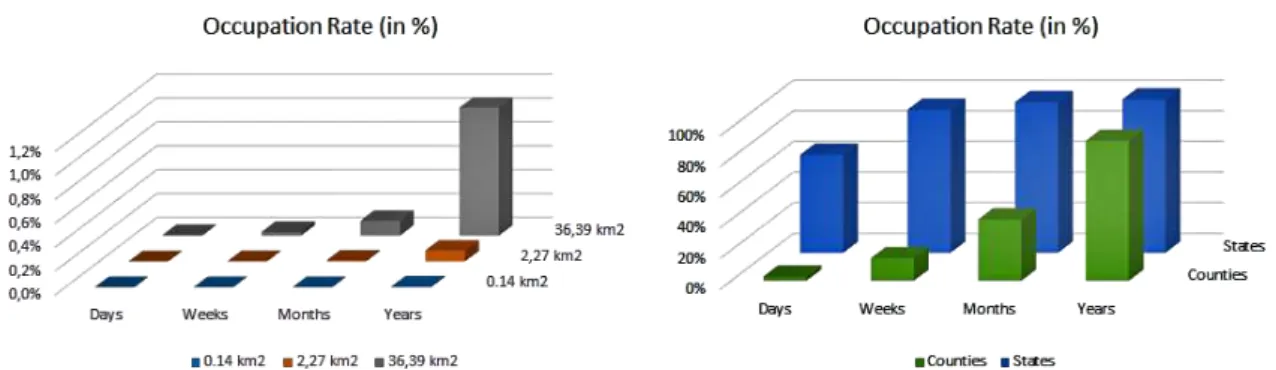
5.3 Schematic representation ofM(event)γ. . . 91
5.4 The occupation rate for different combinations of spatial and temporal granu-larities. . . 92
5.5 The occupation rate computed at each temporal granule. . . 92
5.6 The occupation rate computed at each spatial granule. . . 93
5.7 The intuition of the Global Abstract. . . 94
5.8 The intuition of the Spatial Abstract. . . 95
5.9 The intuition of the Temporal Abstract. . . 95
5.10 Summary of all Types of Abstracts. . . 97
6.1 The SUITE-VA tool architecture. . . 106
6.2 An overview of the structure of a matrix plot. . . 109
6.3 An overview of the SUITE prototype’s interface. . . 110
6.4 An overview of the SUITE prototype’s interface with Spatial Abstracts. . . . 111
6.5 An overview of the SUITE prototype’s interface with Temporal Abstracts. . . 111
6.6 Global Abstracts:GMBN, Occupation rate and Collision rate describing Dataset 2. . . 114
6.7 Correlation between the GMBN and the Collision rate. . . 115
6.9 The Temporal Center Mass’s Positioning for threeLoDsst. . . 117
6.10 The Spatial Average nearest neighbor and its z-score in fourLoDsst. . . 118
6.11 The Spatial ANN and its Z-score displayed in fourLoDsst. . . 119
6.12 Global Abstracts regarding Dataset 1, 3, 4, 5. . . 121
6.13 Correlation between the GMBN and the Average of the Spatial ANN (Compact Spatial Abstract). . . 123
6.14 Overview about Dataset 6 using Global Abstracts, Compact Spatial Abstracts and Compact Temporal Abstracts. . . 125
6.15 One Temporal Abstract at three differentLoDsst. . . 126
6.16 Two Spatial Abstracts about Dataset 6. . . 127
6.17 Overview about Dataset 7 (Log-Gaussian cox process) using Global Abstracts, Compact Spatial Abstracts and Compact Temporal Abstracts. . . 128
6.18 Dataset 7 (Log-Gaussian Cox process) - Correlation between the Coefficient of Variation of Temporal Frequency Rate and the Spatial Autocorrelation of Temporal Frequency Rate. . . 129
6.19 TheTemporal Frequency Rateat theLoDsst- (Counties, W eek) . . . 130
6.20 TheTemporal Frequency Rateat theLoDst - (Raster 41.27km2, W eek) and (Counties, W eek). . . 130
6.21 Overview of wildfires in Portugal using Global Abstracts, Compact Spatial Abstracts and Compact Temporal Abstracts. . . 131
6.22 The Spatial ANN and its Z-score displayed in fourLoDsst. . . 133
6.23 Filter the temporal granules in which the clusters of events are most pro-nounced atLoDsst - (Parishes, W eeks). . . 134
6.24 Overview of the attacks against civilians in Africa using Global Abstracts, Compact Spatial Abstracts and Compact Temporal Abstracts. . . 135
6.25 Violence against Civilians at theLoDsst -Raster(22268.15 km2), Y ears dis-played in three temporal granules - 2008,2009 and 2010. . . 136
6.26 Highlighting the temporal granules where the Violence against Civilians is more spatially clustered using theLoDsst - (Raster(22268.15km2), Months). 136 6.27 Violence against Civilians at theLoDsst-Raster(343.45km2), W eeksdisplayed in three different spatial extents. . . 137
6.28 Evolution of Violence against Civilians throughout time at theLoDsst-Raster(343.45 km2), Weeksin Nigeria. . . 138
6.29 Overview about robberies in the City of Chicago using Global Abstracts, Com-pact Spatial Abstracts and ComCom-pact Temporal Abstracts. . . 139
6.30 The Temporal Frequency Rate at theLoDst- (Communites, Month). . . 140
A.1 An antisymmetric relation induces an antisymmetric complete relation. . . . 160
A.2 A symmetric relation induces a symmetric complete relation. . . 160
A.3 A symmetric relation induces a symmetric existential relation. . . 160
A.5 A symmetric relation induces a symmetric weak relation. . . 162 A.6 An antisymmetric relation induces an antisymmetric partial relation. . . 163
2.1 Some applications evaluated by the project developed in (Lahouari et al. 2014) 23
3.1 The induced properties of relations based on the properties of relations in the
domain. . . 57
4.1 Percentage of atoms using the proposed granular terms. . . 83
6.1 Datasets of spatiotemporal events simulated. . . 113
B.1 Possible transitions in the scenario 1. . . 167
B.2 Possible transitions in thescenario 4a. . . 168
B.3 Possible transitions in thescenario 4b. . . 169
B.4 Possible transitions in thescenario 3. . . 170
C
h
a
p
t
e
1
I n t r o d u c t i o n
With the widespread adoption of location aware devices, organizations are gathering data (Committee et al. 2013), concerning information about geographic location and time (Li et al. 2016) at incredible rates. These data are usually called spatiotemporal data and contain information about natural phenomena or human activities occurring on or near the surface of the Earth like telecommunications, social networks, transport, health, meteorology and agriculture, among many others.
Many phenomena like crimes1, storms2, forest fires3, infectious diseases (Gabriel et al. 2013), traffic accidents4, social networks (e.g., Twitter) are being logged as a collection of spatiotemporal events at high levels of detail (LoDs).
A spatiotemporal event is a happening occurred in space and time (Yuan and Hornsby 2007). For example,homicide((41.8780377, -87.6294422), 09/05/2015 20:00, 2)stands for a homicide occurred on the latitude and longitude coordinates (41.8780377, -87.6294422) that happened at eight o’clock resulting in two victims; fire((42.013990, -8.454387), 27/07/2016 14:30, 130)describes a forest fire that has started at coordinates (42.013990, -8.454387) on 27th July 2016 at 14:30 hours leading to 130 hectares of burnt forest area. This way, spatiotemporal events could be described as data with the following structure:
event(S,T,A1,. . .,AN) whereSdescribes the geographic location of the event,T specifies the time moment, andA1,. . .,AN are attributes detailing what has happened.
1Crimes in City of Chicago:http://data.cityofchicago.org/ 2Storm events in USA:http://www.spc.noaa.gov/wcm/
Datasets of spatiotemporal events embody the spatiotemporal dynamics of phenom-ena that includes data attributes changing over time or establishing several relation-ships or interactions with the surrounding environment. Underlying the complexity/dy-namism inherent to spatiotemporal events, there might be hidden patterns to be uncov-ered (Miller and Han 2009).
Patterns are non-uniform distributions of events occurring in space or/and in time that reveal the underlying structure of a phenomenon (Mennis and Guo 2009). The appearance of crime hotspots in certain city areas is an example of a spatial pattern; hotspots of robberies near residential areas and hotspots of murders near town bars is an example of a spatial pattern with correlation between the attributes crime type and neighborhood type. An increase in the number of traffic accidents during the summer in every year is an example of a temporal pattern. The occurrences of tornadoes in particular spatial regions and in particular periods of the year, or the contagion of a disease are examples of spatiotemporal patterns.
Understanding patterns can be important for the decision-making of several orga-nizations. For example, in public safety (Leipnik and Albert 2003), crime analysts are interested in discovering spatiotemporal hotspots of crime events in order to effectively allocate police resources. Epidemiologists (Ostfeld et al. 2005) need to understand spa-tiotemporal patterns from disease events so that the officials can allocate resources to limit its spreading. In what concerns the environment, state officials aim to understand spatiotemporal patterns of wildfire occurrences so that optimal firefighting resources and development projects can be placed in appropriate areas (Hering et al. 2009).
Visual Analytics (VA) aims at extracting patterns from data through smart combina-tion of automatic algorithms and interactive visualizacombina-tion (Thomas and Cook 2006). By relying on human capabilities such as perception and domain knowledge, VA lets users to interactively explore the data and generate hypotheses while leveraging methods from knowledge discovery, data mining, artificial intelligence, statistics and mathematics.
Over the last years, several VA approaches have been developed that allow us to explore and analyze datasets of spatiotemporal events (Roth et al. 2010; MacEachren et al. 2011; Chae et al. 2012; Andrienko et al. 2013; Lins et al. 2013; Cho et al. 2016; Robinson et al. 2016). For example, the GeoVista research center developed CrimeViz (Roth et al. 2010) to study crimes and Senseplace (MacEachren et al. 2011) to support crisis management through the tweets posted; Lins et al. 2013 developed an approach to analyze numerous quantities of spatiotemporal events that was used to explore events about crimes, social networks, among others; Cho et al. 2016 developed an approach, called VAiRoma, for users to gain knowledge about places and events related to Roman history. An overview of the above mentioned tools’ interfaces can be seen in Figure 1.1.
corresponds to VAiRoma (Cho et al. 2016).
us to understand how the intensity of a phenomenon is distributed throughout the ge-ographic space, considering all or a particular time interval in which the phenomenon occurred; time series allow us to study how a phenomenon is distributed over time, con-cerning the entire geographic extent or a certain geographic region where a phenomenon occurs. Some examples of questions typically handled by these approaches are:
1. What is the spatial distribution of the phenomenon? Is it uniform or are there geographic regions with higher incidence?
2. How does the intensity of the phenomenon vary over time? Does it follow a decreas-ing or an increasdecreas-ing trend? Is there a cyclic pattern?
Let’s assume that we need to explore the dataset of spatiotemporal events about crimes in the city of Chicago, in particular battery crimes, using the tool made available by (Lins et al. 2013) (see the toolonein Figure 1.1). Notice that, the time series (at the bottom) and
crimes has a cyclical behavior over time and follows a decreasing trend. Looking at the map, we can see that the phenomenon is almost uniformly spatially distributed.
Although this tool (or similar ones) provides a spatial and temporal overview of the phenomenon that is enough to answer several questions, namely those mentioned, there may be a number of other questions, which can be important for several organizations (Leipnik and Albert 2003; Ostfeld et al. 2005). Some examples are given:
1. Does the incidence of events follow some spatiotemporal pattern so that the events occur together close in time and space? In that case, are these spatiotemporal hotspots occurring across the entire geographic extent in which the phenomenon occurs, or do they arise only in some geographic regions?
2. Does the occurrence of events follow any contagious behavior5?
3. Do the events occur geographically dispersed over time? Or do they occur in a clus-tered way? Are there changes in the spatial distribution? Do the events sometimes occur in a dispersed form and sometimes they happen in clusters? Do these changes follow a particular pattern over time? Or does the phenomenon generally have a stable structure (let’s say dispersed) and suddenly, in a particular moment in time, the events occur spatially clustered (moment of time as an outlier).
4. What is the pattern of occurrence of events over time concerning a particular ad-ministrative area? Do the events occur cyclically? Do the adad-ministrative regions close to each other following similar patterns of occurrence of events?
There is a substantial difference between the first set of questions presented and the second one. The first group is performing separate analyses of the spatial and the tem-poral dimension of the events, which are of limited value (Bogorny and Shekhar 2010; Møller and Ghorbani 2010; Wang and Yuan 2014). However, many pieces of information about the spatiotemporal dynamic of events like spatiotemporal patterns arise when one works with the spatial and temporal dimensions together, as the second group of ques-tions requires, something that’s challenging (Gabriel et al. 2013; Shekhar et al. 2015). One needs to account for the properties that distinguish spatiotemporal events from other types of data (Andrienko et al. 2010). These properties are dependency and heterogene-ity (Yao 2003). Dependency can be explained through Tobler’s first law: "everything is related to everything else but nearby things are more related than distant things" (Tobler 1970).
The other property is the spatial heterogeneity and temporal non-stationarity, i.e., spa-tiotemporal events do not follow a similar distribution across the entire space and over all time. Instead, different geographical regions and temporal periods may follow different distributions.
5A “cloud” of events occur near in space and time that slowly changes its spatial location throughout
Since, in general, present-day visual analytical approaches develop interactive visu-alizations to display the results of descriptive statistics, many patterns might not be captured (Kechadi et al. 2009; Miller and Han 2009; Shekhar et al. 2015). Even so, there are VA approaches (Maciejewski et al. 2010; Landesberger et al. 2012; Ferreira et al. 2013), usually developed to analyze a particular phenomenon (e.g., crimes), focusing on a particular kind of pattern (e.g, spatiotemporal hotspots). However, this may not be enough whether we aim at an approach independent from the application domain. Patterns might appear in many different forms and targeting a particular kind of pat-tern may leave many patpat-terns to be detected. Nevertheless, the importance of patpat-terns might depend on the specific application, the analysis question, and its concordance with domain knowledge (Keim et al. 2008; Sips et al. 2012).
1.1 The Level of Detail Matters
When one looks at spatiotemporal events, they can be expressed at different LoDs. The spatial location can be described using cells with different sizes (e.g., cells of 2 km2 or 8km2), cities, counties or states; and the time can be specified with a detail of minutes,
hours, months or years. The LoD reflects the size of the units in which phenomena are observed and often aggregated/summarized, most likely affecting our understanding of them (Marceau 1999; Andrienko et al. 2010; Laurini 2014).
A change in the LoD at which a phenomenon is observed can bring improvements to the analytical process (Camossi et al. 2008; Andrienko et al. 2010). From one LoD to another, some patterns can become easily perceived or different patterns may be detected. On one hand, different spatiotemporal phenomena exist and evolve at different LoDs, and on the other hand, a phenomenon may exhibit different patterns in different LoDs.
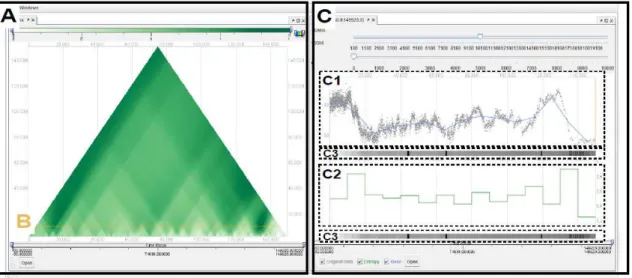
Some examples can be found in the literature. For example, Sips et al. 2012 describe a use case using glacial climate record data derived from an ice core from Dronning Maud Land, Antarctica. The ice core represents South Atlantic temperature in the past 150k years. Sips et al. 2012 provide the visualization method developed for scientists of the domain to detect strong temperature fluctuations. Those scientists report the highest fluctuations at the 10k year time scale (i.e., LoD) in comparison to other time scales. In that LoD, the highest fluctuations happened between the 10k-20k years before the present interval and 130k-140k years. This discovery allows them to make the hypothesis that the detected strong temperature fluctuations might be related to the 100k years cycle of the Milankovitch cycles6; Gabriel et al. 2013 investigate data about an epidemic in animals that occurred in 2001 at the Cumbria county in order to find out in what spatial and temporal LoDs the evidence of spatiotemporal hotspots emerge. In their approach, a change in the LoD means a change in the distance considered. The authors considered spatial distances of 5, 10, 15 km and temporal distances of 5, 10, 15 days. They found
6The 100k years cycle of the Milankovitch cycles describes the transition from a circular to an ellipsoidal
evidence of spatiotemporal hotspots in temporal distances less than 10 days, and spatial distances less than 5 km. More examples can be found in the literature (Qi and Wu 1996; Wu et al. 2000; Dykes and Brunsdon 2007; Camossi et al. 2008; Plumejeaud et al. 2011; Goodwin et al. 2016; Zhang et al. 2016).
The LoD matters for the perception of phenomena and their underlying patterns, and often, there is no exclusive LoD to study phenomena (Dykes and Brunsdon 2007; Camossi et al. 2008; Andrienko et al. 2010; Sips et al. 2012; Goodwin et al. 2016). Although the LoD plays a crucial role in data analysis and pattern detection, this issue has been ignored with commercial analytical tools (e.g., Qlik, Tableau Software) and most of the
state of the art proposals following a single LoD analysis approach (Dykes et al. 2005; Andrienko and Andrienko 2006; Power 2008; Zhang et al. 2012).
Users are left with the choice of the LoD(s) to look for patterns. The LoDs in which patterns can be perceived are often difficult to determine a priori (Sips et al. 2012). There might be several forms of patterns and these might be better perceived in some LoDs than in others, or even, different patterns might be perceived in different LoDs. If one considersntemporal LoDs andmspatial LoDs then there aren∗mspatiotemporal LoDs
that can be studied in order to look for patterns as illustrated in Figure 1.2. Looking for patterns in different LoDs might be time-consuming and unproductive, following an analysis approache based on a single LoD (Camossi et al. 2008; Andrienko et al. 2010; Sips et al. 2012; Goodwin et al. 2016).
Figure 1.2: Many LoDs to look for patterns.
approaches communicate information mainly through descriptive statistics with some exceptions but focusing on a very particular pattern and application domain. Both op-tions are not suitable for an early stage of analysis. Equally important, such approaches follow an analysis approach based on a single LoD, leaving the choice for the users. With-out any help, this choice will remain a challenging task, as discussed, contributing for the information overload when conducting analyses over spatiotemporal events at early stages.
1.2 Research Statement
To face the information overload, from the user perspective, the VA area introduced an analysis approach: "Analyze first, show the important, zoom, filter and analyze further, details on demand" (Keim et al. 2008) known as the Visual Analytics Mantra (VA Mantra). It aims
to provide the user with an understandable high-level overview of what is important, at an early stage of the analysis, thus reducing the data amount/complexity in order to make it analyzable and meaningful. Such approach aims to provide what is important from the available data to a given user at a given context so that he can conduct his analysis based on meaningful information.
When there is little information about a spatiotemporal phenomenon or the analyt-ical goals are vague, i.e., an early stage of analysis, a user will probably experience an information overload. In spatiotemporal events, an approach to overcome this problem is to move from a single user-driven LoD to a multiple LoDs (simultaneously) analysis approach , providing the user with an understandable high-level overview of the under-lying structure of the phenomenon for each LoD. By understandable high-level overview, we mean several hints about the distribution of events in space or/and in time that can provide a glimpse of the presence or absence of patterns. Following this approach, the user might detect very soon in what LoDs there are potential patterns and what kind of they are. According to his analytical goal and domain knowledge, the user would be able to better guide his analysis thus avoiding the information overload.
Despite the fact that literature recognizes the importance of LoD in the perception of phenomena and the need for users to study and explore phenomena across multiple LoDs (Dykes and Brunsdon 2007; Camossi et al. 2008; Andrienko et al. 2010; Sips et al. 2012; Goodwin et al. 2016), there are no approaches that work across several LoDs in the context of spatiotemporal events, and following the VA Mantra. The research problem addressed in this dissertation, can be stated as:
How can we help users explore phenomena logged as spatiotemporal events across multiple LoDs, simultaneously, helping them to understand in what LoDs there are patterns emerging?
namely knowledge representation, data processing and visualization. In detail, this work seeks to address the following problems:
1. How do we enable representation and reasoning about spatiotemporal events at dif-ferent LoDs? Making analyses across multiple LoDs requires modeling spatiotem-poral events at different LoDs.
a) What is a LoD? How do we formalize the concept of LoD?
b) How do we model a phenomenon at different LoDs?
c) Datasets of spatiotemporal events are collected at high LoDs. How do we follow a bottom-up automated approach in order to provide different phenomena’s representations for each LoD?
2. With the datasets of spatiotemporal events available at multiple LoDs, we aim to provide analyses across them.
a) How do we provide an understandable high-level overview about the underly-ing structure of the phenomenon for each LoD?
b) How will the users inspect and compare the phenomenon perception across multiple LoDs?
c) How do we provide an approach independent from the phenomenon without focusing on a particular analytical task or pattern?
A general overview of the problems solved and the results obtained during the research is given in the next section.
1.3 Research Goals and Contributions
The broad objective of the research introduced lies on enhancing exploratory analysis of spatiotemporal events, at early stages, by following analyses across multiple LoDs. Such approach aims to allow users to be able to inspect and compare the phenomenon’s perception across multiple LoDs. To observe spatiotemporal events at different LoDs, we first need to represent and reason about spatiotemporal events at different LoDs.
1.3.1 Theory of Granularities
Granular computing has emerged as a paradigm of knowledge representation and pro-cessing (Yao et al. 2013), where granules are basic ingredients of information. Roughly, a granularity defines a division of a domain in a set of granules disjoint from each other.
Counties,Statesare common examples of spatial granularities defined over the spatial
of psychosocial development (Erikson 1959) is an example of a granularity defined over the natural numbers7.
Granules can be useful to express spatiotemporal events at different LoDs. Let’s consider that we have a dataset of homicides events with the following structure: homicide(S, T, Killer Age). A homicide event originally logged as homicide((41.87803777,−87.62944228), 09/05/2015 20 : 42, 23) could be expressed at
coarser LoD likehomicide(Illinois, 09/05/2015 20h, Early Adulthood) using granules
from the granularities States, Hours, Erikson′s stages, correspondingly. However, in
general, the granularity definitions found in the literature are applicable to particular domains like the time domain (Bettini et al. 2000) or the spatial domain (Camossi et al. 2006). This prevents us from representing and reasoning about events at different LoDs following a granular approach since there are different domains of reference underlying the events’ features.
This PhD Thesis proposal introduces a formal Theory of Granularities (ToG) that allows the creation of granules over any domain of reference. This approach is more general than the current state of the art because the existing proposals appear as particular cases of the ToG proposed. Besides, it provides new instruments to reason over granules. Often, the domains of reference have relations defined between their elements. Four induced relations are proposed in order to transpose the relations defined in the domains of reference to the granules. Some of those relations have properties like symmetric, transitive, reflexive, antisymmetric, and antireflexive. The circumstances in which the induced relations inherit those properties were studied. This study goes together with formal proof conducted in the natural deduction system. These contributions led to one publication in the International Conference on Computational Science and Applications, and one publication in the International Journal Business Intelligence and Data Mining:
J. M. Pires, R. A. Silva, and M. Y. Santos, "Reasoning about Space and Time: Moving towards a Theory of Granularities," in Computational Science and Its Applications -ICCSA 2014, Springer, 2014, pp. 328–343
R. A. Silva, J. M. Pires, and M. Y. Santos, "A granularity theory for modelling spatio-temporal phenomena at multiple levels of detail," Int. J. Bus. Intell. Data Min., vol. 10, no. 1, p. 33, 2015.
1.3.2 Granularities-based Model
Using the ToG one can express individually spatiotemporal events at different LoDs. However, and up to this point, the concept of LoD is not defined and there is no model following an automated approach to generalize a phenomenon from one LoD to a coarser
7Erikson’s stages: (i) Infancy - 0-1 years; (ii) Early childhood 2nd year; (iii) Preschool age 3–5 years; (iv)
one. An automated approach is crucial as the number of LoDs from which one can perceive a phenomenon can be meaningful.
A granular computing approach was devised to model spatiotemporal
phe-nomena at multiple LoDs labeled as the granularities-based model. This
ap-proach models a phenomenon through a collection of statements where, roughly
speaking, granules are used in the statements’ arguments. For example,
homicide(Illinois, 09/05/2015 20h, Early Adulthood) is an example of a
state-ment concerning homicides in USA. Instead of single granules, complex
descriptions can also be assigned to statements’ arguments. For example,
tornado(RasterRegion(cells), Interval(09/05/2015 15 : 45, 09/05/2015 16 : 10), 20) stands for a tornado occurred on May 9th, 2015 between 15:45 and 16:10 pm, aff ect-ing a particular area with 20 victims. Complex descriptions are defined based on the general concept of granular term proposed in this PhD Thesis. Based on it, spatial gran-ular terms (Cell and RasterRegion) and temporal grangran-ular terms (Instant and Interval) were formalized.
The granularities-based model defines the concept of LoD and follows an automated approach to generalize a phenomenon from one LoD to a coarser one. When changing a phenomenon’s LoD a time interval can eventually be generalized to a time instant while a region might be simplified. This approach stands out from the related literature because (i) it models a phenomenon through statements rather than just using granules to model
abstract real-world entities; (ii) as opposed to current granular computing approaches which are mainly concerned with indexing and aggregating data at different granularities, the granularities-based model provides different phenomena’ representations for each LoD; finally (iii) a phenomenon can be expressed into other coarser LoDs in an auto-matic way. This research step led to two publications in the International Conference on Geographic Information Science:
R. A. Silva, J. M. Pires, M. Y. Santos, and R. Leal, "Aggregating Spatio-temporal Phenomena at Multiple Levels of Detail," in AGILE 2015, Springer International Publishing, 2015, pp. 291–308.
R. A. Silva, J. M. Pires, M. Y. Santos, "When Granules are not enough in a Theory of Granularities," in AGILE 2017, Springer International Publishing, 2017, (in press)
The granularities-based model was implemented in Java allowing to model phenom-ena stored as spatiotemporal events in a PostgreSQL database system. The module re-ceives a dataset of spatiotemporal events as input and generalizes the phenomenon for each coarser LoD available.
1.3.3 SUITE Framework and Prototype
Thesis proposal presents a framework forSUmmarizIng spatioTemporalEvents (SUITE) across multiple LoDs. This framework builds summaries, at different LoDs, about phe-nomena logged as spatiotemporal events. Based on it, the users are able to inspect and compare the phenomenon’s perception across multiple LoDs. As our framework does not make any assumption about the phenomenon and the analytical task, it can be widely used to get an overview of the phenomenon under analysis. The framework establishes five types of summaries working with space and time together. This allows us to frame and extend many proposals in the literature that create summaries of data in the proposed framework.
Using the SUITE’s framework, one can have many summaries measuring different facets of the distribution of spatiotemporal events providing hints about the absence or presence of different kinds of patterns. To the best of our knowledge, there are no approaches that work across several spatial and temporal LoDs, and that are independent from the analytical task and the application domain in the context of spatiotemporal events.
To conduct analyzes in this new mindset, a web-based VA approach implementing the SUITE framework was developed. The prototype allows to visually inspect hints about the absence or presence of different kinds of spatiotemporal patterns at multiple LoDs, following a coordinated strategy among the visualizations provided. Moreover, one can study how patterns (spatial or non-spatial) evolve throughout time and also whether they happen only in some geographic regions or in all the geographic extent of the phenomenon. Notice that, these analyses occur always at multiple LoDs supporting them according to their analytical goals and domain knowledge in the choice of the suitable LoD to narrow their analyses in the future.
These research steps led to one publication in the International Conference on Geo-graphic Information Science:
R. A. Silva, J. M. Pires, M. Y. Santos, and N. Datia, "Enhancing Exploratory Analysis by Summarizing Spatiotemporal Events Across Multiple Levels of Detail," in Geospatial Data in a Changing World, Springer International Publishing, 2016, pp. 219-238.
spatiotemporal events providing hints about the absence or presence of different kinds of patterns be fine-tuned according to the phenomenon at study.
1.3.4 Evaluation
The evaluation of our proposals was conducted with two types of datasets of spatiotempo-ral events: (i) synthetic datasets; (ii) real datasets. In order to produce synthetic datasets
a configurable generator of spatiotemporal events was used developed by (Gabriel et al. 2013) - R package (stpp). Using it, synthetic datasets with different spatiotemporal pat-terns like clustered, contagious, inhibitory, and infectious, in different spatiotemporal LoDs, with different cardinality were produced.
The real datasets used were: (i) forest fires in Portugal; (ii) the dataset made public
by the Armed Conflict Location and Event Data Project8about conflict and protest data, occurring in Africa and Asia; (iii) crimes in the city of Chicago. These datasets contain
in-formation about different phenomena occurring in different spatial extents and different temporal extents.
Evaluation with users was considered but turned out to be challenging. We cannot consider any kind of user because the kind of analysis that we are aiming at is directed to domain experts of phenomena logged through spatiotemporal events. Thus, having a considerable number of users with balance gender, ages, backgrounds in order to allow a suitable evaluation is a real challenge.
That being said, the SUITE prototype was used to explore both types of datasets bear-ing in mind that when we explored synthetic datasets we knew beforehand in what spa-tiotemporal LoD a particular pattern was generated. For most of the datasets produced, the SUITE tool was able to provide a correct overview of the "phenomenon" allowing us to identify the LoD(s) in which the pattern generated occurs, and therefore, the LoDs that should be used to detail the analysis.
We then look for the patterns identified previously in the real datasets. Recognizing some of the patterns in the phenomena logged into the real datasets, in different spa-tiotemporal LoDs was easy. Afterward, we use the SUITE tool to explore the real datasets from several perspectives pursuing other forms of spatiotemporal patterns. Several pat-terns were identified at different spatiotemporal LoDs.
1.4 Thesis Structure
The remaining of the PhD Thesis is organized in the following structure:
Chapter 2 introduces fundamental concepts necessary to clearly understand the follow-ing chapters. It also presents the state of art theories, approaches and tools related to the matters addressed by the thesis.
Chapter 3 presents the theory of granularities that enables us to represent and reason about spatiotemporal events at different LoDs.
Chapter 4 presents the granularities-based model that allows us to model phenomena
at different LoDs, following a bottom-up automated approach in order to provide different phenomena’s representations for each LoD. Then, a demonstration case with a real dataset about tornadoes in USA is made.
Chapter 5 introduces a framework forSUmmarizIng spatioTemporal Events (SUITE)
in order to help users explore phenomena logged as spatiotemporal events across multiple LoDs, simultaneously.
Chapter 6 presents the web-based VA prototype, called SUITE-VA, that implements our main contributions. Afterwards, the evaluation is presented in order to discuss if the broad objective was reached.
Chapter 7 concludes the PhD Thesis summarizing the results achieved and discussing
C
h
a
p
t
e
2
Ba c k g r o u n d a n d R e l a t e d Wo r k
The PhD Thesis addresses new foundations to model phenomena (particularly the ones logged through spatiotemporal events) at multiple LoDs so that we can have a bottom-up automated approach in order to provide different views of a phenomenon for each LoD. Also, it seeks to enhance an exploratory analysis of spatiotemporal events by following analyses across multiple LoDs. In this chapter, we present an overview of the fundamental concepts related to the thesis and discuss the state-of-art on its research field. This chapter is organized as follows.
A background about VA research area is given in Section 2.1. Since VA is a multidisci-plinary field, an overview about the main research areas is provided. This section ends by presenting and discussing several VA approaches, supporting analyses based on a single LoD that have been developed to make exploratory analysis of spatiotemporal events.
To conduct analyses across multiple LoDs, we need to be able to represent and model data at different LoDs. Granular computing and its granularities concepts show potential-ities to represent spatiotemporal events at different LoDs. For this reason, the state-of-art about granularities is discussed in Section 2.2. Furthermore, there are several works in the literature for modeling spatiotemporal phenomena at multiple LoDs. A discussion about the state-of-art of these approaches is given in Section 2.3.
Our broad goal is to enhance the exploratory analysis over spatiotemporal events through analyses at multiple LoDs. Therefore, the state-of-art about approaches conduct-ing analyses at multiple LoDs is discussed in Section 2.4.
2.1 Visual Analytics
methods with a tight coupling through human interaction in order to gain knowledge from data (Keim et al. 2008).
VA aims to combine human strengths (i.e., domain knowledge, cognitive capabilities) with the storage and processing capabilities of today’s computers to gain insights into complex problems. Typical preprocessing tasks are like data cleaning, normalization, aggregation, or integration of heterogeneous data sources are performed. After that, an user may choose between applying visual or automatic analysis methods. If the latter is used first, data mining algorithms are used in order to compute patterns from data. Through the visualization methods, users are able to get insights from the generated patterns as well as interact with the automatic methods by modifying parameters or selecting other analysis algorithms.
Toggling between visual and automatic methods is a key characteristic of the VA (Keim et al. 2008; Silva et al. 2012). This is particularly useful when there is little information about the phenomena under study or the analytical goals are vague, once a user is directly involved in the analysis process and may adjust his analytical goals based on the results that he is getting. Phenomena recorded as spatiotemporal events fit this description, since frequently users aim to identify patterns that are unknown in advance. Equally important, the human involvement in the analytical process is crucial as the appropriate LoDs may depend on the specific application, the analysis in question, and the domain knowledge.
To deal with spatiotemporal data and the challenges that they it poses on data pro-cessing and interactive visualization methods, several research areas are involved in the visual analytics science, namely: (i) spatiotemporal data models that provide a formalism to represent and reason about the spatiotemporal data (Erwig and Schneider 2002; Gal-ton 2009); (ii) knowledge discovery concerns to provide useful patterns dealing with the
complexity of spatiotemporal data (Leung 2009; Mennis and Guo 2009; Miller and Han 2009); (iii) information visualization to develop novel visualization techniques in order
to make them effective to visualize spatiotemporal data (Aigner et al. 2008; De Chiara et al. 2011). An overview of these research areas is given as follows.
2.1.1 Understanding Spatiotemporal Data
Everything that is spatial is also temporal. Spatiotemporal phenomena always occur at some location in some time period.
Timeis generally modeled based on two temporal primitives: time instants or time intervals. Furthermore,Timeis also modeled as linear or cyclic; continuous or discrete;
with total order, partial order or branching (Frank 1998a; Aigner et al. 2008).
Time instants have no duration while a time intervalI is the set of all time instants
between a starting point (denoted byI−) and an ending pointI+. Time points are limited
questions like whether the events started/ended together, whether events overlapped in time including all the questions that time points could answer. The theoretical approaches to modeling time have been studied in literature (Vilain 1982; Allen 1983; Frank 1998b).
There are three types of topological relations considering time instants and time intervals. Firstly, there are relations between pairs of time intervals. Such relations were defined in Allen’s algebra (Allen 1983) which models all possible relative positions between two time intervals. There are 13 different possibilities. They are: after, before, meets, met by, during, contains, equal, finishes, finished by, starts, started by, overlaps, and overlapped by. Secondly, there are relations that can be held between time instants and time intervals or vice-versa. These relations were introduced by Vilain’s algebra (Vilain 1982) which models all possible relative positions between a time instant and a time interval. There are 8 basic relations in the V-algebra: before, starts, started by, during, contains, finishes, finished by, after. Finally, there are relations that can be held between time instants. These relations come from point algebra:<,≤,=,,,>,≥.
Figure 2.1: Geometry Class from OpenGIS specification from (Ryden 2005).
for more complex objects resulting from the combination of multiple objects like a cluster of islands.
A spatial data type defines the properties and operations on objects in space. Opera-tions on spatial data types include, for instance, the geometric intersection, union, and difference of spatial objects, the computation of the length of a line or the area of a region, the test whether two spatial objects overlap or meet, and whether one object is north or southeast of another object (Egenhofer and Sharma 1993; Schneider and Behr 2006).
Spatiotemporal data is being stored through different data types, capturing different spatiotemporal dynamics. Spatial data can be categorized into three models, i.e., the ob-ject model, the field model, and the spatial network model (Worboys and Duckham 2004). Spatiotemporal data, based on how temporal information is additionally modeled, can be categorized into three types, i.e., temporal snapshot model, temporal change model, and event or process model (Allen 1984; Kraak and Ormeling 2003; George et al. 2007; Yuan and Hornsby 2007; Alamri et al. 2014).
In the temporal snapshot model, spatial layers of the same theme are time-stamped. For example, if the spatial layers are points or multi-points, the set of temporal snapshots results into trajectories of points or georeferenced time series in case the variables are being observed at different times on fixed locations. Similarly, snapshots can represent trajectories of lines and polygons, or raster time series.
The temporal change model represents spatiotemporal data with a spatial layer at a given start time, and then, considers just incremental changes. For example, it can represent motion (i.e., speed and acceleration on spatial points) as well as rotation and deformation on lines and polygons.
Event and process models represent temporal information in terms of events or pro-cesses. The events are happenings (e.g., crime) whose properties do not change over time while the processes represent entities that are subject to change over time (e.g., movement of a person or car).
For different spatiotemporal data types different approaches have been proposed, in different research areas, so as to get more knowledge out of them. The research we conducted is focused on events has been already introduced. We discuss the current state of the art concerning the geovisualization and give an overview about automatic approaches. Subsequently several VA approaches mainly targeting spatiotemporal events were researched and further discussed.
2.1.2 Information Visualization Approaches
3D visualizations, a well-known example is Google Earth1. Color theory deals with the suitable choice of colors in order to enhance the readability or help the visual analysis of data. For example, the work proposed by (Harrower and Brewer 2003) helps people to select good color schemes for maps and other graphics.
The number of visualization methods that have been developed is quite big (Bostock et al. 2011)2. We present some examples. Maps are essential to understand the location, extent and/or distribution of spatiotemporal events, spatial relationships, as detailed in (Bédard et al. 2007). The Parallel Coordinates (Inselberg and Dimsdale 1991) were designed to deal with multi-attribute data; the Circleview (Keim et al. 2004) method was designed to allow the user to observe temporal data in a cyclical way.
To understand the dynamic of spatiotemporal events, animated maps (Andrienko and Andrienko 2006) and change maps (Andrienko and Andrienko 2006) are often used. However, maps only represent multi-attribute data and dynamism (Bédard et al. 2007; Aigner et al. 2011); change maps are limited to small amounts of data and a few snapshots (each map representing a time instant or a time interval); the effectiveness of animated maps is therefore compromised (Tversky et al. 2002).
The role of visualization is an open issue when dealing with numerous spatiotemporal events at high LoDs. The visualization methods get easily cluttered and become difficult to analyze (Silva et al. 2012; Li et al. 2016). Visualization methods allowing the under-standing of spatiotemporal events at different LoDs are still an issue that the information visualization’s literature doesn’t handle. This happens because a visualization needs to combine the spatial and temporal dimensions in a smart way in order be understandable, which, in our opinion and as you can see on the lines below, is quite challenging.
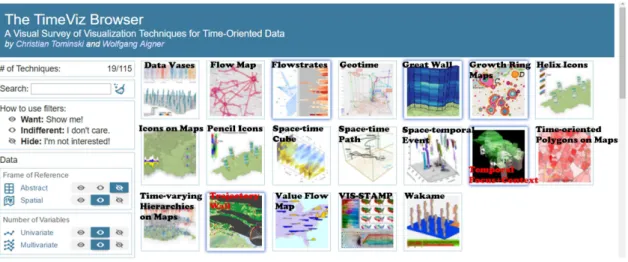
Aigner et al. 2011 make a comprehensive survey of techniques used for visualizing time-oriented data3. The visualizations were framed according to the following cate-gories:
Frame of Reference: Abstract vs Spatial Abstract data (e.g., a bank account) has been collected in a non-spatial context and is not per se connected to some spatial location. Spatial data (e.g., spatial events) contains an inherent reference to spatial locations.
Number of variables: Univariate vs Multivariate Univariate data contains only one
data value per temporal primitive, whereas in the case of multivariate (or multi-attribute) data each temporal primitive holds multiple data values.
Time Arrangement: Linear vs Cyclic Linear time corresponds to an ordered model of
time, i.e., time proceeds from the past to the future. Cyclic time domains are composed of a finite set of recurring time elements (e.g., the seasons of the year).
1Google Earth:https://www.google.com/earth/
Time Primitives: Instant vs Interval Time instants have no duration. A time interval, on the contrary, has a temporal extent greater than zero.
Visualization Mapping: Static vs Dynamic Static mapping maps time to space or maps
time to visual variables (Bertin 1983) whereas dynamic mapping maps time to time. The former approach means that time and data are represented in a single coherent visual representation; as opposed to that, dynamic representations use the physical dimension of time to communicate the time dependency of the data.
Dimensionality: 2D vs 3D The representation of the temporal and spatial dimension in a visualization can be either two-dimensional or three-dimensional.
Along with the visualizations studied (Aigner et al. 2011), the site (www.timeviz.net) also allows users to filter the visualizations according to different categories proposed. By choosing just visualization methods developed for spatial data, keeping all the other categories, i.e., picking all the available visualization methods designed to analyze spa-tiotemporal data, the results gathered are shown on Figure 2.2.
Figure 2.2: Screenshot showing the entire collection techniques to visualize spatiotempo-ral data, listed atwww.timeviz.net.
From the 115 visualization methods surveyed by Aigner et al. 2011, just 19 were designed to display spatiotemporal data. From these 19, 4 (Flow Map, Flowstrates, Space-time Path, Trajectory Wall) were designed to show movements of objects over Space-time, which is out of the scope of this work.
and the event’s attributes can be encoded with visual variables like size, color, among others (Bertin 1983). However, 3D visualizations commonly suffer from occlusion and overplotting, making it difficult to grasp spatiotemporal patterns from their visual in-spection.
A similar issue emerges from the 4 visualization methods (Data Vases (Thakur and Rhyne 2009), Helix Icons (Tominski et al. 2005), Pencil Icons (Tominski et al. 2005), Wakame (Forlines and Wittenburg 2010)) that use 3D diagrams over geographic regions as well as from the 2 visualization methods (Icons on Map (Fuchs and Schumann 2004), Value Flow Map (Andrienko and Andrienko 2004)) that use 2D diagrams to map the corresponding data values varying over time. Notice that, in order to use these last 6 men-tioned visualization methods in a context of spatiotemporal events, we have to aggregate them by geographic regions. However, the diagrams can have a difficult readability if the number of geographic regions under study is high, or if they are quite close to each other.
The Time-oriented Polygons (Shanbhag and Rheingans 2005) might have also read-ability problems. This approach creates a partition of each polygon (2D) where each partition maps a value regarding a time period (using the color). The readability prob-lems will emerge whether one considers small polygons or/and many time-periods. From the remaining results obtained, the most relevant for the analysis of spatiotemporal events might be: the Great Wall of Space-time (Tominski and Schulz 2012), VIS-STAMP (Guo et al. 2006) and Growth Ring Maps (Andrienko et al. 2011).
The Great Wall of Space-time (Tominski and Schulz 2012) creates a 3D wall based on a topological path over a cartographic representation. This wall is used to display how the data values associated to the geographic regions belonging to the path vary over time. This approach is not suitable to analyze spatiotemporal events because they are spread out in space and time. Therefore, we are not generally interested in a particular spatial path to analyze the phenomenon.
VIS-STAMP (Guo et al. 2006) is not a visualization method but a visual analytical approach that encompasses several visualization methods such as matrix plot, change maps, parallel coordinates that will be discussed later on in Section 2.1.4.
As mentioned, the design of a visualization method that aims to combine the spatial and temporal dimension of data is not trivial. Perhaps that’s why from 115 visualization methods surveyed by Aigner et al. 2011, we only have 19 visualization methods for spatiotemporal data. Their usage for spatiotemporal events was further discussed in this work, and in short, they have some problems handling spatiotemporal events. Another characteristic which is transversal to the visualization methods discussed is that they encode data into visual representations at certain LoDs. In fact, from our perspective, the visualizations should be used according to the LoD of the input data in spite of the issues identified for using them. For instance, Spatiotemporal event Visualization (Gatalsky et al. 2004) should be used when spatiotemporal events are provided at high LoDs (latitude and longitude coordinates) while the Time-oriented Polygons (Shanbhag and Rheingans 2005) should be used when the events are aggregated by some administrative level (e.g., counties) and by year.
In general, a visualization method produces a single representation of data. In order to make this representation effective, the visualization methods are designed taking into account the analytical goal and sometimes the data (Aigner et al. 2011). However, the analysis of spatiotemporal data frequently requires coordinated views in order to deal with the spatial, temporal, and thematic aspects of data simultaneously (Dykes et al. 2005). This approach has become standard in the recent applications of visual analysis because they directly support the expression of complex queries using simple interactions (Dykes et al. 2005; Scherr 2008; Weaver 2010).
In the project carried out by Lahouari et al. 2014, a set of geovisualization applica-tions that allows us to study spatiotemporal phenomena in space and time were assessed. Such approaches were researched during a period of 6 months by 5 different people, inde-pendently, without havinga prioria criterion of the target audience or the phenomenon
or the technology implemented.
In total, 47 applications were studied and characterized based on ten criteria. Note that, an application might hold more than one value for a particular criterion. The first criterion considered was the types of spatial dynamics which the application was developed for. The ones considered as well as the percentage of applications studied for that type of spatial dynamic were: (i) spatiotemporal events - 25%; (ii) change in
space (e.g., land use, Urbanization) - 38%; (iii) change of shape (e.g., black tide, cities’
boundaries) - 6%; (iv) movements of individuals (e.g., daily trajectories of people) - 28%; (v) flux movement between places (e.g., home - work) - 19%.
Among the applications studied, 25% were developed to analyze phenomena logged as spatiotemporal events. From these, we left out from our next discussion the appli-cations Marine Traffic, Quick Route and ReRouteMe as they are focused on the spatial
movement. All the others are shown in Table 2.1.
Application
Goal SpaceRepresentationTimeRepresentation Spatial Granularity
Time
Granularity Source
CartoVista Exploration Map Space Multiple Multiple
https: //cartovista.com/ demos/CustomFlash/ CrimeAnalysisDemo/ CrimeAnalysisDemo. html
CrimeViz Exploration Map Space andTime Multiple Multiple (Roth et al. 2010) Data Rose - Ring Maps Exploration Map Space Simple Multiple* (Zhao et al. 2008)
HerbariaViz Presentation Map Space Simple Multiple
https://www.geovista. psu.edu/herbaria/v3/ index.html
How music travels Story Cartogram Space andTime Multiple* Simple
http://www.thomson.co. uk/blog/wp-content/ uploads/infographic/ interactive-music-map/ index.html
Mesure de la radioactivité
dans l’environnement Presentation Map Attribute Simple Simple Not available
The Growth of Newspapers Across the U.S.
Presentation and
Exploration Map Space Simple Simple
http://web.stanford. edu/group/ruralwest/ cgi-bin/drupal/ visualizations/us_ newspapers The Photographer’s Ephemeris Presentation and Prediction
Map Space Simple Simple http:
//photoephemeris.com/
Visualizing emancipation Story andExploration Map Space, Time,Attribute Multiple Simple http://dsl.richmond.
make simple presentations of data (i.e., visualization of the location of events in space or/and in time) , 55% allow exploration of data, 11% make predictive analyses and 22% build stories with data.
The representation of space (i.e., location) was also defined as a criterion. A detailed discussion is not provided here as the majority of applications use maps to display the location of events.
Another criterion assessed was how time is represented. In this case, three different representations of time were considered: (i) through time as happens with animated
visualizations (e.g., one second animation represents a year of time); (ii) using space like a line chart (e.g., 1 cm on a line chart represents a year time period); (iii) or as a data
attribute (e.g., coloring events according to their date). This criterion is similar to the
Visualization Mappingcategory discussed by Aigner et al. 2011. Most applications, 88% to be precise, use space to represent time through charts (e.g., Line Chart, Circleview) while 22% represent time as a data attribute and 33% use animation.
Another aspect evaluated was the ability of applications to view data in different temporal LoDs. The value for this criterion can be simple (the data is viewed in a single LoD and cannot be changed) or multiple (the data can be viewed in several temporal LoDs, one at a time or simulaneously). 56% of applications follow a simple approach while 44% follow a multiple approach. Similarly, in the case of space, 56% of applications follow a simple approach while 44% change the spatial LoD of analysis.
When the value for the previous criteria is multiple, the application might view data at multiple LoDs, one at a time, or simultaneously. In what concerns, onlyData Rose - Rings Mapsallows multiple temporal granularities simultaneously, while, in space, multiple
spatial granularities are just supported byHow music travels. Last but not least, none of
the applications support data view at multiple spatial and temporal granularities (i.e., spatiotemporal LoDs) as it’s aimed by this work.
The remaining criteria (Lahouari et al. 2014) are not detailed here as they do not have enough relevance for this work.