Experimental Analysis of the Thermal Entrainment Three Dimensional
Effects in Re-Circulated Air Curtains
Pedro Dinis Gaspar1, L.C. Carrilho Gonçalves2, R.A. Pitarma3 1,2
University of Beira Interior, Electromechanical Engineering Department, Covilhã, Portugal 3
Polytechnic Institute of Guarda, High School of Technology and Management, Guarda, Portugal
Corresponding email: [email protected]
SUMMARY
The application of air curtains devices to HVAC&R systems have been developed in order to improve the thermal and mass separation between two contiguous spaces with differentiated air behaviours.
The refrigeration equipments installed inside commercial spaces and open to the surroundings suffer alterations of their thermal behaviours and energy efficiency due to variations in
magnitude and orientation of the air velocity. The location of the air conditioning system discharge grilles, the mass flows rates originated by pressure differences due to openings to the external environment and the air flow perturbation due to the circulation of the consumers nearby the opening of the display cases, among others, affect the re-circulated air curtain behaviour and the overall performance of the equipment.
This study presents the experimental results obtained from tests carried out for the climatic class n.º 3 of EN 441 (Tamb = 25 ºC, φamb = 60%; vamb = 0,2 m/s) and the analysis of the three-dimensional effects observed in the thermal interaction through the air curtains installed in open vertical refrigerated display cases.
The obtained results are related to the air temperature, air relative humidity and air velocity measurements fields throughout the air curtain. From the analysis of the obtained results some comparable effects in the fields of the same properties for the display space of the exposition and conservation of food products and nearby the inlets/outlets of the air mass flow, can be sorted out.
The evaluation of the ambient air velocity three-dimensional effects in the pattern of this type of turbulent air flow is obtained. Additionally, it is verified that the longitudinal airflow fluctuations and the length extremity effects of the display case have a considerable influence in the overall thermal performance of the equipment.
The non-uniform distribution of the air temperature, relative humidity and velocity throughout the air curtain determines temperature differences in the linear dimension display space and inside the food products, affecting the correct behaviour of the display cases. Besides that, this study helps to show some of the fragilities of the numerical models bi-dimensional formulation.
INTRODUCTION
The applications of air curtains systems have been developed in order to improve the thermal and mass separation of two spaces with different air behaviours. The development of these systems is related to the air conditioning inside buildings, the thermal comfort and the air quality for the refrigeration and conservation systems of food products. The consequences of the developing applications in this technical area are the continuous growing of electric energy consumption and the increasing costs. Air curtains systems are normally used in commercial and industrial applications in order to preserve differentiated air ambient conditions between contiguous thermal spaces. For these spaces the external accessibilities must be maintained open, due to operative or commercial functions. For typical equipments exists a strong relationship between the air curtain aerodynamics behaviour and the overall thermal efficiency. According to [1] an air curtain is a controlled stream of air moving across
the height and width of an opening with sufficient velocity and volume to reduce the infiltration or transfer of air from one side of the opening to the other and/or to inhibit insects, dust or debris from passing through. Nowadays it can be seen a faster increase in the
utilization of the air curtains as a technical solution, working as thermal and mass barriers between two contiguous differentiated air spaces. It must be pointed out that air curtains can be of the non re-circulated type, normally used in commercial spaces and refrigeration systems and of the re-circulated type air curtains, usually applied at open refrigerated display cases designated for perishable food conservation as this study deals with. The commercial refrigeration sector is becoming much more important due to also the crescent needs of fresh food products in urban areas, a better regulation and control of the food sector and also due to the exigencies of the product quality by the consumers. This implies a more intensive
utilization of equipments for conservation and exposition of food products (and its refrigeration systems) and the consequent increase of electrical energy consumption. The study provided by [2] presents the state of the art of the numerical and experimental investigations concerning the air curtains thermal performance and indicates that there is still a need in identifying, quantifying and optimizing all the variables involved in the overall aerothermodynamics performance of re-circulated air curtains. The investigation works on the non re-circulated air curtains are mainly related with heat and mass transfer’s studies
concerning the evaluation of the heat transfer in air curtains with: an impingent jet of several angles, some initial velocities and temperatures and different thicknesses and with
generation/suppression of turbulence inside the air stream. The main objectives of these studies were the determination of air curtain thermal efficiency and the overall energetic performance of the aerothermodynamics system. It was concluded that: (1) the heat transfer and discharge velocity of the air curtain are proportional; and (2) the air curtain height and width and its velocity are parameters that affect the performance of air curtains. Other works have evaluated the performance of air curtains subjected to external perturbations to
investigate the thermal interaction between air curtains and the controlled air space, the mixed convection and the ratio of height and width of the air curtain. Several studies have combined analytical and experimental procedures to estimate the heat transfer through re-circulated air curtains, sorting out correlations using Reynolds, Nusselt, Grashoff, and Prandtl numbers. Usually the experimental tests are conducted according to [3] using several experimental measurement techniques like thermocouple thermometry, hot wire/film anemometry, laser Doppler anemometry, digital particle image velocimetry, hygrometry, tracer gases, infrared thermography, among others. The study provided by [4] presents the state of the art of the CFD application in food processing industry including drying, sterilisation, refrigeration and mixing, being among them, studies concerning the thermal and energetic efficiency of the air curtain used in open refrigerated display cases. A revision [5] of the use of numerical methods
such as finite difference, finite element and finite volume analysis to describe the
heating/cooling processes in the food industry. More recently, [6-7] presented a review of the application of CFD and other numerical modelling techniques to the prediction of air flow in refrigerated food applications including cool stores, transport equipments and retail display cases. Some of those works get out correlations for the heat transfer behaviours for equipment conception, like the Nusselt number correlation equation and determined also the energy charge for cooling. The influence of Richardson and Reynolds numbers on the streamlines at the discharge grille has also been investigated as well as the influence of the discharge air velocity on the performance of the aerothermodynamics barrier of a non re-circulated air curtain. Nevertheless, being the application of CFD devoted to substitute and/or reduce the experimental character of the studies, it continues to have difficulty in accurately overlapping the experimental results. The accuracy and reliability of CFD simulations predictions are based on the deep knowledge of the mathematical and numerical models. Additionally, the judgement of how the simplifications affect the precision of the solution is determining. The infiltration load comprises around 70% of the cooling load of open refrigerated display cases, so it is necessary to improve its efficiency and consequently of the re-circulated air curtains design in order to develop strategies to deal with a more rationalization of energy consumption in the food conservation sector [8]. Moreover, due to empirical design considerations related to the re-circulated air curtain there is an excessive spill over of the refrigerated air that comes from the open refrigerated equipment. This leads to improper requirements of the supermarket air conditioning systems, which turns in additional electrical energy costs. It is stated that the reduction of the thermal load is the first step for the increase of the energy efficiency attempt of refrigeration equipments through the optimization of the air curtain, allowing a reduction in the thermal entrainment with ambient air and, being the returned air to the evaporator at a lower temperature [9]. The main objective of our study is to investigate the three dimensional profile of the thermal entrainment in re-circulated air
curtains and its effects on the thermal performance, i.e., the distribution of the air temperature and humidity in a refrigerated display case, to allow a better understanding of the phenomena and reduce the energy consumption. There is still the need for deep studies in the complex processes of controlling the re-circulated air curtains and the governing phenomena of these aerothermodynamics systems taking into account the reduction of thermal and mass
interaction between the two air spaces. This work involves experimental tests and theoretical analysis with the aim to present the three-dimensional profiles of referred properties along and across the air curtain in order to optimize the design of display cases for a better thermal behaviour and energy efficiency improving. Additionally, the experimental results intend to advice about the accuracy deviations that will be obtained using CFD models with
bi-dimensional formulation. Since the flow phenomena inside air curtains systems are occurring at three-dimension level (3D), it is required the development of CFD models that can take into account the sidewalls effect. The application of CFD techniques can develops at the design stage of a display cabinet/air curtain system, parametric studies dedicated to the performance optimisation through modifications of ducts or grilles or of the air curtain flow pattern. These numerical results can give useful information about the influence of geometric parameters and the operating conditions on the thermal performance and behaviour of the air curtain system, suggesting improvements to a previously defined configuration.
CASE STUDY – OPEN REFRIGERATED DISPLAY CASE
The vertical refrigerated display cases possesses a frontal opening to the environment that present several technical problems, resulting in a greater need for studies and investigations. The attempts for the thermal performance increase are limited by several constrains, due to
the simultaneous technical, commercial and economic requirements. A large part of commercial spaces that installed this type of refrigerated equipments opened to the surrounding air, are based in air curtains to promote a thermal barrier, without physical
restrictions for the costumer. In Figure 1 is exposed a typical configuration of an open vertical refrigerated display case. The air is sucked through the ventilators located in front of the evaporator. During the passage through the evaporator, the air is cooled at the conservation temperature of the perishable products exposed in the shelves of the equipment. This air mass flow rate is conducted to a posterior duct, where part of this air mass is discharged at low velocity across the back panel perforation in the exposition and conservation volume. Most part of this air mass flow will supply the air curtain, which will develop vertically between the discharge and return grilles. The air curtain is used in order to reduce the external infiltration of air from outside at higher dry temperature and specific humidity. However, the
aerothermodynamics performance of the air curtain is affected by diffusive effects that
increase the entrainment, and some external boundaries instability, among other consequences leading to a minor conservation quality of the food products and greater energy consumption and costs. Thus, and considering the increasing evolution of the requirements presented by the commercial spaces and consumers, there is a need to develop numerical and experimental studies in order to understand the relevant physical behaviours as well as to do the
optimization of the overall behaviour and energy efficiency. EXPERIMENTAL TESTS
Experimental apparatus
This experimental study develops the work done before and extends the analysis [10]. The experimental study follows the methodology provided by EN 441 Standard [3] for the test of open refrigerated display cases concerning the M-package temperature class M1 (-1 ºC < Tcons < 5 ºC) and for the test room climatic class n.º 3 (Tamb = 25 ºC, φamb = 60 %, vamb = 0,2 m/s being the air movement longitudinal to the length of the equipment). The dimensions of the vertical refrigerated display case in the present work are 1900 × 800 × 2000 mm. It has four shelves and its opening height, H, is about 1260 mm. The refrigeration system uses in-situ condenser-compressor units. The development and execution of the field tests was done with the collaboration of a refrigerated display cases manufacturer (Jordão Cooling Systems®), being all experimental tests done in a prototype in R&D department of this manufacturer. The experimental tests were developed in a climatic chamber Aralab - Fitoclima 650000 EDTU. In Figure 1 is presented the cabinet location and orientation inside the climatic chamber, the distribution of the test probes in the area designated to the exposition and cold conservation of perishables products, as well the probes positioning system.
a) Cabinet location. b) Test probes distribution. c) Probes positioning system. Figure1. Cabinet location inside climatic chamber and test probes distribution.
It was used a data acquisition system Intab PC-Logger 3100 to connect the probes exposed in Table 1, distributed inside the refrigeration equipment as presented in Figure 2. Also in Figure 2 are presented the location and dimensions of the: width of the air curtain (bsupply = 60 mm); height of the opening (H = 1260 mm); and the discharge air angle (γ = 5º). In order to
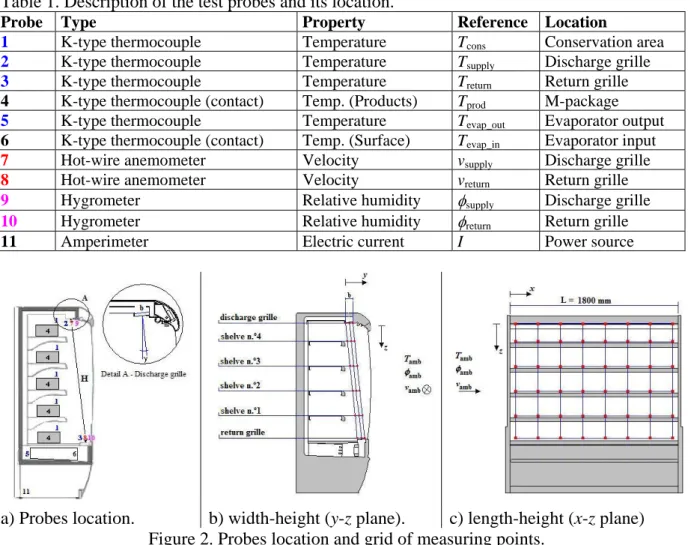
consolidate the measurements, was used a thermo-anemometer AM 4003 to measure the air temperature and velocity near the discharge and return grilles, the refrigeration unit and perforated back panel. In same locations, the pressure loss was measure using a micro-manometer Air Instruments Resources MP3KDS. The internal surface temperatures were obtained with K-type thermocouple contact probe using a digital thermometer FLUKE 51. Table 1. Description of the test probes and its location.
Probe Type Property Reference Location
1 K-type thermocouple Temperature Tcons Conservation area
2 K-type thermocouple Temperature Tsupply Discharge grille
3 K-type thermocouple Temperature Treturn Return grille
4 K-type thermocouple (contact) Temp. (Products) Tprod M-package
5 K-type thermocouple Temperature Tevap_out Evaporator output
6 K-type thermocouple (contact) Temp. (Surface) Tevap_in Evaporator input 7 Hot-wire anemometer Velocity vsupply Discharge grille 8 Hot-wire anemometer Velocity vreturn Return grille 9 Hygrometer Relative humidity φsupply Discharge grille 10 Hygrometer Relative humidity φreturn Return grille
11 Amperimeter Electric current I Power source
a) Probes location. b) width-height (y-z plane). c) length-height (x-z plane) Figure 2. Probes location and grid of measuring points.
Testing procedure
The main procedure described in EN 441 Standard [3] was followed to accomplish the experimental tests. They begin with the start up and running of the climatic chamber’s air conditioning system three hours before starting up the refrigeration system of the display case, to reach indoor air temperature and relative humidity steady states. Then, it was considered a delay of two hours to accomplish the desired conservation air temperature inside the
refrigerated display case, before loading it with the M-packages at the adequate conservation temperature. The experimental data was collected during 12 hours when the steady state test conditions were reached. It had been done several series of experimental tests to evaluate the influence of the surroundings air in the air temperature, velocity and humidity inside the exposition and conservation space. The average values of the physical properties measured
were calculated in order to reduce the experimental results uncertainty, concerning the
repeatability of the measurements. A probes positioning system was used to evaluate the three dimensional effects of the thermal entrainment in the air curtain (see Figure 1.c). This system was settled in each shelve of the equipment, and it measure the air temperature, relative humidity and velocity for three positions across the air curtain (y/b = 0; 0,5; 1 – see Figure 2.b) and for eight vertical cross-sections along the equipment length (x/L – see Figure 2.c). Since the equipment has 1800 mm long, the positioning system measures the properties values in 240 mm increments. The positioning system takes one minute to move between positions to reduce the flow perturbation. Also, the data measurements of the values of the properties were done after one minute staying in the defined position to ensure the flow stabilization. Figure 2 presents the grid measuring points represented by red dots (z). EXPERIMENTAL RESULTS
In Table 2 are presented the average temporal values of the physical properties since they had been obtained in transient state. The air temperature inside conservation space (probes n.º 1) and the internal temperature of the M-packages (probes n.º 4), were obtained through the linear dimension average values in order to extract global values of the properties inside the conservation space. It also presented the statistical parameters of the properties variation: maximum and minimum values; standard deviation (σ); standard error of mean (s); and the variance (σ2
). In Figure 3 are presented the air temperature, velocity and relative humidity variations for several locations along length (x/L) and across (y/b) the air curtain.
Table 2. Experimental average results for climatic class n.º 3.
Probes 1 2 3 4 5 6 7 8 10 11 12
Property Tcons Tsupply Treturn Tprod Tevap out Tevap in vsupply vreturn φsupply φreturn I
Unit ºC ºC ºC ºC ºC ºC m/s m/s % % A Mean 3,94 2,83 9,24 2,87 -1,09 -0,84 1,34 1,67 78,66 96,42 6,94 Max. 6,04 14,10 11,48 3,53 3,24 15,82 1,44 1,86 99,54 99,54 8,93 Min. 2,66 1,66 7,59 2,09 -3,12 -2,87 1,13 1,11 68,61 89,190 0,29 σ2 0,52 1,13 0,39 0,17 1,29 5,86 6,0×10⁻⁴ 7,2×10⁻³ 18,82 4,01 8,13 σ 0,71 1,06 0,63 0,36 1,14 2,42 0,02 0,09 4,34 2,00 2,85 s 0,04 0,06 0,04 0,02 0,06 0,14 1,4×10⁻³ 4,8×10⁻³ 0,25 0,11 0,16
a) Air temperature, T [ºC]. b) Air velocity, v [m/s]. c) Air relative humidity, φ [%]. Figure 3. Measurements profiles for y/b = 0 (z); = 0,5 (S); = 1 () along the length x/L.
DATA ANALYSIS AND DISCUSSION
The analysis of the air temperature, relative humidity and velocity experimental results along and across the air curtain presented in Figure 3 suggest the increase of the thermal
entrainment with length and downward the air curtain. The increase of the thermal
entrainment with the length of the equipment is due to the increase of the air mixing between the inside air and the exterior air of the border of the air curtain. The mixing due to the formation of eddies will be more pronounced as the length of the opening increases. This determines the increase of the temperature of the exterior border of the air curtain. Same situation occurs for the relative humidity, but in this case the mixing will reduce the relative humidity as the length increases. For the air velocities, the values are approximately constants along the length of the opening. However, it must be pointed out that near the extremities of the equipment the influence of the sidewalls are pronounced.
Considering the analysis of the experimental results downward the air curtain, it is possible to indicate that the air curtain is almost isothermal along height, since the values of air
temperature, relative humidity and velocity remain approximately constants (showing the same qualitative tendency along length). Due to turbulence intensity at the initial region of the jet that promotes the thermal entrainment, it is showed that the air curtain thickness increases due to eddy interactions and consequently to mixing and entrainment, as it moves away from the discharge to the return grille at the bottom. The air curtain flow characteristics are
dominated by viscous, momentum and gravitational forces that can be expressed by dimensionless parameters. According to [11], the deflection modulus, Dm (Equation 1.), describes the ability to provide proper sealing of a refrigerated display case open to the surroundings. This dimensionless number represents the ratio of air curtain momentum to the magnitude of horizontal forces, caused by temperature difference either side of the curtain (stack effect). The stack effect is created by the difference in air densities on the two sides of the opening and results in a linear variation in pressure from the top to the bottom. In the analytical model to assist in the design of air curtains provided by [11], the minimum value of the Dm for proper air curtain sealing, lies between 0,12 and 0,25 when the turbulence intensity is less than 1 %, and with a height/width (H/b) ratio between 10 and 100.
amb cons 2 2 supply supply supply ρ ρ ρ − = H g u b Dm (1)
Considering the properties values presented in Table 2, and density of air: ρsupply = 1,2735 kg/m3; ρcons = 1,2683 kg/m3; ρamb = 1,1700 kg/m3, and viscosity: μsupply = 1,7259×10⁻⁵ kg/m⋅s, it is obtained a deflection modulus, Dm = 0,09, which represents an air curtain with inadequate thermal sealing. Rearranging Equation 1, the air velocity at the discharge grille should be comprised between 1,55 m/s and 2,24 m/s. Analysing Table 2, not even the maximum value of vsupply reaches these values. This is the first indicator of the limitations of the present design of this specific refrigerated display case.
The Reynolds number, Re, and the Richardson number, Ri, can be calculated making use of Equation 2. and Equation 3. (Re representing the ratio of momentum to viscous forces and Ri representing the ratio of buoyant forces to momentum forces). A higher Re means a relative predominance of momentum forces to viscous forces and a higher Ri means that the buoyant forces are pronounced relatively to the momentum ones.
supply ⎟⎟ ⎠ ⎞ ⎜⎜ ⎝ ⎛ = μ ρ bu Re (2)
(
)
2 supply amb supply supply amb u b g Ri ρ ρ ρ − = (3)According to [12], a typical air curtain Ri value was found to be 0,3 and Re in the range of 5000–8000 for refrigerated display cases in a conventional configuration and flow rate. Also, it is stated that for Ri = 0,2 it means good thermal insulation.
The obtained values, Re = 5933 and Ri = 0,029 suggests the following comments:
(1) As exposed by [13], the Re has a direct effect on the entrainment due to its role in the development of turbulence and mixing. For Re = 4200 the entrainment rate increases with the turbulence intensity and for Re = 3200, the effect of turbulence intensity is minimized and the slight turbulence reduces the entrained air volume. However, a low Re value reduces the stability of the air curtain which starts to spread, trigging more mixture and higher
temperature at the return grille. It is recommended to run the discharge grille at Re of about 3200–3400 to minimize ambient air entrainment without violating the stability of the air curtain structure [13]. Considering the obtained value for Re ( = 5933), the entrainment through the air curtain is due primarily by mixture due to the turbulence.
(2) The low value of Ri ( = 0,029) obtained suggests an isothermal air curtain since it is nearly zero as exposed by [14]. Considering Figure 3, the thickness of the air curtain grows after the discharge grille. The reduced value of Ri indicates that the momentum forces dominate buoyancy forces. According to [14] the Ri is independent of Re for values between
Re = 3800-8500. As obtained by [15], the momentum force would promote thermal
entrainment but the gravitational force would suppress it.
The thermal influence of ambient air can be defined by the thermal entrainment ratio, α, defined in Equation 4. This equation allows the calculus of the thermal entrainment, since it will be zero if the air curtain has no entrainment for Treturn = Tsupply (unreachable condition) and it will increase with the enthalpy, h, of return air grille. When return air is all from the ambient air, Treturn = Tamb, the thermal entrainment ratio will reach unity.
supply amb supply return h h h h − − = α (4)
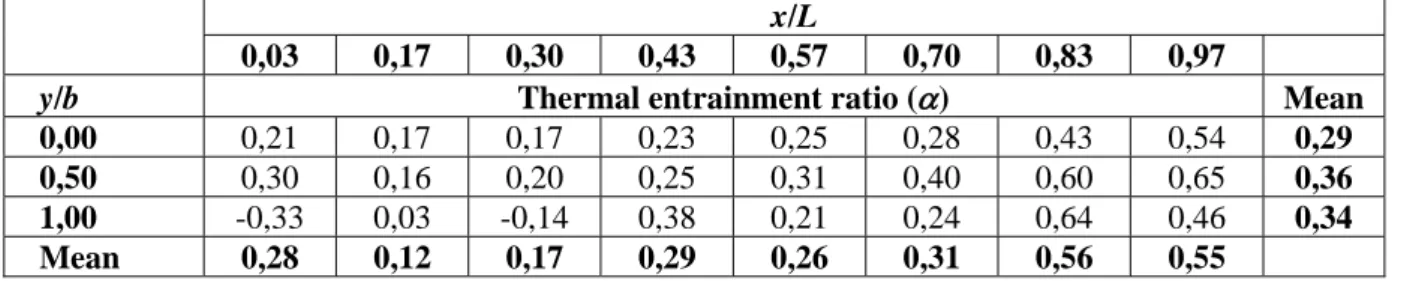
In Table 3 are presented the results of the thermal entrainment ratio. Some discrepancies can be observed through the values of the thermal entrainment ratio for the external border (y/b = 1) due to proximity of the equipment’s illumination.
Table 3. Thermal entrainment ratio, α, along length (x/L) and across (y/b) the air curtain.
x/L
0,03 0,17 0,30 0,43 0,57 0,70 0,83 0,97
y/b Thermal entrainment ratio (α) Mean
0,00 0,21 0,17 0,17 0,23 0,25 0,28 0,43 0,54 0,29
0,50 0,30 0,16 0,20 0,25 0,31 0,40 0,60 0,65 0,36
1,00 -0,33 0,03 -0,14 0,38 0,21 0,24 0,64 0,46 0,34
Mean 0,28 0,12 0,17 0,29 0,26 0,31 0,56 0,55
The overall value of the thermal entrainment ratio, α = 0,32, is adequate with those found by [14-15] for the Re and Ri obtained.
The analysis of Table 3 indicates that the thermal entrainment:
(1) increases with the length of the equipment. This condition suggests that the ambient air velocity parallel to the opening of the equipment will increasingly promote the thermal entrainment along the length. The high values of the thermal entrainment at the nearest sidewall locations (x/L = 0,03 and x/L = 0,97) can be attributed to side wall effects, as the air
curtain is unable to restrict the free entry of the external air at the extremities of the
refrigerated display case. This is corroborated by the experimental results [16]. Thus, the three dimensional vortices at the side walls provide one of the mechanism for hot ambient air entrainment.
(2) at the external border (y/b = 1) is minor comparatively to the middle plane (y/b = 0,5).
This condition is due to the interaction with ambient air at all height of the opening, being an interface region. The negative values indicate that the vortices formed at the external border of the air curtain imply the leakage of refrigerated air to the surroundings. At the middle plane, the thermal entrainment ratio is higher due to the higher difference between the supply air temperature (colder) and the return air temperature mixed mixing with the surroundings air (warmer). At the internal border (y/b = 0) the thermal entrainment ratio decreases, since the
difference between the supplied and return air temperature is lower.
As present by [14] the net thermal energy loss rate per unit length of the display case due to entrainment can be given by E = &mcp
(
Treturn −Tsupply)
. Rearranging the equation in terms of Reand α, it will produce an expression that represents a net thermal energy loss factor,
E* = α Re, considering in the equation E =
(
μRe)
cpα(
Tamb −Tsupply)
, that μ, cp and the temperature difference will be approximately constants. For this specific case the net thermal energy loss factor due to entrainment is approximately E* = 1900 revealing a low thermalentrainment when compared with the results of the mentioned authors. CONCLUSIONS
This experimental work was conducted to study the three dimensional effects of the thermal entrainment in the air temperature, relative humidity and velocity along and across re-circulated air curtains installed in refrigerated display cases. It was investigated the effect of tests conditions followed in EN 441 Standard for the test room climatic class n.º 3
(Tamb = 25 ºC, φamb = 60 %, and being vamb = 0,2 m/s parallel to the opening of the equipment) in the thermal entrainment.
The results obtained show that the air curtain temperature and relative humidity have
variations along the length of the opening suggesting how the thermal entrainment evolutes. The entrainment of ambient air is fundamentally due to the eddy formation, developed by shear layer interactions and is enhanced by the turbulence intensity at the initial region of the air curtain jet. Several dimensionless parameters appropriated to describe the air curtain flow characteristics were calculated. For the case study it was found that the air curtain discharge velocity was less than the value needed to promote an adequate thermal sealing. However, the obtained Reynolds number suggests that the thermal entrainment downward the air curtain is stronger function of eddies formation that triggers mixture than the low strength that reduces the air curtain stability. This is also verified by the value of the Richardson number which indicates that the momentum forces relatively to buoyant forces promote thermal entrainment. The analysis of the thermal entrainment ratio along and across the air curtain indicates that it is increased along the length due to interchange between the air discharged by air curtain and ambient air. This analysis also revealed the high values of the thermal entrainment at the initial and final linear dimensions due to side wall effects. Ambient air movement (from left
to right) influences and magnifies the extremity effects. Across the air curtain, the thermal entrainment ratio values indicate the spillage of refrigerated air to the surroundings due to vortices formation. These conditions will promote a non-uniform air temperature distribution inside the refrigerated display case and influences the differences in the product temperature. Additionally, the ambient air movement affects the return air temperature and consequently the energy efficiency of the equipment.
Considering the increasing use of computational simulation by Computational Fluid
Dynamics (CFD) for the numerical solution of the fundamental conservation equations as an engineering support tool for design project, this study shows that the development of
numerical models based in a bi-dimensional formulation will trigger accuracy deviations and reduce the reliability since the sidewalls effect aren’t taken into account.
REFERENCES
1. AMCA. 1991. AMCA Standard 220-91 – Test methods for air curtain units. AMCA. 2. Navaz, H K, Dabiri, D, Amin, M and Faramarzi, R. 2005. Past, present, and future research
toward air curtain performance optimization. ASHRAE Transactions. vol. 111 (1). 3. European Standard EN 441. 1998. Refrigerated display cabinets, parts 1 to 12. European
Comittee for Standardization.
4. Xia, Bin, and Sun, Da-Wen. 2002. Applications of computational fluid dynamics (CFD) in the food industry: a review. Computers and Electronics in Agriculture. vol. 34 (1-3).
5. Wang, Lijun and Sun, Da-Wen. 2003. Recent developments in numerical modelling of heating and cooling processes in the food industry. Trends in Food Science & Technology. vol. 14. 6. Smale, N J, Moureh, J and Cortella, G. 2006. A review of numerical models of airflow in
refrigerated food applications. International Journal of Refrigeration. vol. 29 (6).
7. Norton, T and Sun, Da-Wen. 2006. Computational fluid dynamics (CFD)-an effective and efficient design and analysis tool for the food industry: a review. Trends in Food Science & Technology. vol. 17 (11).
8. Faramarzi, R. 1999. Efficient display case refrigeration. ASHRAE Journal. vol. 41 (11). 9. ASHRAE. 2006. ASHRAE Handbook: Applications. ASHRAE, Inc.
10. Gaspar, P D. 2002. Estudo numérico e experimental do desempenho térmico de equipamentos expositores refrigerados. Dissertação de Mestrado. Universidade da Beira Interior. (in
portuguese)
11. Hayes, F C and Stoecker, W F. 1969. Design data for air curtains. ASHRAE Transactions. vol. 75 (2).
12. Field, B and Loth, E. 2004. An air curtain along a wall with high inlet turbulence. ASME Journal of Fluids Engineering. vol. 126 (3).
13. Navaz, H K, Henderson, B S, Faramarzi, R et al. 2005. Jet entrainment rate in air curtain of open refrigerated display cases. International Journal of Refrigeration. vol. 28 (2).
14. Field, B S and Loth, E. 2006. Entrainment of refrigerated air curtains down a wall. Experimental Thermal and Fluid Science. vol. 30 (3).
15. Chen, Yun-Guang and Yuan, Xiu-Ling. 2005. Experimental study of the performance of single-band air curtains for multi-deck refrigerated display cabinet. Journal of Food Eng. vol. 69 (3). 16. D’Agaro, P, Cortella, G and Croce, G. 2006. Two- and three-dimensional CFD applied to