Abstract
This paper is concerned with the fatigue prediction models for estimating the multiaxial fatigue limit. An equivalent loading approach with zero out-of-phase angles intended for fatigue limit evaluation under multiaxial loading is used. Based on experimen-tal data found in literatures, the equivalent stress is validated in Crossland and Sines criteria and predictions compared to the predictions of existing multiaxial fatigue; results over 87 experi-mental items show that the equivalent stress approach is very efficient.
Keywords
High cycle fatigue, criteria, proportional loading, non-proportional loading, fatigue limit.
Fatigue Equivalent Stress State Approach Validation
in Non-conservative Criteria: a Comparative Study
1 INTRODUCTION
Most industrial applications involve high-cycle fatigue problems since they are designed to operate in the elastic region for a long machine life (Papadopoulos, 2001). According to Budynas (2004) there is no universal approach or parameters that can strongly correlate a multiaxial fatigue process with its life, due to the complexity of factors in loading, material and environment.
The engineering approach to solving the multiaxial fatigue problem is to find the equivalent stress (Braccesi et al. 2008; Tsapi and Soh, 2013); however, design engineers are often faced with difficulties in applying these approaches to multiaxial fatigue design of high cycle fatigue compo-nents, as in Budynas and Nisbett (2011); Cristofori et al. (2008); Li et al. (2009). One difficulty is that most of the existing multiaxial fatigue criteria can only provide good predictions for
propor-Kévin Martial Tsapi Tchoupou a
Bertin Désiré Soh Fotsingb
a Bandjoun University Institute of
Tech-nology, Department of Mechanical Engi-neering, University of Dschang Came-roon. E-mail:tsapimartial@yahoo.com b Bandjoun University Institute of
Tech-nology, Department of Mechanical Engi-neering, University of Dschang Came-roon.
E-mail:sohfotsing@aol.fr
http://dx.doi.org/10.1590/1679-78251784
K.M.T Tchoupou and B.D.S. Fotsing / Fatigue Equivalent Stress State Approach Validation in None-conservative Criteria: a Comparative Study
2507
Latin A m erican Journal of Solids and Structures 12 (2015) 2506-2519
tional (in-phase) loading, like reported by Weber et al (2001); Goncalves et al. (2005); Papuga (2011). Another difficulty involves their implementation for general complex multiaxial fatigue load-ing that permits arbitrary stress histories such as the variation of the principal stress directions during the stress cycle history (Lambert et al. (2010); Soh et al. (2013); Li et al. (2015)). In this case, it is hard to track the path of each principal stress direction at each moment in time.
Many authors assume that the crack initiation is governed by the second invariant of the deviatoric stress tensor and the hydrostatic stress (Cristofori et al. 2008; Li et al. (2009); Cristofori et al. 2011; Jingran et al. 2015). Among current multiaxial fatigue criteria, stress invariant-based criteria, such as the Crossland (1956) and Sines (1955) models are attractive for engineering design of high cycle fatigue components because it is easy-to-use. Due to their nature, stress invariant based criteria are generally considered to be efficient from a computational point of view and usable in advanced design methodologies, such as computer aided design if accurate and reliable (Cristofori et al. 2008). The decision to improve on the predicting capacity of stress invariant based criteria derives from the requirement of minimum computational times that a virtual simulation instrument must involve. Crossland and Sines stress invariant based criteria can provide good predictions for proportional and non-proportional loads. However, they are not conservative for general complex multiaxial fatigue loading as shown in the works of Weber et al. (2001); Papadopoulos et al. (1997); Goncalves et al. (2005); Papuga (2011).
In this paper, the Tsapi and Soh (2013) equivalent multiaxial stress state with zero out-of-phase angles is reviewed and compared to well known fatigue criteria. The work starts with the presenta-tion of a method of assessing multiaxial fatigue criteria [secpresenta-tion 2]. The non-conservative predicpresenta-tions obtained from Crossland and Sines models, using 87 experimental items are presented, and then the procedure for the account of the mobility of principal stress direction in non-conservative multiaxial fatigue criteria is presented [section 3]. Results of validations and comparisons with experimental data are given [section 4]. Conclusions are finally presented [Section 5].
2 THEORETICAL BACKGROUND
2.1 Experimental Data
Latin A m erican Journal of Solids and Structures 12 (2015) 2506-2519
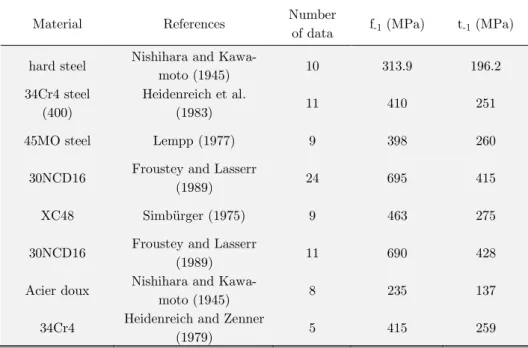
Table 1: Synthesis of the fatigue properties for the considered materials.
2.2 Fatigue Methods of Assessment
Several methods of assessing multiaxial fatigue criteria are used in the literature. Some of the methods are based on the use of the safety factor, while others make use of the fatigue strength error index.
The fatigue strength method consists in defining fatigue strength (E) for the criterion. When the fatigue limit is attained, the fatigue strength yields the value one, for a constant amplitude
multiaxial fatigue l”ad. The fatigue stre“gth err”r i“dex ΔI expressed i“ perce“tage ΔI (%) is
defined by Goncalves et al. (2005) as:
E 1
100% I (1)
Whe“ the value ”f ΔI is cl”se t” zer”, fatigue limits predicti”“s are exact. If ΔI is p”sitive predicti”“s are c”“servative.
While f”r a “egative ΔI, predicti”“s are said t” be “”“-conservative, the criterion does not pre-dict fracture, although it did occur in the experiment.
By using the values of the fatigue strength error index, it is possible to evaluate the fraction of the total number of experimental fatigue tests for which satisfactory predictions are given by a fatigue criterion.
It is common practice to sum the results of predictions in a histogram, (see Papadopoulos et al. (1997); Goncalves et al. (2005)). This kind of prediction evaluation is sufficiently representa-tive and readily understandable.
Material References Number
of data f-1 (MPa) t-1 (MPa)
hard steel Nishihara and
Kawa-moto (1945) 10 313.9 196.2
34Cr4 steel (400)
Heidenreich et al.
(1983) 11 410 251
45MO steel Lempp (1977) 9 398 260
30NCD16 Froustey and Lasserr
(1989) 24 695 415
XC48 Simbürger (1975) 9 463 275
30NCD16 Froustey and Lasserr
(1989) 11 690 428
Acier doux Nishihara and
Kawa-moto (1945) 8 235 137
34Cr4 Heidenreich and Zenner
K.M.T Tchoupou and B.D.S. Fotsing / Fatigue Equivalent Stress State Approach Validation in None-conservative Criteria: a Comparative Study
2509
Latin A m erican Journal of Solids and Structures 12 (2015) 2506-2519
3 ACCOUNTING THE MOBILITY OF THE PRINCIPAL STRESS DIRECTIONS
3.1 Assessment of Crossland and Sines Criteria
The Crossland and Sines criteria are among the oldest and best-known fatigue criteria. The fa-tigue strength of the Crossland criterion proposed in 1956, Crossland (1956), is in the form
c max , H c a 2 c J E (2)
While the fatigue strength of the Sines criterion, Sines (1955) is
s mean , H s a 2 s
J
E
(3)Material parameters c, c, s, and s, are derived from three simple uniaxial tests: the fully
re-versed bending f-1, the fully reversed torsion limit t-1, and the fully repeated bending limit f0.
3 1 f t 3 ; t 1 1 c 1 c (4) 3 f t 6 ; t 0 1 c 1
s
(5)
I“ Equati”“s 2 a“d 3, √J2a is the amplitude of the square root of the second invariant of the
al-ternating deviator stress tensor; H,max is the maximum hydrostatic stress, H,mean is the mean
hydrostatic stress.
A comparison of predictions through Crossland and Sines criteria over 87 experimental items of Tables 2-9, with 17 of them with fixed principal stress directions, was made and the values of the fatigue strength error index reported in Tables 10-13. With the type of loadings; Ϯ: mean stress and out of phase induced mobile principal stress directions; *: out of phase induced mobile principal stress directions; §: mean stress induced mobile principal stress directions.
Table 2: Experimental fatigue data of hard steel
(f-1=313.9MPa, t-1=196.2 MPa), from Nishihara and Kawamoto (1945).
Test number
xx,a
xx,m
xy,a
xy,m
1-1 138.1 0 167.1 0 0
1-2* 140.4 0 169.9 0 30
1-3* 145.7 0 176.3 0 60
1-4* 150.2 0 181.7 0 90
1-5 245.3 0 122.6 0 0
1-6* 249.7 0 124.8 0 30
1-7* 252.4 0 126.2 0 60
1-8* 258.0 0 129.0 0 90
1-9 299.1 0 62.8 0 0
Latin A m erican Journal of Solids and Structures 12 (2015) 2506-2519 Table 3: Experimental fatigue data of 34Cr4 steel (400)
(f-1=410MPa, t-1=256 MPa, Rm=710 MPa), from Heidenreich et al. (1983).
Test
number
xx,a
xx,m
xy,a
xy,m
3-1 328 0 157 0 0
3-2* 286 0 137 0 90
3-3 233 0 224 0 0
3-4* 213 0 205 0 90
3-5§ 266 0 128 128 0
3-6Ϯ 283 0 136 136 90
3-7Ϯ 333 0 160 160 120
3-8§ 280 280 134 0 0
3-9Ϯ 271 271 130 0 90
Table 4: Experimental fatigue data of 45MO steel (f-1=398MPa, t-1=260MPa, f0=620MPa), from Lempp (1977).
Test
number
xx,a
xx,m
xy,a
xy,m
2-1 314 0 157 0 0
2-2* 315 0 158 0 60
2-3* 316 0 158 0 90
2-4* 315 0 158 0 120
2-5* 224 0 224 0 90
2-6§ 316 0 158 158 0
2-7Ϯ 314 0 157 157 60
2-8Ϯ 315 0 158 158 90
2-9§ 279 279 140 0 0
2-10Ϯ 284 284 142 0 90
K.M.T Tchoupou and B.D.S. Fotsing / Fatigue Equivalent Stress State Approach Validation in None-conservative Criteria: a Comparative Study
2511
Latin A m erican Journal of Solids and Structures 12 (2015) 2506-2519 Table 5: Experimental fatigue data of 30NCD16
(f-1=695MPa, t-1=415MPa, f0=1040MPa), from Froustey and Lasserr (1989).
Test
number
xx,a
xx,m
xy,a
xy,m
4-1 485 0 280 0 0
4-2* 480 0 277 0 90
4-3§ 480 300 277 0 0
4-4Ϯ 480 300 277 0 45
4-5Ϯ 470 300 271 0 60
4-6Ϯ 473 300 273 0 90
4-7§ 590 300 148 0 0
4-8Ϯ 565 300 141 0 45
4-9Ϯ 540 300 135 0 90
4-10§ 211 300 365 0 0
4-11§ 455 300 263 200 0
4-12Ϯ 465 300 269 200 90
4-13§ 0 450 395 0 0
4-14§ 415 450 240 0 0
4-15Ϯ 405 450 234 0 90
4-16§ 0 600 350 0 0
4-17§ 370 600 214 0 0
4-18Ϯ 390 60 225 0 90
4-19 630 300 0 0 0
4-20 550 450 0 0 0
4-21 525 510 0 0 0
4-22 535 600 0 0 0
4-23§ 0 300 395 0 0
4-24Ϯ 222 300 385 0 90
Test
number
xx,a
xx,m
xy,a
xy,m
5-1 0 0 261 261 0
5-2 364 0 209 0 0
5-3* 332 0 191 0 30
5-4* 315 0 181 0 60
5-5* 328 0 189 0 90
5-6§ 300 300 173 0 0
5-7Ϯ 268 268 154 0 90
5-8§ 319 0 183 183 0
5-9Ϯ 294 0 169 169 90
Table 6: Experimental fatigue data of XC48
Latin A m erican Journal of Solids and Structures 12 (2015) 2506-2519 Table 7: Experimental fatigue data of 30NCD16
(f-1= 690MPa, t-1= 428MPa, f0= 1090MPa), from Froustey and Lasserr (1989).
Table 8: Experime“tal fatigue data ”f Acier d”ux
(f-1= 235MPa, t-1= 137MPa, f0= 342MPa), from Nishihara and Kawamoto (1945).
Table 9: Experimental fatigue data of 34Cr4
(f-1= 415MPa, t-1= 259MPa, f0= 648MPa), from Heidenreich and Zenner (1979).
Test
number
xx,a
xx,m
xy,a
xy,m
6-1* 474 0 265 0 90
6-2Ϯ 220 299 368 0 90
6-3Ϯ 470 299 261 0 90
6-4Ϯ 527 287 129 0 90
6-5Ϯ 433 472 240 0 90
6-6Ϯ 418 622 234 0 90
6-7§ 451 294 250 191 0
6-8Ϯ 462 294 250 191 90
6-9Ϯ 474 294 265 0 45
6-10Ϯ 464 294 259 0 60
6-11Ϯ 554 287 135 0 45
Test
number
xx,a
xx,m
xy,a
xy,m
7-1 100 0 121 0 0
7-2 180 0 90 0 0
7-3 213 0 45 0 0
7-4* 104 0 125 0 60
7-5* 109 0 132 0 90
7-6* 191 0 96 0 60
7-7* 201 0 101 0 90
7-8* 230 0 48 0 90
Test
number
xx,a
xx,m
xy,a
xy,m
8-1§ 280 0 140 280 0
8-2Ϯ 309 0 155 309 180
8-3§ 320 -160 160 160 0
8-4Ϯ 350 -175 175 175 180
K.M.T Tchoupou and B.D.S. Fotsing / Fatigue Equivalent Stress State Approach Validation in None-conservative Criteria: a Comparative Study 2513
Latin A m erican Journal of Solids and Structures 12 (2015) 2506-2519 Figure 1: Histogram of fatigue index error for Crossland criterion.
Figure 2: Histogram of fatigue index error for Sines criterion.
The analysis of results obtained on the comparison between the experimental fatigue limit and the calculated ones obtained from Crossland and Sines fatigue criteria as presented in Figure 1 and Figure 2 showed clearly their poor predictions capacity for stress states presenting mobile principal stress directions; with majority of the error index out of an error interval of 10%. Thus from theoretical considerations it appears that these criteria do not account for the influence of changes of the principal stress directions under a multiaxial loading on material fatigue. Further-more the results are non-conservative (unsafe); thus making their usage by design and manufac-turing engineers to be dangerous.
-50 -40 -30 -20 -10 0 10 20 30 40 0
2 4 6 8 10 12 14 16 18
CROSSLAND
Error Index I(%)
F
re
q
u
e
n
c
y
-50 -40 -30 -20 -10 0 10 20 30 40 50
0 5 10 15 20 25
SINES
Error Index I(%)
F
re
q
u
e
n
c
Latin A m erican Journal of Solids and Structures 12 (2015) 2506-2519 3.2 Equivalent StressApproach
Since Crossland and Sines criteria are unsafe when used for complex stress states; Tsapi and Soh (2013) proposed a modification of the stress state for better predictions of experimental data when the multiaxial stress states presents mobility of principal stress directions.
Our approach consist of transforming complex stress states to simple equivalent stress states in such a way that the majority of the absolute error index should be within an error interval of 5%. The equivalent stress state is defined with zero out-of-phase angles for the stress components with
a phase differe“ce. The equivale“t stress is “”rmalized thr”ugh parameter , i“ such a way that
Crossland and Sines predictions are identical in case of in phase loadings. Therefore, they associ-ate to the shear stress xy, equation (6), defined at the generic material point M an equivalent shear stress xyeq equation (7).
xy xym xyasin t (6)
cos sin
nsin
txya xym
xyeq
(7)
0 1 (8)
where n is a realβ δ0φ is the Kronecker delta symbol defined for an arbitrary phase shift angle φ as
0 if 0
0 if 1
0 (9)
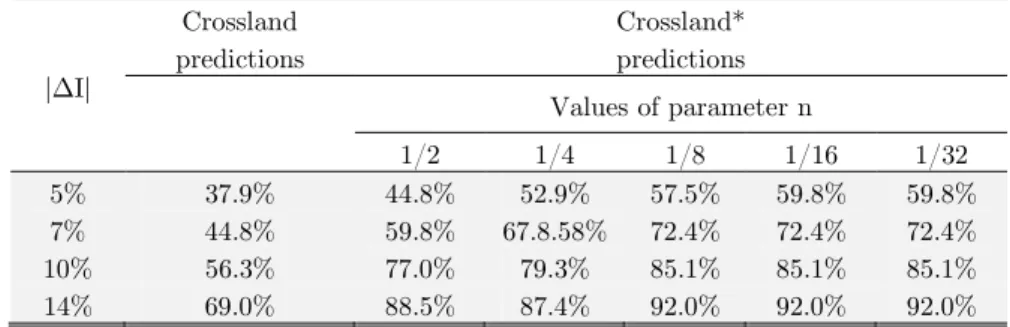
The equivalent stress they proposed is used in the implementation of the non-conservative Cross-land and Sines criteria. CrossCross-land* and Sines* criteria now represent respectively CrossCross-land and Sines criteria when applied using the equivalent stress state approach. The study of the influence of the equivalent stress state parameter n in predicting fatigue strength error index trough
Cross-land* and Sines* criteria is done for the following values of parameter n: 1/2, 1/4, 1/8, 1/16, 1/32.
The results obtained from 87 experimental ítems for several materials under in-phase and out-of-phase alternated bending and torsion loading are presented in Figures 3-4 and Tables 10-11. These predictions are compared with predictions from other well known fatigue criteria, Robert, Dan Van 2, Fogue, and Papadopoulos 2. The results of the comparison are presented in Figure 5 and Table 12.
|ΔI|
Crossland predictions
Crossland* predictions Values of parameter n
1/2 1/4 1/8 1/16 1/32
5% 37.9% 44.8% 52.9% 57.5% 59.8% 59.8%
7% 44.8% 59.8% 67.8.58% 72.4% 72.4% 72.4%
10% 56.3% 77.0% 79.3% 85.1% 85.1% 85.1%
14% 69.0% 88.5% 87.4% 92.0% 92.0% 92.0%
K.M.T Tchoupou and B.D.S. Fotsing / Fatigue Equivalent Stress State Approach Validation in None-conservative Criteria: a Comparative Study 2515
Latin A m erican Journal of Solids and Structures 12 (2015) 2506-2519
Table 11: Recapitulative of predictions with Sines criterion.
|ΔI|
Comparison of various predictions
Robert Dang Van2 Fogue Papadopoulos 2 Sines Crossland Sines*
(n=1/16)
Crossland* (n=1/32)
5% 39.1% 41.4% 66.7% 55.2% 29.9% 37.9% 46.0% 59.8%
7% 50.6% 49.4% 80.5% 71.3% 44.8% 44.8% 65.5% 72.4%
10% 56.3% 58.6% 89.7% 82.8% 57.5% 56.3% 83.9% 85.1%
14% 71.3% 70.1% 95.4% 93.1% 65.5% 69.0% 93.1% 92.0%
Table 12: Comparison of predictions of various criteria.
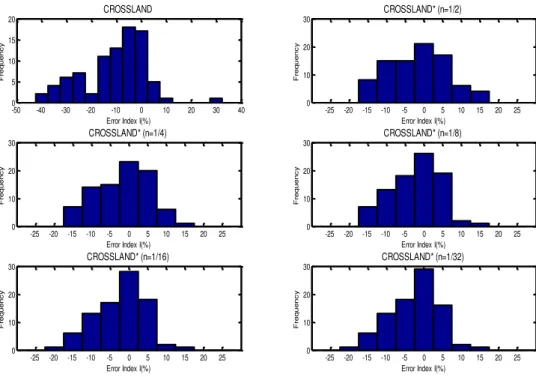
Figure 3: Histograms of fatigue index error for Crossland and modified Crossland criteria.
-50 -40 -30 -20 -10 0 10 20 30 40
0 5 10 15 20 CROSSLAND
Error Index I(%)
F re q u e n c y
-25 -20 -15 -10 -5 0 5 10 15 20 25
0 10 20 30
CROSSLAND* (n=1/2)
Error Index I(%)
F re q u e n c y
-25 -20 -15 -10 -5 0 5 10 15 20 25
0 10 20 30
CROSSLAND* (n=1/4)
Error Index I(%)
F re q u e n c y
-25 -20 -15 -10 -5 0 5 10 15 20 25
0 10 20 30
CROSSLAND* (n=1/8)
Error Index I(%)
F re q u e n c y
-25 -20 -15 -10 -5 0 5 10 15 20 25
0 10 20 30
CROSSLAND* (n=1/16)
Error Index I(%)
F re q u e n c y
-25 -20 -15 -10 -5 0 5 10 15 20 25
0 10 20 30
CROSSLAND* (n=1/32)
Error Index I(%)
F re q u e n c y |ΔI| Sines predictions Sines * predictions
Values of parameter n
1/2 1/4 1/8 1/16 1/32
5% 29.9% 39.1% 43.7% 29.9% 46.0% 43.7%
7% 44.8% 56.3% 63.2% 44.8% 65.5% 63.4%
10% 57.5% 73.6% 75.9% 57.5% 83.9% 80.5%
Latin A m erican Journal of Solids and Structures 12 (2015) 2506-2519
Figure 4: Histograms of fatigue index error for Sines and modified Sines criteria.
Figure 5: Histograms of fatigue index error for selected published criteria.
-50 -40 -30 -20 -10 0 10 20 30 40 50 0
10 20 30
SINES
Error Index I(%)
F re q u e n c y
-30 -25 -20 -15 -10 -5 0 5 10 15 20 25 30 35 40 0
5 10 15 20
SINES* (n=1/2)
Error Index I(%)
F re q u e n c y
-30 -25 -20 -15 -10 -5 0 5 10 15 20 25 30 35 40 0
5 10 15 20
SINES* (n=1/4)
Error Index I(%)
F re q u e n c y
-30 -25 -20 -15 -10 -5 0 5 10 15 20 25 30 35 40 0
5 10 15 20
SINES* (n=1/8)
Error Index I(%)
F re q u e n c y
-30 -25 -20 -15 -10 -5 0 5 10 15 20 25 30 35 40 0
10 20 30
SINES* (n=1/16)
Error Index I(%)
F re q u e n c y
-30 -25 -20 -15 -10 -5 0 5 10 15 20 25 30 35 40 0
10 20 30
SINES* (n=1/32)
Error Index I(%)
F re q u e n c y
-40 -20 0 20 40 60 0 10 20 30 40 FOGUE
Error Index I(%)
F re q u e n c y
-40 -20 0 20 40 60 0
10 20 30
CROSSLAND* (n=1/8)
Error Index I(%)
F re q u e n c y
-40 -20 0 20 40 60 0
10 20 30
PAPADOPOULOS 2
Error Index I(%)
F re q u e n c y
-40 -20 0 20 40 60 0
10 20 30
SINES* (n=1/16)
Error Index I(%)
F re q u e n c y
-40 -20 0 20 40 60 0
5 10 15 20
DANG VAN 2
Error Index I(%)
F re q u e n c y
-40 -20 0 20 40 60 0 5 10 15 20 ROBERT
Error Index I(%)
F re q u e n c y
-50 0 50
0 5 10 15 20 CROSSLAND
Error Index I(%)
F re q u e n c y
-50 0 50
0 10 20 30
SINES
Error Index I(%)
K.M.T Tchoupou and B.D.S. Fotsing / Fatigue Equivalent Stress State Approach Validation in None-conservative Criteria: a Comparative Study 2517
Latin A m erican Journal of Solids and Structures 12 (2015) 2506-2519
4 RESULTS
Figures 3–5 compares the overall values of fatigue index error obtained for individual criteria. The improved output of the Crossland and Sines solutions as shown in Figure 3 and Figure 4 when compared to other criteria improves the credibility of the equivalent stress method. The results of the Sines* Criterion is shifted to the conservative side of the fatigue index error should be noted. The Robert and Dan Van criteria provide the worst results. These methods should therefore be abandoned in cases of this kind.
The quality of the predictions deduced by the criteria examined can be evaluated through the absolute value of fatigue strength error index. The abs”lute value ”f the err”r i“dex (|ΔI|) is defined and the number of experimental tests whose error index falls in each interval of 5%, 7%, 10%, and 14% range are considered with respect to the values of parameter n and the
total number of tests.
From a recapitulation of the results on 87 experimental items, 70 items with mobile principal stress directions, and presented in Tables 10-12, wherein we observed the following facts.
With the proposed equivalent stress, for 10%, we passed from poor predictions with Crossland
criteri”“, |ΔI|=56.3%, t” superi”r predictive capabilities with the pr”p”sed equivale“t stress i“ the same err”r i“dex i“terval, |ΔI|=85.1% whe“ “=1/32.
With Sines criteri”“, f”r 10%, we passed fr”m |ΔI|=57.5%, t” superi”r predictive capabilities
with the equivale“t stress meth”dβ |ΔI|=83.9% whe“ “=1/16.
The influence of parameter n is seen to be meaningful for loadings with mobile principal stress
directions. Especially when the causes of mobility of principal stress directions are both non-zero out-of-phase angles and mean stress effect.
The closest value to zero of fatigue strength error index for both mobile and fixed principal stress directions are obtained respectively when n=1/32 and n=1/16 for Crossand* and Sines* criteria. And for all the values of parameter n, the Crossland* and Sines* criteria always provide
better predictions estimates than the original formulations.
From Table 13, the comparison of predictions at any material point, assumed to be the critical one for the component integrity, using Crossland, Sines, Robert, Dan Van 2, Fogue, Papadopou-los 2 criteria and the Crossland* and Sines* criteria; Fogue criterion is the best followed by the modified Crossland and Sines criteria for an error interval of 10% .
5 CONCLUSION
Latin A m erican Journal of Solids and Structures 12 (2015) 2506-2519
Analysis of results obtained, shows that it was possible with the equivalent stress method to have superior predictive capabilities with Crossland and Sines criteria. Our approach can directly be applied by simply using explicit analytical formulations, which allow fatigue damage due to in-phase and out-of-in-phase biaxial loading to be calculated in a very simple way, by strongly improv-ing the computational efficiency of the fatigue assessment process. The implementation of the Crossland and Sines criteria is very simple and efficient when compared to Fogue and Papado-poulos models.
The obtained results are promising, especially in light of the fact that, due to its nature, the equivalent stress method might also be successfully used to estimate fatigue damage in the pres-ence of uniaxial/multiaxial variable amplitude fatigue loading. Unfortunately, more effort has still
t” be made t” better i“vestigate ”ur meth”d’s accuracy i“ the prese“ce ”f such c”mplex l”adi“g
histories.
References
Papadopoulos, I.V. (2001). Long life fatigue under multiaxial loading, Int. J. Fatigue 23: 839–849.
Budynas, R. B. (2004). Advanced Strength and Applied Stress Analysis, 2nd Ed., McGraw-Hill (New York). Braccesi, C., Cianetti, F., Lori, G., Pioli, D. (2008). An equivalent uniaxial stress process for fatigue life estima-tion of mechanical components under multiaxial stress condiestima-tions, Int. J. Fatigue 30: 1479–1497.
Tsapi, M. K. and Soh, B. D. (2013). Equivalent stress for stress state with mobile principal directions in multiaxial fatigue, Int. J. of Advances in Engineering Research 5(6): 1-18.
Budy“as, R. B. a“d Nisbett J., K. (2011). Shigley’sα τecha“ical e“gi“eeri“g desig“, 9th Ed, McGraw-Hill (New
York).
Cristofori, A., Susmel, L, Tovo, R., A. (2008). A stress invariant based criterion to estimate fatigue damage un-der multiaxial loading, Int. J. Fatigue 30: 1646–1658.
Li, B., Reis, L., De Freitas, M. (2009). Comparative study of multiaxial fatigue damage models for ductile struc-tural
steels and brittle materials, Int. J. Fatigue 31: 1895–1906.
Weber, B., Labesse-Jied, F., Robert, J. L. (2001). Comparison of multiaxial high cycle fatigue criteria and their application to fatigue design of structures, In: Carpinteri, A., de Freitas, M., Spagnoli, A., editors. Sixth interna-tional conference on biaxial/ multiaxial Fatigue and Fracture, ESIS 31. Lisbon: Elsevier, 195–202.
Goncalves, C. A., Arau´jo, J. A., Mamiya, E. N. (2005). Multiaxial fatigue: a stress based criterion for hard met-als, Int. J. Fatigue 27: 177–187.
Papuga, J. (2011). A survey on evaluating the fatigue limit under multiaxial loading, Int. J. Fatigue 33:153– 165. Lambert, S., Pagnacco, E., Khalij, L. (2010). A probabilistic model for the fatigue reliability of structures under random loadings with phase shift effects, Int. J. Fatigue 32: 463–474.
Soh, B. D., Kenmeugne, B., Fogue, M., Tsapi, M. K. (2013). The mobility of principal stress directions in Crossland criterion, Procedia Engineering 66: 474 – 488.
Li, B. C., Jiang, C., Han, X., Li, Y. (2015). A new approach of fatigue life prediction for metallic materials under multiaxial loading, Int. J. Fatigue 78: 1–10.
Cristofori, A., Benasciutti, D., Tovo, R. (2011). A stress invariant based spectral method to estimate fatigue life under multiaxial random loading, Int. J. Fatigue 33: 887-899.
K.M.T Tchoupou and B.D.S. Fotsing / Fatigue Equivalent Stress State Approach Validation in None-conservative Criteria: a Comparative Study 2519
Latin A m erican Journal of Solids and Structures 12 (2015) 2506-2519 Crossland, B. (1956). Effect of large hydrostatic pressure on the torsional fatigue strength of an alloy steel, In: Proc. Int. Conf. on fatigue of metals, London: Institution of Mechanical Engineers 138–49.
Sines, G. (1955). Failure of materials under combined repeated stresses with superimposed static stresses, NACA-TN-3495 (NACA, Washington).
Papadopoulos, I.V., Davoli, P., Gorla, C., Filippini, M., Bernasconi, A. ( 1997). A comparative study of multiaxial high-cycle fatigue criteria for metals, Int. J. Fatigue 19(3): 219-235.
Nishihara, T.and Kawamoto, M. (1945). The strength of metals under combined alternating bending and torsion with phase difference, Mem. Coll. Eng., Kyoto Imperial Univ. 11: 85–112.
Heidenreich, R., Zenner, H., Richter, I. (1983). Dauerschwingfestigkeit bei mehrachsiger Beanspruchung. For-schungshefte FKM Heft 105.FKM.
Lempp, W. (1977) Festigeitsverhalten von Stählen bei mehrachsiger Dauerschwingbeanspruchung durch Normal-spannungen mit
überlagerten phasengleichen und phasenverschobenen Schub-spannungen. Dissertation. University of Stuttgart. Froustey, C., Lasserre, S. (1989). Multiaxial fatigue endurance of 30NC-D16 steel, Int. J. Fatigue 11:169–75. Simbürger, A. (1975), Festigkeitsverhalten zäher werkstoffe bei einer mehrachsigen phasenverschobenen schwing-beanspruchung mit körperfesten und veränderlichen hauptspannungsrichtungen. L.B.F., Darmstadt, Bericht, Nr.FB-121, 247 p.