Autor para correspondência: Lincoln C. Brandão, Departamento de Engenharia Mecânica, Universidade Federal de São João del-Rei, Praça Frei Orlando,170, Centro, CEP: 36307-352, São João del-Rei, MG, Brasil. E-mail: [email protected]
Rafael H. T. Ueda, Lincoln C. Brandão, Carlos H. Lauro
Departamento de Engenharia Mecânica, UFSJ
Abstract: Seals have wide application in automotive products. They are responsible for sealing the car in several parts such as the doors, the air intake cowl seal, and air intake lights seal. Strain and stress studies are very important in order to understand the behavior of polymeric materials, which are generally submitted to great workload variation and environmental influence. This study of EPDM rubber was carried out to define the strain, stress and yield stress. Tensile and compression tests were carried out on workpieces with 100 mm of length. The data were acquired using the Qmat software. A Finite Element Analysis using the MSC Marc Mentat™ was conducted and compared with experimental tests. The results showed an increase of effort proportional to bulb thickness. The proportional increase of compression effort for different displacements was significant. Moreover, physical parameters such as length, thickness, and friction coefficient changed the strain and stress rate.
Keywords: Door seals, EPDM rubber, finite element analysis, stress, polymer science.
Introduction
Rubber products have wide application in the automotive industries. The application of rubber products in the automotive industry can be divided into tires, which are consumer products and have a short life span, and seals, which last longer. Generally, seals are manufactured to last as long as the automobiles. Thus, product recycling is more appropriate for tires due to their shorter time of use. According to Fukumori et al.[5], recycling of waste materials is of growing importance for all the industries in the world. When rubber products are concerned, the automotive and transportation industries are the biggest consumers of new rubber.
The main applications of rubber seals in automobiles are; door seals, secondary door seals, air intake cowl seal, air intake lights seal, liftgate seals, ditch molding and outer waist belts[6]. These are in turn divided into dynamic and static seals. The main purpose of the door seals is to provide a perfect seal between the door and the car’s bodywork in extreme climatic conditions, to reduce external noise, to contribute to the quality of opening and closing of the door, and to protect the driver and passengers against the aggressive environment[3].
Among various polymeric materials, EPDM has been of great interest to engineers particularly in the automotive sector. EPDM rubber is the main raw material in seals and belongs to the group of the thermo polymers to which a third monomer – Diene – is added in order to introduce unsaturation to the chain. According to Bouchart et al.[2] the use of EPDM-PP blends has been continuously growing in various industrial domains since several decades. Because it is possible to mix Ethylene Propylene Diene Monomer (EPDM) and polypropylene (PP) in any ratio, there is theoretically a wide spectrum of materials ranging from elasticized PP to EPDM rubber reinforced with thermoplastics.
Many studies have been conducted on the mechanical behavior of PP/rubber blends[13] where a study had demonstrade that the dominant deformation mechanism in PP/EPR blend is dilatational shear banding caused by repeated cavitations, thus a condition of crazing was expected in the matrix but this condition has not occurred. Four main approaches have been proposed in these studies. The first approach concerns the influence of interfacial adhesion and its role on compatibility between the matrix and the elastomeric phase[9]. Thus, the numerical simulation of the rubber thermal flow is an interesting methodology to be implemented, but requires the elaborate determination of the simulation parameters associated with the actual forming process[4]. The second group
concentrates on the effects of elastomeric content, particle size, and particle distribution on mechanical behavior[7,8]. In fact, deformation behavior during tensile loading is still a matter of controversy among researchers. For example, Wagner et al.[10] reported that the mechanism of deformation in the PP/EPDM blend results in crazing.
Bouchart et al.[2] relate that several blends of EPDM rubber provoke a kind of modification at microlevel of adherence between particles and matrix phases. Thus, the use of a nonlinear micromechanical model allows us to confirm this interpretation. Also Karger-Kocsis and Friederich[8] showed that there is a relationship between crazing and the crystalline morphology of the blend. The project of a dynamic seal can present a system with a simple bulb or a system of two bulbs. Finite element analysis is in fact very important to define the specific design characteristics of seals.
According to Wagner et al.[10], analyses carried out with the finite element methodology can be performed before any prototype hardware is developed if sufficient information on geometry and material property is available. The perfect profile and behavior of seals can therefore be predicted and optimized, saving great amounts of time at the production line. Xiao et al.[12] showed that as the level of curing agent is increased for EPDM/PP blends (60/40), when the microstructure and rheological behavior are concerned, the EPDM phase changed from a dispersed phase to a continuous one, and again to dispersed phase, while the PP phase remained constant throughout.
The design of products for the automotive industry generally uses the system with two bulbs when there are great gaps between the doors and the car chassis. Another component in the dynamic seals and the static seals is the lip. It has the function of giving a better appearance to the seal, as well as fixing it to the flange of the vehicle, and generally, these lips are of dense thermoplastic or EPDM rubber. Thermoplastic materials already are used in the design of dynamic seals. It is used more in the seals of windshields and windows. Some studies have shown that the use of thermoplastic materials in the design of the seals reduces by 30% the weight of the product[13].
This paper presents the validation of seals using MSC Marc Mentat™ software based on the theoretical models for hyperelastic materials that describe the behavior of the material through strain energy. These models are used generally to describe the nonlinear
Ueda, R. H. T. et al. - Analysis of automotive liftgate seals using finite element analysis
Foam model
The model of the potential energy using the Foam model can be written according to Equation 8:
U n J
n n
N
n n n n
n n n N = ∑ + + − + ∑ − = = µ
α λα λ α
1 1 2 3 1
3 1
[ λ ] µ ( )
β
α β (8)
where λi is the main extension and µi, αi and βi are the constants related to the properties of the material.
Mechanical and seal simulation tests
The validation experiments of the dynamic and static seals are based on the correlation method between the mechanical tests and the Finite Element Analysis using the MSC Marc Mentat™software. The compression tests were carried out using a dynamometer with a compression speed of 10 mm/min with specimens a 100 mm in length, and the acquisition data was obtained using Qmat software™, as shown in Figure 1. The aim of this test is to define the force acting on seals in function of the distance between the top and bottom tray of the dynamometer. The compression test is conducted on a linear table that avoids the radial forces caused by the friction between the tray and the seals, thus obtaining the results of the efforts through just one vector component.
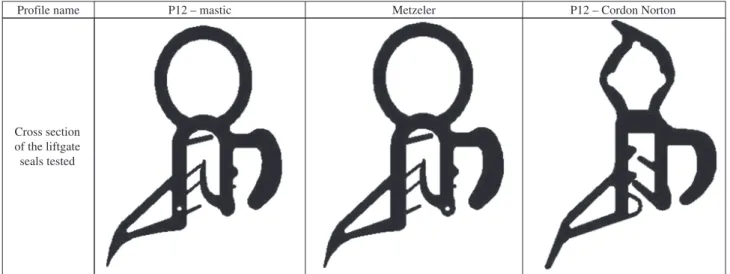
The compression tests have the objective of simulating the closing of a door. When an elastomer is tested in a cyclical situation, a reduction of the load is necessary to get the same elongation, and this phenomenon is called the Mullins effect. After certain time without compression the material returns to its initial form. Figure 2 shows the three liftgate seals tested and Figure 3 shows a micro structure of sponge EPDM rubber that is used in dynamic seals. EPDM rubber has the great characteristic of flexibility because the Young modulus “E” and the distortion “G” are three times less than the compression modulus “K”, which is the inverse of compressibility. This can be considered for an isotropic material according to Equation 9:
K= E G
−
(
)
=(
(
−+)
)
3 1 2
2 1 3 1 2 ν
ν
ν (9)
where “ν” is the Poisson coefficient, and when K/E or K/G go to infinite the (1−2ν) value goes to zero, thus the Poisson coefficient goes to 0,5 showing the Poisson coefficient value for incompressible materials. The K/E relation values for rubber are of the order of 103 (K ~ 109 Pa, E ~ 106 Pa) demonstrating that “ν” is approximately ½. In this way, the rubber can be considered incompressible in all directions, except for situations where triaxial compression is applied. Another important characteristic that the rubber presents is its deformability, or is capacity of taking high deformation without breaking. Because of this the final dimension of specimen can reach repeatedly the initial dimensions with a high degree of recovery, which is called resilience.
behavior of elastomeric materials and are valid when large strain theory is used. In problems involving great deformations, geometric non-linearity must also be taken into account.
Methodology
The validation of the seals through the MSC Marc Mentat™ software uses models for hyperelastic materials describing the material’s behavior through strain energy. This method is used to evaluate the nonlinear behavior of the elastomeric materials being validated using large strain theory. Isotropic materials were initially considered in the experiments. However, when the material is submitted to tensile force moving in the orientation of the molecules, anisotropy must be considered. With this in mind, the generation of this anisotropy is assumed in the direction of the strain effort. For this reason, the material can be considered isotropic and the potential strain energy is formulated as a function of the strain invariants, as Equations 1, 2 and 3.
I
1 1 22 2
3 2
= + +
λ λ λ
(1)I
2=λ λ λ λ λ λ
12.
22+
22. 32+
23. 12 (2)I
3=λ λ λ
12. 22. 32 (3)where λ1, λ2 e λ3 are the mean extensions defined by Equation 4:
λ1=
+
(
L u)
L i i
i
(4)
The Mooney-Rivlin model is applied for the calculations on EPDM rubber considering it as incompressible according to Equation 5. Another mathematical model uses the Foam model, simulating the behavior of EPDM rubber of the sponge type, considering the compressibility of the material.
λ λ λ
12. 22. 32=1 (5)Mooney-Rivlin model
The potential energy is calculated according to the Mooney-Rivlin model presented in Equation 6:
U C I C I
D J
el
= 1
( )
1− + 2( )
2− +( )
−1 2
3 3 1 1 (6)
where C1, C2 and D1 are parameters of the material, I1 and I2 are the strain invariants. For the situations where the nominal strain is small or significantly large (<100%), this model will suffice. The D1 constant is related to the degree of incompressibility of the material, therefore when it is zero the material is considered incompressible. Preliminary tests have shown that in less than 30% of specimens, the maximum deformation for the stress-strain curve is near-linear.. In order to simplify the characterization of the material, it was then decided to parameterize only the C1 material constant. Thus, the potential strain energy is given by Equation 7.
U C I
D J el
= 1
( )
1− +( )
−1 2
3 1 1 (7)
This model is also known as Neo-Hookeano model. The Mooney-Rivlin model is the more commonly used to characterize hyperelastic materials, because the modification of the C1 parameter
Figure 4. Example of the bulb thickness variation.
Figure 3. Micro structure of sponge EPDM rubber.
Figure 2. Detail of the three liftgate sections tested.
Table 1. Strain effort for different sections.
Inner variation Effort (N.dm–1) % Maximum Strain Standard section (*.dxf) 3.475 22
Section + 0.123 mm 4.545 23
Section + 0.190 mm 5.196 25
Section + 0.247 mm 5.745 25
The geometry of variables such as bulb thickness and diameter are the parameters that influence the increase of the compression forces as well as the choice of the sponge type EPDM rubber. Table 1 shows the influence of the bulb thickness on the increase of the compression forces, according to Bedard[1]. Due to the difficulty of obtaining a constant section of the bulb in the extrusion process of the sponge type EPDM rubber seals, it is common to not get accurate results matching the predictions of the calculation. Thus, the results of the calculations and the tests must be conducted with the objective of evaluating the influence of geometry and how much this varies in the process. The inner line of Figure 4 shows a variation of 0.2 mm in the thickness of the bulb.
The test were carried out at 23 °C and 50% HR on three specimens of each profile to assure the accuracy of the results.
Analysis of Results
Experimental tests
Figure 5 shows the result of the compression tests carried out at 23 °C and 50% HR with specimens of each of the three liftgate seals that are shown in Figure 2. Metzeler was the chosen profile due to the displacement range between 10 and 22 mm and the smaller deformation force. This way, the Metzler profile was chosen for the experimental tests and the simulations of the new bulb. Figure 6 shows the compression tests carried out with the Metzeler profile with a displacement variation of ±10%.
Ueda, R. H. T. et al. - Analysis of automotive liftgate seals using finite element analysis
Figure 5. Displacement curves for three liftgate seals tested.
Figure 6. Comparison between displacement curves for the Metzeler bulb with ±10% and Finite Element Analysis.
–4 –2 0 0 2 4 6 12 14
2 4 6 8 10 12 14
Displacement (mm) 10
8
F
orce (N/100 mm)
Metzeler test Finite element analysis
10% –10%
Figure 7. Insertion Test in the flange of 1.6 mm for three liftgate seals.
The geometric variables such as lip thickness and length and angle of inclination were the influence parameters during this test. Errors generated during the extrusion process such as, for example, the increase in the lip thickness, tend to cause excessive lip rigidity. The insertion and extraction tests were carried out with the same three liftgate seals of Figure 2 and each experiment was replicated 3 times with flanges with a thickness of 1.2 and 1.6 mm. Figure 7 shows a insertion test for a flange of 1.6 mm.
The profile chosen for the design of a new clamp was the P12 mastic, so that the insertion and extraction forces corresponded to the standard values of the automotive industries. This way, the arithmetic mean of the values of the insertion and extraction efforts were obtained, and the curves were plotted with a tolerance of ±10%, where the values of maximum insertion and minimum extraction had to be within this range.
Simulation with MSC Marc Mentat™
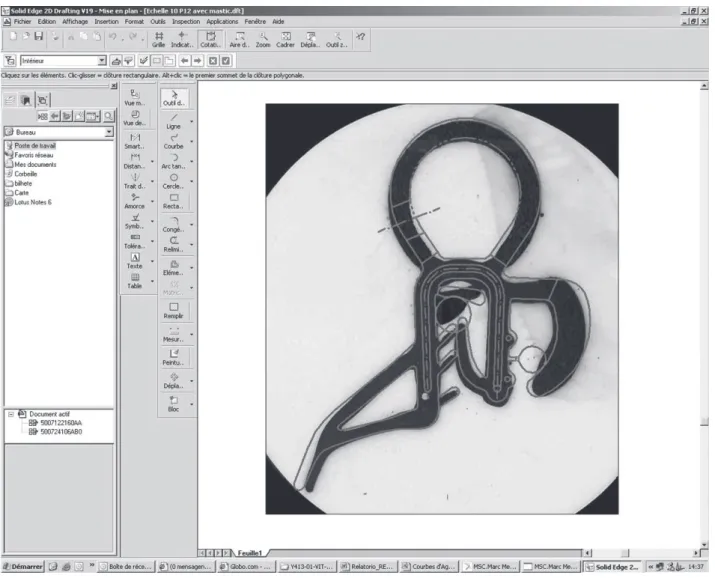
The simulations of the insertion and extraction tests using the finite elements method was two dimensional, allowing the analysis of the behavior of the seals before and after the extrusion. The objective of this test was to define the thrust force of compression, insertion, extraction and strain. In order to simulate the characteristics of the real profile seals, it was necessary to digitalize the extrusion profile of the seals and construct the contour using the software Solid Edge™. Figure 8 shows a detail of the digitalization of a P12 mastic seal.
Afterwards, it was possible to export the profile to the simulation software creating files in the format “dxf” or “dwg”. The creation of the mesh had as objective to distinguish the different materials of the seals and to refine the resulting elements in more accurate data. The generated elements were square, but the formation of triangle elements was also necessary. During the creation of the theoretical model, the curves of the profile were subdivided in 0.2 mm spacing. Table 2 shows the data of the two models with the number of nodes and square and triangle elements.
The bulbs were initially inserted in a resin for the measurement of the profile details. Therefore, the digitalization of the profile using software Solid Edge™ was performed. Because the seal profile was redesigned, the export of each profile point to the finite element analysis software was possible, and the simulation could be started. Figure 9 shows the construction of the mesh after the digitalization and with the profiles defined by the MSC Marc Mentat™ software.
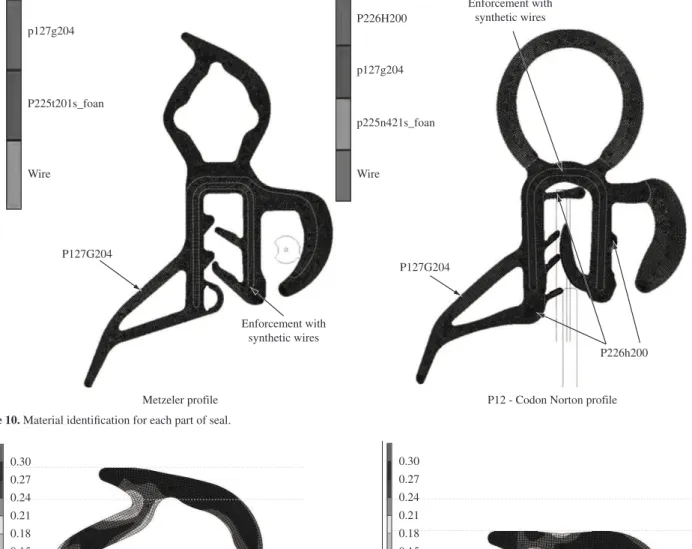
Dense rubber EPDM was simulated by the “Mooney-Rivlin”-model with a coefficient established according to Bouchart et al.[2], as can be seen in Table 3. Sponge type Rubber EPDM uses the formularization as in “Foam” with the objective of representing the compressibility of the bulb and the parts where they are applied. Each part was defined in function of specific characteristics based on load and seal application. Figure 10 shows the specific material applied for each seal part.
Table 2. Data of the simulation model.
Number of elements Metzeler profile P12 Mastic Profile
Triangles 0 0
Squares 9,281 9,905
Number of nodes 10,064 10,677
Table 3. Constants of the model.
Material C1 µ α β
P127G204 0.95 - -
-P225T201S_foam - 0.185 10 –0.5
P225M421_foam - 0.090 10 –0.5
-Figure 8. Digitalization of P12 mastic seal using Solid Edge™ software.
Figure 9. Profiles defined in the MSC Marc Mentat™ software.
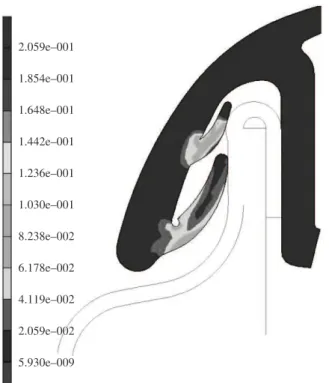
In the experimental tests, a dimensional variation of ±2.5 mm was applied above and below the standard position. The calculation of the compression forces was given in these three positions, as shown in Figures 11, 12 and 13. The results of the maximum stresses for experimental data and Finite Element Analysis are represented in the Table 4. The graphs show a good relation between the experimental and simulated results where it can be observed that the increase of the compression force occurs in a tolerance range of
Table 4. Values of the compress efforts.
Test Force (N/100 mm)
Standard + 2.5 mm
Standard Standard – 2.5 mm
Test with -10% 6.9 8.1 10.1
Standard test 7.6 9.0 11.3
Test with +10% 8.4 9.9 12.4
Finite Element Analysis 7.5 9.7 12.4
±10%. The results show, therefore, that finite element analysis values were within the standards defined for the automobile industry.
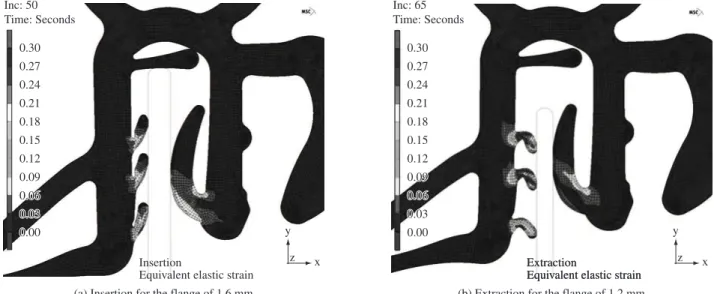
The maximum value of insertion does not exceed 80 N.dm–1 for the flange of 1.6 mm, and the extraction is not less than 100 N.dm–1 for the flange of 1.2 mm, according to Copper Standard Automotive[3]. Figures 14a and b illustrate the simulation of insertion of the flange of 1.6 mm and extraction of the flange of 1.2 mm, respectively.
Ueda, R. H. T. et al. - Analysis of automotive liftgate seals using finite element analysis
Figure 13. Compression of -2.5mm for the Metzeler profile.
Figure 10. Material identification for each part of seal.
Figure 11. Compression of + 2.5mm for the Metzeler profile.
Figure 12. Standard Compression for the Metzeler profile.
Figure 15 shows the experimental standards with the tolerance variation of ±10% for the P12 mastic seals insertion test. Therefore, it can be observed that the results of the FEA were similar to the experimental tests. The maximum insertion values were less than the experimental values, but comparing them with the data of the Table 5 shows that the simulation values were inside of the same range of the experimental values with maximum variation error of 6%.
Table 5. Results of the insertion and extraction forces.
Test Force (N/100 mm)
Insertion Extraction
Test with -10% 35.6 98.5
Standard test 39.6 109.4
Test with +10% 43.6 120.4
Finite Element Analysis 35.7 113.8
Figure 16. Details of the optimization the Mezteler profile using Finite Element Analysis - Standard geometry of the profile.
Figure 17. Details of the optimization the Mezteler profile using Finite Element Analysis - Simulation of the standard profile.
After all the simulation stages using the finite element method with the creation of the mesh, the definition of the materials was verified with the strain of the profile and the maximum force of insertion. Thus, due to the contact between the two lips, one high insertion force was observed in the standard model, according to Figure 17. The solution was the optimization of the section with the reduction of the length of the first lip, thus minimizing the contact with the upper lip as is shown in Figure 18.
This way a graph can be plotted with the insertion forces versus the displacement distance on the assembly flange of the seals. Figure 19 shows the result of the displacement force for the displacement on the flange, which demonstrates that the initial efforts with the standard geometry model were 4 times greater that the values obtained for the optimized model. Table 6 shows
Figure 15. Details of the experimental insertion forces and FEA for the flange of 1.6 mm.
Ueda, R. H. T. et al. - Analysis of automotive liftgate seals using finite element analysis
Figure 18. Details of the optimization the Mezteler profile using Finite Element Analysis - Simulation of the optimized profile.
Table 6. Maximum values of insertion.
Initial Section Optimized section
Maximum value of
insertion (N.dm–1) 163.5 47.8
Figure 19. Graph of the insertion Force x Distance of displacement on the flange.
the maximum results of insertion for the initial profile and the optimized profile. Hence it can be concluded that finite element analysis effectively defined the optimum profile of the seals, without which this component would loose its efficiency as defined in the project.
Conclusions
In accordance with the results, the following conclusions can be reached:
• Aproportionalincreaseofthecompressionforcesasafunction
of tray displacement for the different set ups can be observed. The physical parameters such as thickness and diameter of the bulb, and the choice of the friction coefficient between the tray and the specimen, changed the results significantly;
• The studies showed an increase of 65% in the compression
forces proportional to an increase of 0.247 mm for the thickness of the bulb;
• TheFiniteElementAnalysisofthecompressionforcesshowed
a good correlation with the experimental tests during tray displacement;
• Employed physical parameters such as length, thickness and
lip inclination as well as the friction coefficient modified strain variation in maximum stress;
• Thelargestinsertionforceoccurswhenthelangehascontact
with the two first lips of the seals. Afterwards, a reduction of the stress with a gradual increase is observed during the contact with the others two lips;
• Thelargestextractionforceoccursduringtheinversionofthe
positioning of the lower lips of the seals. This is normal behavior when it is necessary to get higher extraction values;
• The graphs of the insertion and extraction efforts are almost
always different from the obtained real forces. However, as can be observed, the maximum and minimum values of insertion and extraction are within the standard tolerances.
Acknowledgements
The authors would like to thank Copper Standard Automotive for permitting the development of the project in company at Vitré, France.
References
1. Bedard, L. – “Caractérisation dynamique des joints automobiles”, Master Degree Thesis, Université du Québec à Trois-Rivières, Canada (2008).
2. Bouchart, V.; Bhatnagar, N.; Brieu, M.; Ghosh, A. K. & Kondo, D. - Comptes Rendus. Mecanique., 336,p.714 (2008).
3. Cooper Standard Automotive – “Body and Chassis – products and innovations”, (2009). Disponível em: <http://www.cooperstandard. com/body_chassis.php>. Acesso em: 4 abr. 2009.
4. Felhõs, D.; Xu, D.; Schlarb, A. K.; Váradi, K. & Goda, T. - eXPRESS Polym. Lett., 2, p.157 (2008).
5. Fukumori, K.; Matsushita, M.; Okamoto, H.; Sato, N.; Suzuki, Y. & Takeuchi, K. - JSAE Rev., 23, p.259 (2002).
6. Ha, Y. S.; Cho, J. R.; Kim, T. H. & Kim, J. H. - J. Mater. Process. Technol., 201, p.168 (2008).
7. Jange, B. Z.; Ulman, D. R. & Vander Sande, J. B. - J. Appl. Polym. Sci.,
30, p.24 (1985).
8. Karger-Kocsis, J. & Friedrich, K. - J. Mater. Sci, 22, p.947 (1987). 9. Shu-Lin, B.; G’Sellb C.; Hiverc J. M. & Mathieuc, C. - Polymer, 45,
p.3063 (2004).
10. Wagner, D. A.; Morman Jr., K. N.; Gur, Y. & Koka, M. R., - Finite Elements in Analysis and Design, 28, p.33 (1997).
11. Xiao, H-W.; Shi-Qiang, H. & Jiang, T. - J. Appl. Polym. Sci, 92, p.357 (2004).
12. Zebarjad, S. M.; Bagheri, R.; Lazzeri, A. & Serajzadeh, S. - Mater. Des., 25, p.247 (2004).
Enviado: 23/03/10 Aceito: 10/05/10