Electricity Consumption as a Predictor of Household Income:
an Spatial Statistics approach
Eduardo de Rezende Francisco1, Francisco Aranha1, Felipe Zambaldi1, Rafael Goldszmidt1
1Fundação Getulio Vargas – Escola de Administração de Empresas de São Paulo (FGV-EAESP) – Av. Nove de Julho, 2029 – 11º. Andar –
CEP 01313-902 – São Paulo – SP – Brasil
{erfrancisco,zambaldi,rafaelgoldszmidt}@gvmail.br, [email protected]
Abstract. This paper investigates the relationship between electricity consumption, economic classification and household income, by means of comparing Brazilian Census Micro-Data with the customer database of AES Eletropaulo, a large Brazilian electric distribution company, using traditional statistics and spatial auto-regressive models. Income and economic classification are recognized as efficient proxies for purchasing power. Income indicators based on Electricity Consumption can be almost automatically generated by electric companies using GIS techniques, and this is a potential new business model for electric companies.
1. Introduction and Relevance
Income is usually the adopted subject descriptor in studies of poverty and living conditions since it provides access to basic goods and services (BUSSAB & FERREIRA, 1999), and can be understood as the summation of earnings provided by work and other sources (IBGE, 2003). The concept may be applied to individuals, families and households; however, it is difficult to collect accurate data on such a variable, as its declaration is frequently altered during interviews and is subject to seasonal changes, thus becoming a risky indicator in market researches (BUSSAB & FERREIRA, 1999).
Therefore, research professionals prefer to capture indicators of economic classification and purchasing power based on possessions and educational levels as proxies for income and welfare. The most recent example of such an indicator is the Brazilian Economic Classification Criterion (CCEB), or simply the Brazilian Criterion, created in 1996 by the National Research Enterprises Association (ANEP). This indicator, which is based on possessions, results in a scale which varies from 0 to 34, and segments seven economic classes (ABEP, 2004). The Brazilian Criterion, however, faces important regional differences (ABEP, 2004), and is not suitable for characterizing families which lie on the extremes of the income distribution (MATTAR, 1996; SILVA, 2004).
There is also criticism regarding the use of the Brazilian Economic Classification Criterion, mainly because of its operational difficulties. The information provided by the decennial census carried out in Brazil frequently needs to be updated; on the other hand, the Criterion can classify great contingents, but it demands adjustments in specific
regions and segments, in order to efficiently characterize populations of interest, demanding the inclusion of variables that can better indicate purchasing power.
Among those variables is the consumption of electric energy, including 97% of the Brazilian households; 99.6% in urban areas (IBGE, 2003) and 99.4% in the Southeast region (IBGE, 2003). Electricity covers more households than telecommunications, water and gas services (IBGE, 2003). Databases of electricity distribution enterprises contain consumption information about all of their customers (FRANCISCO, 2002); aggregated to geographical, historical and seasonal data, electricity consumption indicators may contribute to the classification of consumers from regions where it is hard to collect consumption data. Better consumer classification may provide knowledge about suitable services and goods which depend on income estimations, thus allowing clearer target segmentations. Electricity distribution companies often use income predictions in order to develop their market regionally and estimate their revenues. Finding a relation between electricity consumption and income may thus fit the interests of marketing and research professionals (GUERREIRO et al, 1996).
The discussion in this paper targets the relationship between three constructs: family income; economic classification (based on the Brazilian Criterion); and electricity consumption. The purpose of this study is to investigate the convenience of using the consumption of electricity in order to socially characterize families in the city of São Paulo. It may serve as an indicator to refine the Brazilian Criterion, so that market agents can clearly identify and attend to their target segments. Since there are only a few studies related directly to this topic, this is a seminal paper and may thus foster future investigations.
First we will describe the constructs and indicators examined in this paper, and then present the data sets and variables that are used in the research. We will then provide an analysis of the relationship among the constructs supported by multivariated regression modeling, and the spatial structure of the constructs, using spatial auto-correlation analysis. In addition, we used spatial auto-regressive models, to handle non-normality and heteroskedasticity of the residuals. The main conclusion is that electricity may be an efficient predictor of income, but that it correlates better with high values of income than it does with lower values in the studied context; economic classification, on the other hand, always maintains its high correlation with income, regardless of values. Potential applications of the results are also discussed.
2. Objective
The purpose of this paper is to investigate the relationship between electricity consumption and family income, driven by the theoretical assumption that the higher the energy consumption, the higher the income.
We also analyze the relationship between income and economic classification by means of comparing the variability of that information in the data sets used in this study, in order to better understand our selected population.
H1: The higher the score in the Brazilian Criterion (Economic Classification),
the higher the family income, in the city of São Paulo;
H2: The higher the consumption of electric energy, the higher the family
income, in the city of São Paulo.
H3: There is a spatial dependence pattern of Household Income in the city of
São Paulo, with decreasing income in direction Center-Suburbs.
H4: There is a spatial dependence pattern of Electric Energy in the city of São
Paulo, with decreasing energy consumption in direction Center-Suburbs.
The studied object is the population of the city of São Paulo, and the objective is to characterize the postulated relations in a territorial aggregate level, particularly considering the weighted areas defined on the Demographic Census of 2000 by IBGE – Brazilian Institute of Geography and Statistics. Micro-Data of the Demographic Census of 2000 is jointly used with information of electricity consumption for August, 2000, in the city of São Paulo, aggregated in the same geographic reference units used in the Demographic Census. The population of the city of São Paulo totalized 10,435,546 inhabitants in the year 2000, corresponding to 3,131,389 families (IBGE, 2000).
In addition, preliminary studies in São Paulo municipality with income indicators, social exclusion, educational indicators and sanitation (ZAMBALDI; GOLDSZMIDT, 2006) verified an increase in socioeconomic vulnerability in direction Center-Suburbs.
3. Literature Review
The main concepts, contexts and constructs that support this study are described below; and the relationships between constructs are also presented throughout the text.
3.1. Family, Household and Income
The concept of family used in this paper is the same used by IBGE (2004, p. 19, our translation): “groups of relatives or people living in the same household unit, dependent of each other by means of domestic or living rules; or one singular person who lives alone in a household unit”. Household is defined as “the place of living, separate and independent, constituted of one or more rooms” (IBGE, 2004, our translation). An intrinsic relation between household and family is assumed. The demographic census provides information about the relation of people living in the household with the head of the household and with the head of the family (IBGE, 2002).This allows for the existence of more than one family living in a household, but such circumstances are quite unusual (IBGE, 2002).
Income is understood as the summation of all income provided by work and other sources (IBGE, 2003), and may be calculated for individuals, families or households. It includes the sum of gross income (before taxation) from work, pensions, government and public social security programs (such as minimum income, school grants, or unemployment benefit) and rent of any type, measured in R$. Collecting this kind of data is often difficult and inaccurate.
3.2. Economic Classification and the Brazilian Criterion
In 1996, the Brazilian Criterion of Economic Classification (CCEB), or simply the Brazilian Criterion, was created by ANEP. In 2004, the Brazilian Research Enterprises Association (ABEP) was founded and became responsible for the norms of the Brazilian Criterion (ABEP, 2004). The criterion is frequently criticized because of its limitations in segmenting populations according to lifestyle or social classification (SILVA, 2004). The criterion basically includes indicators of ownership of goods and educational variables of the head of the family in the composition of a scale between 0 and 34, segmenting families into seven classes which are ordered from the top to the bottom: A1, A2, B1, B2, C, D and E. The population distribution of the Brazilian Criterion in metropolitan regions shows variability, reflecting therefore its effective capacity of discriminating purchasing power among different regions (ABEP, 2004).
3.3. Consumption of Electricity
Many studies show that the consumption of electricity has some kind of relation with the income concentration in Brazil. Many authors (LEITE, 1997; MADUREIRA, 1996; POMPERMAYER; CHARNET, 1996; and ARAÚJO, 1979) tried to characterize the domestic consumption of electricity by means of household income variability. Pompermayer and Charnet (1996) found statistically significant influences of social and demographic factors on the consumption of electricity in the State of São Paulo.
Electricity corresponds to 64.2% of the energy consumption of Brazilian households and that share tends to become even greater (MME apud ACHÃO, 2003). After the year 2001, due to a rationing of electricity, the share of electricity in energy residential consumption lowered from 54.8% to 48.8% in the state of São Paulo, but it returned to its growth trend afterwards (GOVERNO DO ESTADO DE SÃO PAULO, 2005).
The growing use of technology in households in the Southeast region by means of computers, and surely the internet - corresponding to an increase of 11% in 2004 (IBGE, 2005), together with the acquisition of goods such as televisions and side-by-side refrigerators, foster the reside-by-sidential use of electric energy and increases its influence over the welfare of families (IBGE, 2005).
From the total of about 5 million consumer units AES Eletropaulo, 9.7% are classified as Low Income Tariff (CAVARETTI, 2005). Adding on that illegal customers, located on subnormal gatherings (slum areas), about 2.4%, we have a good approximation of poor families covered in AES Eletropaulo concession area – 625 thousands (FRANCISCO, 2006).
Every year, AES Eletropaulo does not bill 2,700 GWh derived from non-technical losses, an amount of energy that is greater than the residential consumption of the cities of São Bernardo, São Caetano, Santo André and Diadema which, altogether, have a population of 2 million people. According to ANEEL (2005), the Brazilian Energy Regulatory Agency, the annual commercial loss in the Brazilian power distribution segment was about R$ 5.1 billion in 2005.
4. Data Collection and Operational Aspects of Indicators
We present next the operational aspects of variables used in this paper, and then characterize the investigated universe. Data used here was collected from the Micro-Data of the Demographic Census of 2000, and it is aggregated into territories. We present below the period of observation, reference units, variables and number of cases. The other pieces of data were collected from energy consumption databases and are described here in terms of definition, collection period and granularity. The aggregation strategy of the two data sets in a territorial basis is also presented.
4.1. Micro-Data of the Demographic Census (IBGE, 2000)
Official statistics are a fundamental part of the information systems in a democracy, providing Government and society with data about the economic, demographic, social and environmental situation of the population in a nation (BITTENCOURT, 2005). The Brazilian Institute of Geography and Statistics – IBGE is among the main sources of official data in Brazil. The Brazilian Demographic Census occurs every ten years and maintains a useful retrospective of the population characteristics since 1980. Its information is confidential and may be used only for statistical purposes.
The data collection was carried out between August and November, 2000, in 54,265,618 households of the 5.507 municipals of the whole Brazilian territory, divided into 215,811 areas (IBGE, 2002). Each area is named a census sector and covers from 200 to 300 households.
There are two researches included in the Demographic Census of 2000: (i) the Universe Research, which captures characteristics of the households of the whole population (census); and (ii) the Sample Research, more complex and applied to about 11.7% of the private households; it contains detailed questions about the households and its residents, such as education, religion, work activities and income (sampling).
The Sample Research can not provide statistical significance in the level of census sectors and therefore it is aggregated into weighted areas or geographic units, which are mutually exclusive groups and to which procedures of calibrated estimation are applied in order to make inference for the whole population (IBGE, 2000). The maximum weighted area is municipal and its minimum size is of 400 households, even if that implies noncontiguous areas, always respecting homogeneity characteristics such as income, number of people living in a household, infra-structure and educational level of the heads of the households. Only 482 municipalities had more than one weighted area; the other 5,032 are areas themselves.
There are 9,336 weighted areas in Brazil (IBGE, 2000) and this information refers to July 31st 2000. The city of São Paulo was divided into 96 districts, which are territorial and administrative units under the same judicial and fiscal administration (SEADE, 2005), and are the basis of the creation of the weighted areas with the support of geo-referenced computational systems. The city is divided into 13,278 census sectors and 456 weighted areas, (IBGE, 2000).
Information about the Sample Research is made available by IBGE by means of Micro-Data of the Demographic Census of 2000; each reference unit is a household and allows aggregation on the levels of weighted areas and districts. There are two separate
micro-data files: (i) the household data set; and (ii) the people data set. Interviews were made in 30,669 households in the city of São Paulo and represent the universe of 3,032,905 units. Information of about 1,057,086 people was provided, representing the universe of 10,414,207 people.
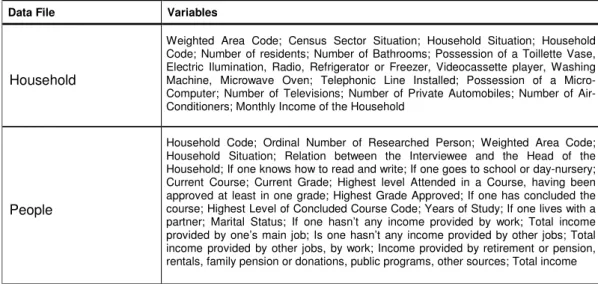
The operational relation between those two data sets (households and people) is made with the household code. Variables don’t allow association with census sectors, but they do allow association with the weighted areas. Table 1 describes main variables in micro-data database.
Table 1. Variables of the Micro-Data of the Demographic Census of 2000 used in the study
Data File Variables
Household
Weighted Area Code; Census Sector Situation; Household Situation; Household Code; Number of residents; Number of Bathrooms; Possession of a Toillette Vase, Electric Ilumination, Radio, Refrigerator or Freezer, Videocassette player, Washing Machine, Microwave Oven; Telephonic Line Installed; Possession of a Micro-Computer; Number of Televisions; Number of Private Automobiles; Number of Air-Conditioners; Monthly Income of the Household
People
Household Code; Ordinal Number of Researched Person; Weighted Area Code; Household Situation; Relation between the Interviewee and the Head of the Household; If one knows how to read and write; If one goes to school or day-nursery; Current Course; Current Grade; Highest level Attended in a Course, having been approved at least in one grade; Highest Grade Approved; If one has concluded the course; Highest Level of Concluded Course Code; Years of Study; If one lives with a partner; Marital Status; If one hasn’t any income provided by work; Total income provided by one’s main job; Is one hasn’t any income provided by other jobs; Total income provided by other jobs, by work; Income provided by retirement or pension, rentals, family pension or donations, public programs, other sources; Total income
4.2. Income and the Adjusted Brazilian Criterion
In this paper, the following sources of income are computed: (i) total family income provided by main job; (ii) total family income provided by work; (iii) total family income (summation of all types of family income); (iv) total household income provided by main job; (v) total household income provided by work; and (vi) total household income (summation of all types of income of the household). Total family income is variable V7616 and total household income is the summation of the income provided by all the residents of the family, even those who aren’t considered family by the IBGE definition.
Data of the People Database provides information about the educational level of the head of the family. The data of the Sample Research could not follow the exact calculation of the Brazilian Criterion, so some adjustments had to be made, as shown with shaded background in Table 2.
Table 2. Comparing the Brazilian Criterion with the Sampled Micro-Data of the Demographic Census 2000
Brazilian Criterion Sample Micro-Data
Number of color televisions Number of televisions
Number of Radios Ownership of Radio
Number of Bathrooms Ownership of a toilette vase (V0210) Number of Bathrooms (V0209) and
Number of automobiles Number of automobiles
for private/personal use (V0222)
Number of Monthly Employees
Number of individuals whose relation with the head of the family is classified as “Domestic Employee” (V0402 of the People Database)
Number of vacuum cleaners Not asked
Number of Washing Machines Ownership of a Washing Machine Number of Videocassette or DVD players Ownership of a Videocassette Number of Refrigerators or Freezers Ownership of Refrigerator or Freezer
In the Brazilian Criterion, one or more Washing Machines provide the same punctuation (1 point), and the same happens with DVDs and Videocassette players (2 points). The simplified collection of data regarding refrigerators doesn’t allow the differentiation of the Brazilian Criterion among families who own a refrigerator and a freezer (3 points), a side-by-side refrigerator (3 points), only one refrigerator (2 points) or only one freezer (1 point). Since the definition of bathrooms in the Criterion differs from that of IBGE, we decided to consider all the private and social bathrooms of the household, for reasons of simplification. There is a slight difference between the definition of Monthly Employee in the Brazilian Criterion and the Domestic Employee by IBGE; the first considers employees who work in the household at least five times a week and the second considers all the employees who live in the household.
Given all adjustments made, the computation of the Adjusted Brazilian Criterion follows the summation presented in Table 3.
Table 3. Adjusted Brazilian Criterion Calculus, based on goods
Goods 0 1 2 3 4 or more Television 0 2 3 4 5 Radio 0 1 1 1 1 Bathroom 0 2 3 4 4 Automobile 0 2 4 5 5 Domestic Employee 0 2 4 4 4 Washing Machine 0 1 1 1 1 Videocassette 0 2 2 2 2 Refrigerator or Freezer 0 2 2 2 2
4.3. Electricity Consumption Data from AES Eletropaulo
According to Francisco (2004), the electric energy distribution companies maintain geo-referenced registers of its customers, including data such as consumption history and payments made. Each residential customer corresponds practically to a household.
AES Eletropaulo, the main energy provider of the City of São Paulo, controls its registers with a customer code, which never changes even though the customer may move to another household. The data in this paper was collected from AES Eletropaulo between September, 1999 and August, 2000, and it was associated to the Micro-Data of the Sample Research of the Demographic Census of 2000. Two variables were computed then: (i) consumption during August 2000 and (ii) monthly consumption (mean) during the investigated period.
IBGE provides the description of the weighted areas of the Demographic Census of 2000. Thus, using spatial algorithms (ESRI, 2000), it was possible for AES Eletropaulo to associate customer codes to a weighted area and to compute the number of active customers in each area. Therefore, we could jointly analyze all forms of computed income (mean), the Adjusted Brazilian Criterion (mean) and the two computed indicators of electricity consumption (mean) for each weighted area of the city of São Paulo.
5. Analysis and Results
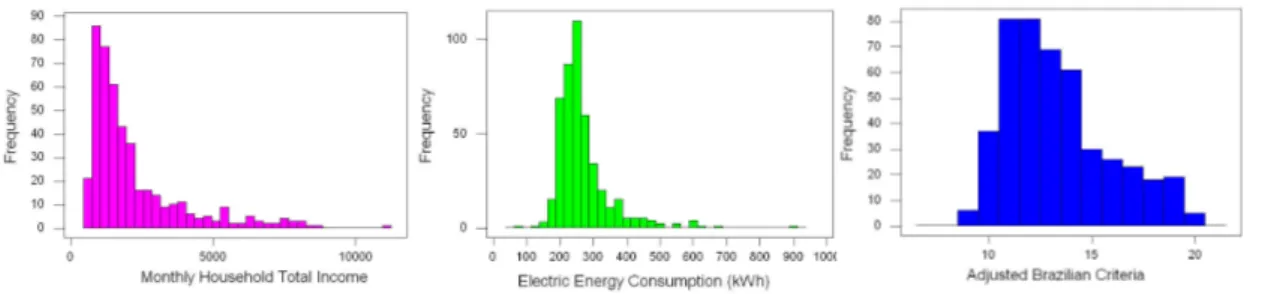
The residential customers of AES Eletropaulo in August 2000 totaled 3,037,992, and the total households pointed out by the Demographic Census of 2000 were 3.039.104, which denotes that the association was proper and shows only a little inconsistency, especially when we analyze the correlation between households and customers in the weighted areas. Figure 1 and Table 4 describes main statistical information of the three constructs.
Figure 1. Histograms of Household Income, Electric Energy Consumption and Adjusted Brazilian Criterion
Table 4. Descriptive Statistics of Household Income, Electric Energy Consumption and Adjusted Brazilian Criterion
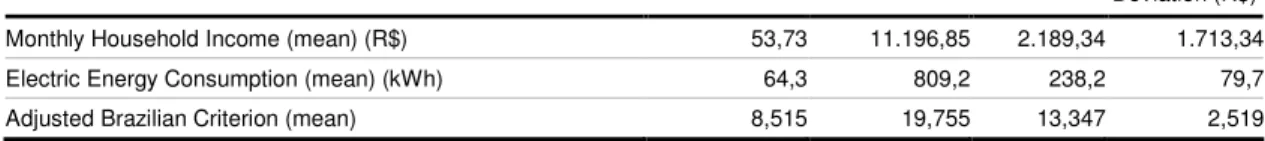
Variable Minimum (R$) Maximum (R$) Mean (R$) Deviation (R$) Standard
Monthly Household Income (mean) (R$) 53,73 11.196,85 2.189,34 1.713,34 Electric Energy Consumption (mean) (kWh) 64,3 809,2 238,2 79,7 Adjusted Brazilian Criterion (mean) 8,515 19,755 13,347 2,519
Because this is a seminal study, no previous models were available; therefore many regression models were performed with income as a dependent variable and with the adjusted Brazilian Criterion and the electricity consumption as independent variables, in order to test the hypothesis H1 and H2. The two following models are the ones with the best fit.
Regression 1: Adjusted Brazilian Criterion as an Income predictor (n=456)
y : Household Income (R$)
x: Adjusted Brazilian Criterion (score)
2 2 2 1 0
7512
.
63
1357
.
36
69
.
30
ˆ
x
x
x
x
y
=
β
+
β
+
β
=
−
+
2 R = 0.960 AdjustedR = 0.960 2 5000 10000 5 10 15 20 Economic Classification Household Family (R$)Regression 2: Electric Energy Consumption as an income predictor
y : Household Income (R$)
x: Electricity Consumption (kWh)
Obs: 8,600 is the maximum of the curve
(
)
1 1 1 08600
0
.
01412
0
.
98665
1
8600
1
ˆ
− −
+
=
+
=
x xy
β
β
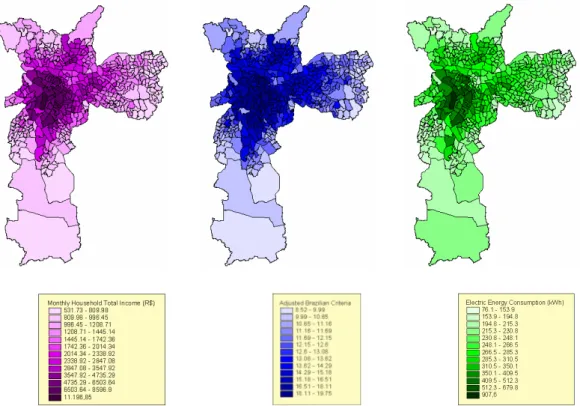
2 R = 0.910 Adjusted R = 0.853 2Maps in Figure 2 illustrate chloropletic distribution of the constructs, and suggest, based on their similarities, they are strongly correlated (FRANCISCO, 2006).
5000 10000
100 200 300 400 500 600 700 800 Household Income (R$)
Figure 2. Maps of the City of São Paulo representing: (i) Monthly Household Total Income, (ii) Adjusted Brazilian Criteria, and (iii) Electric Energy Consumption per Weighted Areas
Both models are adequate and present R2 coefficients higher than 90%, which represents the percentage of data variability explained by the model. Both regressions are significant and so are their coefficients, as can be seen by means of the F and the P-values. The residual error histograms show apparent normality, but suggest that its magnitude tends to increase as the income levels do; their structure is probably more complex than the models can predict. Kolmogorov-Smirnov tests of normality results on 0,171 and 0,129, respectively to regression 1 and 2, which suggests non normality of the residuals.
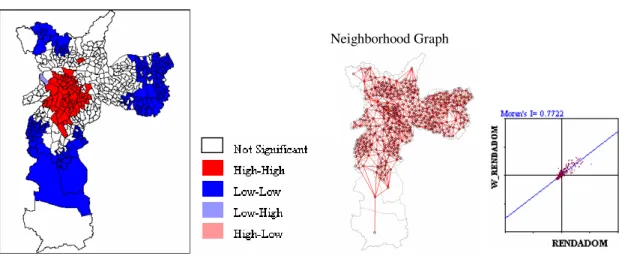
Based on this, we performed spatial auto-correlation analysis, and spatial regression models. Results are shown in Figure 3. Moran’s I is almost 0.78, which suggests strong spatial dependence of Household Income in the city of São Paulo. Similar results were obtained for Electric Energy Consumption.
Figure 3. Moran’s scatter plot and indexes of Household Income, using Queen Contiguity Weight
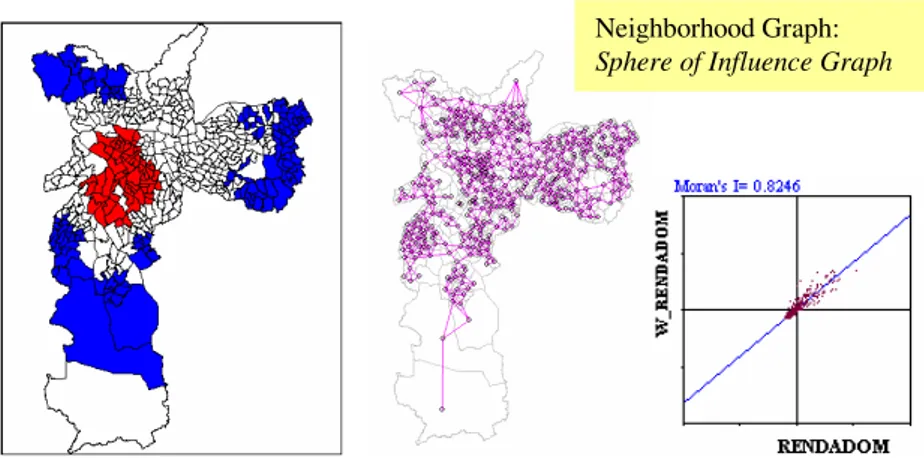
For different neighborhood matrix analyzed, Moran’s I showed high values, up to 0,80 in all three cases. It suggests high influence of neighborhood in Household Income behavior, as well, as pointed in Moran’s scatter plots, an increase of income concentration in direction Suburbs-Center. Maps and diagrams in Figure 4 contain these informations. Neighborhood Graph Neighborhood Graph: Gabriel’s Graph Neighborhood Graph:
Figure 4. Moran’s scatter plot and indexes of Household Income for different Neighborhood graphs
From exploratory spatial analyses pointed above, we’ve proceeded to a spatial dependence diagnose of household income linear regression model. We’ve change scales of household income and electric energy consumption variables – we adopted their logarithms in substitution of themselves. This transformation results in a more linear scatter plot among this two constructs.
So, we’ve incorporated an auto-regressive term in dependent variable and in the residual error. Table 5 shows the final model with spatial dependence of dependent variable and residual error.
Table 5. Summary of the final Spatial Auto-Regressive Model
Data set : energia elétrica
Spatial Weight : areaqueen1.GAL (Queen Contiguity Weight)
Dependent Variable : LNINCOME Number of Observations : 456 Mean dependent var : 7.46738 Number of Variables : 3 S.D. dependent var : 0.633242 Degrees of Freedom : 453 Lag coeff. (Rho) : 0.607507
R-squared : 0.936675 Log likelihood : 171.909 Sq. Correlation : - Akaike info criterion : -337.818 Sigma-square : 0.0253932 Schwarz criterion : -325.451 S.E of regression : 0.159352
Estimated Coefficients
Variable Coefficient Std.Error Z-value Probability W_LNINCOME 0.6075072 0.02163564 28.07901 0.0000000 CONSTANT -3.700081 0.1738361 -21.28489 0.0000000 LNCONSUMPTION 1.193655 0.04949749 24.11546 0.000000
Neighborhood Graph:
The model shows global adjusted statistics (Log Likelihood, Akaike and Schwarz criterions). Positive estimated coefficients confirm non-rejection of H1 and H2 hypothesis. Hypothesis H3 and H4 can be verified from Moran’s I and scatter plots. In addition, the spatial model increased a little bit R2 coefficient (upper than 93%).
The residual error of this model assumed normal distribution pattern and homoskedasticity. Figure 5 shows this distribution, Kolmogorov-Smirnov and Breusch-Pagan tests for normality and heteroskedasticity, error histogram and Moran’s I of residuals. The last one, Moran’s I of residual, is almost zero, which indicates absence of spatial dependence.
TEST DF VALUE PROB
Breusch-Pagan test 1 0.08303925 0.7732202
Figure 5. Residual Errors of the Spatial Regression Model
1,000000 0,500000 0,000000 -0,500000 -1,000000 lag_residu 100 80 60 40 20 0 Fr e que nc y Mean = -2,19298245E-9 Std. Dev. = 0,159527415 N = 456 lag_residu N 456 Mean ,0000 Normal Parameters(a,b) Std. Deviation ,1595 Absolute ,049 Positive ,042 Most Extreme Differences Negative -,049 Kolmogorov-Smirnov Z 1,052
Asymp. Sig. (2-tailed) ,218
10,000000 9,000000 8,000000 7,000000 6,000000 5,000000 lag_predic 0,500000 0,000000 -0,500000 -1,000000 la g _ re s id u
The results of this analysis point pattern of household income distribution between weighted areas can be spatially explained, and the consumption of electric energy is a very strong predictor.
6. Final Remarks
This paper develops an income-predicting model using economic classification and electricity consumption as independent variables; both constructs are revealed as proper for predicting income and their results were adequate on a territorial basis.
These relationships must surely be tested with updated data when and if it is available, since the data here was collected in 2000. Even so, strong correlations show that the consumption of electricity may be an efficient indicator for income prediction. Therefore, this study may inspire the creation of an aggregated set of regional indicators of electricity supply, which can be useful for research institutes and organizations dealing with public and urban affairs. Credit policies may also benefit from regional models which capture money borrowers in a broad way, as with the examples developed here.
The correlation between Income and the Consumption of Electricity is higher for greater values than lower ones, which suggests that the prediction models may fit values with different precision. That seems to be coherent when we analyze the residual errors of the regression models purposed in this paper, which show different patterns of distribution throughout different values of predictor values. Deeper investigations of this distribution are required in the future in order to refine our model. Usage of Spatial statistics analysis handles appropriately residuals behavior, and showed strong potential to support these results.
The smallest geographic units of the recent researches by SEADE and IBGE are districts; this means that working with the weighted areas is a new and more granular approach.
In spite of the very strong correlation between household income and electricity consumption, the use of weighted areas incorporates the compensation between high income dwellings (with lots of electric and modern goods, that do not waste much energy) and low income ones (with some cultural habit of power stealing and still, in many cases, old electrical appliances, that waste considerable energy).
The results in a household level investigation (FRANCISCO, 2006) showed that energy consumption alone cannot substitute for the Brazilian Criteria or the household income itself. However, the combined use of the Brazilian Criteria, the household electricity monthly bill and the number of residents (or number of bedrooms) in the household significantly improves household income estimates. Especially among low income households, the level of association between income and electricity consumption was very weak. It could be justified by cultural aspects of power stealing habit in this population, and the newest tendency to spend a larger fraction of their income on electrical appliances, given the financing facilities that department stores now offer. Nevertheless, household income forecasts can be enhanced, with an improvement of the model’s R-squared from 0,222 to 0,300 when the electricity bill and
the number of residents are included in a regression model of household income against the Brazilian Criteria.
In summary, at territorial level, Income and economic classification are recognized as efficient proxies for purchasing power; and the consumption of electricity is assumed to denote usage of high-valued goods. The expected relationships are supported by positive and significant results of correlation analysis and regression modeling. These results may be useful to marketing researchers, policy makers, credit agents and public administration professionals. As it is an easily available and monthly updated information, the electric energy consumption indicators, when published widely by energy distribution companies, can be useful for strategies formulation and decision making which use data of household income classification, concentration analysis and prediction. It includes potential contribution for load and consumption forecast process and support for planning strategies in electricity distribution companies.
References
ABEP – Associação Brasileira de Empresas de Pesquisa (2004, December 22). Critério
de Classificação Econômica Brasil. São Paulo. Available in http://www.anep.org.br.
Achão, C. C. L. (2003). Análise da Estrutura de Consumo de Energia pelo Setor
Residencial Brasileiro. Ph.D. Thesis, Universidade Federal do Rio de Janeiro, Rio de
Janeiro, Brazil.
ANEEL – Agência Nacional de Energia Elétrica. (2005, November). A importância das
ações de comunicação para a redução das perdas não-técnicas. Trabalho
apresentado no 1º Fórum de Comunicação na Distribuição de Energia Elétrica. Brasília, Brazil.
Araújo, H. P. M. (1979). O Setor de Energia Elétrica e a Evolução Recente do
Capitalismo no Brasil. COPPE-UFRJ. Rio de Janeiro.
Bittencourt, N. (2005, July). Uso de Bancos de Dados Oficiais. Course offered in Primeira Escola de Inverno of FGV-EAESP. Fundação Getulio Vargas. São Paulo. Bussab, W. O., & Ferreira, M. (1999). Critério Brasil de Estratificação Socioeconômica:
Aspectos Demográficos. Proceedings of CLADEA, San Juan, Porto Rico, 34.
Cavaretti, J. L. (2005, November). Consumidor de Baixa Renda e os Desafios das
Distribuidoras. Trabalho apresentado no VIII Encontro Nacional de Conselhos de
Consumidores. São Paulo, Brazil.
ESRI (2000). ArcView GIS White Paper. Versão 3.2 Available in http://www.esri.com. Francisco, E. (2002). Customer Franchise – A Mina de Ouro do Geomarketing.
InfoGEO, 25, Coluna GEOInsights, 56-57, August. Curitiba: MundoGEO.
Francisco, E. (2004). Análise do Potencial de Uso do Comércio Eletrônico na AES Eletropaulo. Negócios na Era Digital. FGV-EAESP, São Paulo.
Francisco, E. R. (2006). Relação entre o Consumo de Energia Elétrica, a Renda e a
Caracterização Econômica de Famílias de Baixa Renda do Município de São Paulo.
Master Thesis, Escola de Administração de Empresas de São Paulo, Fundação Getulio Vargas, São Paulo, Brazil.
Governo do Estado de São Paulo (2005). Balanço Energético do Estado de São Paulo 2005. Ano Base 2004. Secretaria de Energia, Recursos Hídricos e Saneamento. São Paulo. Available in http://www.energia.sp.gov.br.
Guerreiro, A. G., Serra, S. T., Carvalho, M. L. R. de, & Silva Filho, M. C. de (1996). A
influência da Venda de Eletrodomésticos na Expansão do Consumo Residencial de Energia Elétrica. Rio de Janeiro: Departamento de Planejamento de Sistemas
Energéticos – UNICAMP, Anais do VII Congresso Brasileiro de Energia – CBE. IBGE – Instituto Brasileiro de Geografia e Estatística (2005). Pesquisa Nacional por
Amostra de Domicílios, 2004. Rio de Janeiro, Brazil: Author.
IBGE – Instituto Brasileiro de Geografia e Estatística (2004). Pesquisa de Orçamentos
IBGE – Instituto Brasileiro de Geografia e Estatística (2003). PNAD - Pesquisa
Nacional por Amostragem de Domicílios: Síntese de Indicadores 2003. Rio de
Janeiro, Brazil.
IBGE – Instituto Brasileiro de Geografia e Estatística (2002). Censo Demográfico 2000. Rio de Janeiro, Brazil.
IBGE – Instituto Brasileiro de Geografia e Estatística (2000). Censo Demográfico 2000. Características Gerais da População. Rio de Janeiro, Brazil: Author.
Madureira, R. G. (1996). Análise dos Aspectos Socioeconômicos, Históricos e Culturais determinantes do Consumo de Energia Elétrica no Setor Residencial Brasileiro. Rio de Janeiro: Departamento de Energia da FEM-UNICAMP,
Mattar, F. N. (1996). Porque os Métodos de Classificação Socioeconômicos utilizados
no Brasil não funcionam. São Paulo: Proceedings of 20º ENANPAD. Available in
http://fauze.com.br.
Pompermayer, M. L., & Charnet, R. (1996). Determinantes da Demanda Residencial de Energia Elétrica. Proceedings of VII Congresso Brasileiro de Energia – CBE. Rio de Janeiro: Departamento de Planejamento de Sistemas Energéticos – UNICAMP. SEADE – Fundação Sistema Estadual de Análise de Dados (2005). Informações dos
Distritos de São Paulo. Access in 12 Apr. 2005 in http://www.seade.gov.br.
Silva, N. L. (2004, December 22). Critério Brasil: o mercado falando a mesma língua. São Paulo. Available in http://www.anep.org.br.
Zambaldi, F., Goldszmidt, R. G. B. (2006). Análise do Perfil Social de São Paulo. Trabalho apresentado na disciplina Análise Espacial de Dados e Geoestatística Aplicada à Administração, Fundação Getulio Vargas. São Paulo, Brasil.