UNIVERSIDADE DO ALGARVE
Faculdade de Ciências e Tecnologia
Optimization and Validation of a Method for
the Analysis of Target Compounds Migrating
from Organic Materials Used in Contact with
Water Intended for Human Consumption by
SPME-GC-TOFMS.
John Ekaney Mbenju
Mestrado em Qualidade em Análises
(European Master in Quality in Analytical Laboratories)
UNIVERSIDADE DO ALGARVE
Faculdade de Ciências e Tecnologia
Optimization and Validation of a Method for
the Analysis of Target Compounds Migrating
from Organic Materials Used in Contact with
Water Intended for Human Consumption by
SPME-GC-TOFMS.
John Ekaney Mbenju
Thesis Supervised by: Dr. Vitor Vale Cardoso
Prof. Isabel Cavaco
Mestrado em Qualidade em Análises
(European Master in Quality in Analytical Laboratories)
Abstract
Abstract
The leaching of toxic organic substances from polymeric materials in distribution
systems into drinking water intended for human consumption has led to an urgent
need for the continuous development of new analytical methods for their monitoring
and evaluation so that high consumer confidence could be established.
An analytical method is developed and validated based on the combination of SPME
and GC/TOFMS for the determination of seven target compounds: n-butylacetate,
m-xylene, p-m-xylene, 1,3-dichloroacetone, styrene, o-m-xylene, cyclohexanone. The
chromatographic conditions are optimized so that the analysis is performed in the
shortest possible time and a specific mass ion for each compound is targeted in the
TOF mass spectrum for quantification.
Three SPME adsorption parameters: mode of extraction, extraction temperature and
time are optimized for five fibers to attain the best selectivity and sensitivity for each
target compound and based on the highest extraction efficiency, the best fiber and its
optimized conditions are used for the validation process.
The LOD and LOQ were lower than the lowest concentrations used in the calibration
curves and the determination coefficient (r
2) ranged from 0.995-0.999 within the
tested working ranges for all target compounds. The coefficient of variation for
repeatability studies was less than 25% for all compounds but it exceeded 25% for
some compounds during intermediate precision studies. Recovery studies in both tap
and surface water showed that matrix effects play a significant role in the extraction of
target compounds from water.
Resumo
ii
Resumo
A lixiviação de substâncias orgânicas tóxicas provenientes de material polimérico em
sistemas de distribuição de água potável destinada para o consumo humano levou a
uma necessidade urgente de desenvolver novos métodos analíticos para monitorização
e avaliação destes compostos, com objectivo de melhorar a confiança do consumidor.
O método analítico desenvolvido e validado foi baseado na combinação da técnica de
SPME com GC/TOFMS para a determinação de sete compostos, sendo estes:
n-butilacetato, m-xileno, p-xileno, 1,3-dicloroacetona, estireno, o-xileno e ciclohexanona.
As condições cromatográficas foram optimizadas de maneira a reduzir o tempo de
análise e ter uma razão massa/carga do ião específica para quantificação dos
compostos através do espectro de massas TOF.
O modo de extracção, a temperatura e o tempo foram três dos parâmetros optimizados
para a adsorção por SPME. Foram utilizadas cinco fibras de modo a atingir-se melhor
selectividade e sensibilidade para cada composto. A validação do método foi feita com
a fibra com melhor eficiência e com as condições já optimizadas.
Os valores de LOD e LOQ obtidos foram mais baixos do que a concentração mínima
usada nas curvas de calibração e o coeficiente de correlação (r
2) varia entre 0.995 e
0.999 nas gamas de trabalho. O coeficiente de variação para estudos de repetibilidade
foi menor que 25% para todos os compostos, mas para alguns compostos excedeu os
25% durante os estudos de precisão intermédia. Nos estudos de recuperação destes
compostos em águas da torneira e de superfície verificou-se um efeito significativo de
matriz.
Acknowledgements
Acknowledgements
I wish to express my sincere thanks and appreciation most especially to:
Eng.Maria Joao Benoliel and Dr.
aElisabete Rodrigues for making it
possible to do this work at EPAL Central Laboratory, Lisbon, Portugal.
Prof. Isabel Cavaco and Miquel Esteban for their coordination throughout
my study time at the EMQAL program.
Dr. Vitor Vale Cardoso who was my supervisor at EPAL Central Laboratory.
He was always available to provide his expertise, read thoroughly through my
work and made all the necessary corrections. His positive attitude and
inspiring talks provided a healthy and convenient environment for me to carry
out my work.
Dr. Alexandre Rodrigues, Dr
aAna Penetra and Carina Reiche for their
assistance and direction with respect to sample preparation and instrument
operation.
Antonio Valdemar Nunes who was always available for maintenance of the
GC/TOFMS instrument.
Marina Vides Silva and Charlotte Lopes for their help in translating the
abstract to Portuguese. Through their helpful and supportive attitude, I was
forced to learn and speak Portuguese during my stay in Portugal.
Antonio Pato and Lilli Herendi for their good company and friendship.
Concei
çao Alexandre and Cristina Vania Constantino for making sure that
all the laboratory glassware were always clean and ready for use.
Objective
iv
Objective
Develop and validate an analytical method for the analysis of target organic compounds that migrate from organic materials that come into contact with drinking water using SPME-GC/TOFMS.
Symbols
Symbols
tR – Retention time
tm –Dead time
t/R –Adjusted Retention time
k – Capacity factor
KC– Distribution constant
α – Selectivity factor β– Phase ratio r – Radius of column
df– Film thickness of column
R– Resolution
Wh –Peak width at half height of peak
N –Number of theoretical plates H –Plate height
L –Length of column
AS –Concentration in stationary phase
AM– Concentration in mobile phase
n –number of moles Kfs– Partition coefficient
Vf– Volume of polymeric phase
Vs –Volume of aqueous phase
C –Concentration
Sy/x – Residual standard deviation of the calibration curve
b– Slope of calibration curve r2– Determination coefficient
Abbreviations
Abbreviations
DEHP− Bis (2ethylhexyl) phthalate DVB−Divinylbenzene
ECD− Electron capture detector FID −Flame ionization detector GC −Gas chromatography
HDPE− High density polyethylene
HPLC −High performance liquid chromatography HS− Headspace
LLE− Liquid liquid extraction LOD− Limit of detection LOQ− Limit of quantification
MCL −Maximum concentration level NPD −Nitrogen phosphorous detector PG− Test value
PDMS− Polydimethylsiloxane PVC −Polyvinylchloride SPE− Solid phase extraction
SPME− Solid phase microextraction
Oa-TOF− Orthogonal acceleration-time of flight TON− Threshold odor number
USEPA− United states environmental protection agency WHO− World Health Organization
List of Figures
viii
List of Figures
Figure 2.1 Schematic diagram of gas chromatograph Figure 6.0 Chromatogram of target compounds
Figure 6.1 Optimization of split ratio using 50/30um DVB/Carboxen/PDMS Stable Flex (Gray) fiber
Figure 6.2 Optimization of extraction temperature using50/30um DVB/Carboxen/PDMS Stable Flex (Gray) fiber
Figure 6.3 Optimization of stirring speed using 50/30um DVB/Carboxen/PDMS Stable Flex (Gray) fiber
Figure 6.4 Optimization of extraction time using 50/30um DVB/Carboxen/PDMS Stable Flex (Gray) fiber
Figure 6.5 Salting-out effects using 50/30um DVB/Carboxen/PDMS Stable Flex (Gray) fiber Figure 6.6 Comparison of extraction efficiency at different extraction modes with 65um Polydimethylsiloxane- Divinylbenzene (Blue) fiber
Figure 6.7 Comparison of extraction efficiency at different temperatures with 65um Polydimethylsiloxane- Divinylbenzene (Blue) fiber
Figure 6.8 Comparison of extraction efficiency at different times with 65um Polydimethylsiloxane- Divinylbenzene (Blue) fiber
Figure 6.9 Comparison of extraction efficiency at different extraction modes with 100um Polydimethylsiloxane (Red) fiber
Figure 6.10 Comparison of extraction efficiency at different temperatures with100um Polydimethylsiloxane (Red) fiber
Figure 6.11 Comparison of extraction efficiency at different times with 100um Polydimethylsiloxane (Red) fiber
Figure 6.12 Comparison of extraction efficiency at different extraction modes with 50/30um DVB/Carboxen/PDMS Stable Flex (Gray) fiber
Figure 6.13 Comparison of extraction efficiency at different temperatures with 50/30um DVB/Carboxen/PDMS Stable Flex (Gray) fiber
Figure 6.14 Comparison of extraction efficiency at different times with 50/30um DVB/Carboxen/PDMS Stable Flex (Gray) fiber
Figure 6.15 Comparison of extraction efficiency at different extraction modes with 85um Polyacrylate, Fused Silica (White) Fiber
List of Figures
Figure 6.16 Comparison of extraction efficiency at different temperatures with 85um Polyacrylate, Fused Silica (White) Fiber
Figure 6.17 Comparison of extraction efficiency at different times with 85um Polyacrylate, Fused Silica (White) Fiber
Figure 6.18 Comparison of extraction efficiency at different extraction modes with 75um Carboxen-PDMS (Black) Fiber
Figure 6.19 Comparison of extraction efficiency at different temperatures with 75um Carboxen-PDMS (Black) Fiber
Figure 6.20 Comparison of extraction efficiency at different times with 75um Carboxen-PDMS (Black) Fiber
Figure 6.21 Comparison of different fibers at their optimal conditions
Figure 6.22 Comparison of repeatability and intermediate precision at minimum level concentration
Figure 6.23 Comparison of repeatability and intermediate precision at medium level concentration
Figure 6.24 Comparison of recovery in tap water and surface water at minimum level concentration.
Figure 6.25 Comparison of recovery in tap water and surface water at medium level concentration.
List of Tables
x
List of Tables
Table 5.1: Analytical standards
Table 5.2: Concentration of individual standard stock solutions Table 5.3: Concentration of standards in Mixed Solution A Table 5.4: Concentration of standards in Mixed Solution B Table 5.5: Concentration of standards in Mixed Solution C Table 5.6: Two levels of concentration for precision studies. Table 6.1: Column oven program used at EPAL Laboratory Table 6.2: Retention times and mass ions for target compounds Table 6.3: Optimized column oven program for analysis
Table 6.4: Concentration of components in immersion mode (18ml water) Table 6.5: Concentration of standards in headspace mode (15ml water) Table 6.6: Determination of linearity and linear range using Mandel Test. Table 6.7: Determination of linearity and linear range using Rikilt Test
Table 6.8: LOD and LOQ values for target compounds using calibration curves.
Table 6.9 Precision for SPME-GC/TOFMS method under repeatability conditions (n=10) Table 6.10: Precision for SPME-GC/TOFMS method under intermediate precision conditions (n=6)
Table 6.11: Recovery studies in tap water Table 6.12: Recovery studies for surface water
Table of Contents
Table of Contents
Abstract ... i Resumo ... ii Acknowledgements ... iii Objective ... iv Symbols ... v Abbreviations ... viiList of Figures ...viii
List of Tables ... x
1. Migration of Organic Compounds from Polymeric Materials ... 1
1.1 Introduction. ... 1
1.2 European Legislation ... 4
1.3 Target Organic Compounds ... 5
Butylacetate ... 5
Cyclohexanone ... 6
Styrene ... 6
Xylenes ... 6
2. Gas Chromatography-Mass Spectrometry Time of Flight (GC/TOFMS) ... 8
2.1 Gas Chromatography. ... 8
2.2 Gas Chromatographic Parameters ... 8
2.3 Gas Chromatographic Instrumentation ... 11
2.4. Mass Spectrometry-Time of Flight ... 13
2.5 Components of a Mass Spectrometer-Time of Flight ... 14
3. Sample Preparation ... 17
3.1. Solid Phase Microextraction ... 17
3.2. Theory of Solid Phase Microextraction ... 17
4. Method Validation ... 19
5. Experimental Procedure ... 21
5.1 Materials and Equipments ... 21
5.2 Reagent ... 22
5.3 Samples ... 22
List of Tables
xii
5.5 Preparation of Solutions225.5.1 Preparation of Individual Standard Stock
Solutions ... 22
5.5.2 Preparation of Mixed Solutions ... 23
5.5 Gas Chromatographic and Mass Spectrometric Conditions ... 25
5.5.1 Equipment ... 25
5.5.2 Gas Chromatographic Conditions ... 25
5.5.3 Mass Spectrometric Conditions. ... 26
6. Discussion of Results ... 28
6.1 Optimization of Chromatographic Parameters... 28
6.1.1 Optimization of Column Oven Temperature Program ... 29
6.2 Optimization of SPME Method... 30
6.2.1 Optimization of Split Ratio ... 31
6.2.2 Optimization of Extraction Temperature ... 32
6.2.3 Optimization of Stirring Speed ... 32
6.2.4 Optimization of Extraction Time ... 33
6.2.5 Effect of Sodium Chloride (Salting-out) on Extraction of Components ... 34
6.3 Optimization of Fibers for SPME ... 34
6.3.1 Optimization of 65um Polydimethylsiloxane-Divinylbenzene (Blue) Fiber ... 35
6.3.2 Optimization of 100um Polydimethylsiloxane Coating (Red) Fiber ... 37
6.3.3 Optimization of 50/30um DVB/Carboxen/PDMS Stable Flex (Gray) Fiber ... 40
6.3.4 Optimization of 85um Polyacrylate, Fused Silica (White) Fiber ... 42
6.3.5 Optimization of 75um Carboxen-PDMS (Black) Fiber... 44
6.4 Selection of Fiber and Conditions for Validation Studies ... 46
6.5 Method Validation Studies ... 46
6.5.1 Linearity and Working Range ... 47
6.5.2 Limit of Quantification and Limit of Detection ... 48
6.5.3 Precision Studies ... 49
6.5.4 Analyte Recovery ... 51
7 Conclusions ... 56
Table of Contents
Annex 1 Least Square Regression Method ... I Annex 2 Mandel Test ... IX Annex 3 Rikilt Test ... XVI
Migration of Organic Compounds from Polymeric Materials
1. Migration of Organic Compounds from Polymeric Materials.
1.1 Introduction.
The definition of water quality is usually associated with a set of upper and lower limits on selected performance parameters. Therefore, drinking water could be considered unfit for consumption if one or more parameters exceed from specific regulations, or if these regulations do not exist at all, they exceed guidelines or self-imposed limits set by consumer service needs1.
Any typical modern water supply is a complex system composed of: water source, treatment plant, transmission mains, and a water distribution network, which is comprised of pipes, pumps and storage tanks. Since water is usually in contact with these components that could compromise quality, the distribution network is usually the most critical because it is nearest to the delivery point and if filter devices are absent at the consumer level, there would be no safe barriers before the water is consumed1.
Older pipes used for the supply of drinking water were manufactured from metallic materials. With these pipes, water contamination was prevalent because corrosion and devices used in plumbing caused an increase in the concentration of metal content in water. Although different metals are affected by different corrosion processes, the contributing factors that increase corrosion rates are low water pH, dissolved oxygen, high temperature and dissolved solids. The leaching of heavy metals (lead and cadmium) and secondary metals (Copper from home plumbing, Iron from distribution pipes and Zinc from galvanized pipes) into drinking water causes not only taste, odor and color problems but also serious health risks to humans1. Nowadays, most of the pipes used in the supply of drinking water are manufactured from polymer materials. These polymer materials contain certain organic and inorganic additives that enhance the durability of the material, its manufacturing, the handling throughout installation, and modification of color. These additives include: antioxidants and some stabilizers, lubricants, softeners and coloring agents. High-density polyethylene (HDPE) and polyvinylchloride (PVC) polymers are mostly used in producing pipes for water supply though the former is usually preferred to the latter2.
Migration of Organic Compounds from Polymeric Materials
2
All pipes made of polymer materials are expected to have a lifetime of 100 years in the ground. This implies that these pipes have to comply with stringent quality requirement pertaining to good mechanical strength. Though good mechanical properties are fundamental, there is always a possibility of toxic organic compounds being leached from these pipes into drinking water2.
Diffusion is a common process by which organic compounds can be leached from pipes made of polymeric materials into drinking water2. For example, 2,4-di-tert-butyl-phenol is a known degradation product from antioxidants that easily migrates from HDPE pipes into drinking water. Also, a variety of esters, aldehydes, ketones, aromatic hydrocarbons and terpenoids are also believed to migrate from HDPE pipes into drinking water by diffusion3.
The formation of biofilm on the interior surface of a pipe also causes the leaching of metabolites into drinking water2. A biofilm is a deposition of microorganisms, products of microbial activities or detritus at the surface of the pipe. When any injured bacteria pass from the treatment plant into distribution network, the presence of a biofilm encourages bacteria regrowth. This regrowth of bacteria in the distribution system leads to an increase in demand of chlorine in the system while reducing the amount of free chlorine and this hinders the ability of the system to cope with minute occurrences of contamination1.
Drinking water intended for human consumption should have no significant taste or odor. A quantitative parameter called threshold odor number (TON) can be used to assess odor, thus providing information about the presence of organic compounds that migrate from pipes of polymeric materials into drinking water. It has been established that water transported through pipes made of HDPE has a TON above four indicating the presence of organic compounds in water transported through these pipes3.
Organic compounds that migrate from pipes made of polymer materials into drinking water have an adverse impact on the health of humans. These leached compounds could be identified as endocrine disruptors (Bisphenol A, DEHP), suspected as carcinogens (styrene), and teratogens. By having a clear understanding of the interaction and the effect of the distribution system materials, limits could be established for the supply of high quality water to consumers13.
Migration of Organic Compounds from Polymeric Materials
Analysis of organic compounds in water is usually an important domain in environmental monitoring and evaluation for establishing high consumer confidence. Today, most of the powerful instrumentation used for the quantitative and qualitative analysis of most target organic compounds in water mainly involves the coupling of gas chromatography (GC) with mass spectrometry (GC-MS). However, extracting some of these target organic compounds is always time-consuming and is also the most difficult task in the analysis due to matrix interferences4.
Matrix interference occurs in two types: interference from non-target compounds and strong adsorption by the matrix. During the extraction of target compounds from the matrix, there is always a possibility that non- target compounds are also extracted. On performing GC-MS analysis, non-target compounds could co-elute with and mask the target compounds. However, strong adsorption by matrix leads to poor recovery4.
Since the quality of the sample preparation is a major factor that determines the success of any analysis, there is always a need to develop new methods that are sensitive and selective for extracting and isolating target components from matrices. A sample preparation method is considered ideal if it is fast, accurate, precise and consumes very small amount of solvent. Other factors that should be considered for any modern extraction method include sample integrity, high throughput and compatibility with subsequent techniques for analysis. Also, it should be adaptable to the field of work and should consist of low cost materials5.
A rapidly growing area in analytical sample preparation is solid-phase microextraction (SPME) 6. The development of this method was simply based on the attempt to redress the limitations in solid-phase extraction (SPE) and liquid-liquid extraction (LLE). With this method, sampling, extraction, concentration and sample introduction are integrated into a single solvent-free step. It involves the direct extraction and concentration of analytes in the sample to an extraction fiber. As a result, there is a great reduction in preparation time and disposal time and significant improvement in detection limits. Also, this method is easily used in combination with GC/MS and could be applied to wide range of organic compounds in environmental, biological and food samples. The method tends to combine good analytical performance with simplicity at low cost and can be easily automated. The extracts obtained are relatively clean and concentrated implying that the method is ideal for MS applications7.
Migration of Organic Compounds from Polymeric Materials
4
The main purpose of this project is to develop an analytical method to obtain the desired limit of detection with the required linear range in the shortest possible analysis time for the determination of target organic compounds that migrate from pipes made of polymer materials in drinking water. This mainly involves the usage of SPME for extraction of organic components together with GC/TOFMS for qualitative and quantitative determinations. Several factors considered when developing this SPME method include: selection of the stationary phase on the fiber and cryofocusing temperature that affect sensitivity whereas the SPME adsorption conditions influence efficiency. After optimizing the method, the limit of detection (LOD), limit of quantification (LOQ), linear range and precision are being established. This work therefore discusses the influence of stationary phase, time, temperature and stirring on method development for target organic compounds that migrate from pipes made of polymer materials. A brief description of the European Directive on the Quality of Drinking Water Intended for Human Consumption is discussed below including general information of the target organic compounds used for this study.
1.2 European Legislation13.
In an attempt to address issues relating to the quality of drinking water intended for human consumption in the European Union, the Council Directive 98/83/EC of 3 November 1998 was adopted. It establishes the quality standards and monitoring programs for water supplied from a distribution network and that substances or materials in contact with potable water do not influence the quality of drinking water. Other issues that are addressed in this directive include the quality assurance of products and materials used in contact with drinking water. In order to set the basis for the approval of materials that come in contact with drinking water in the European Union, several standards relating to these materials have been approved during the last years in the CEN. These include:
EN 1420-1 (1999): Determination of odor and flavor assessment of water in piping systems on the influence of organic materials on drinking water.
EN 13052-1 (2001): Determination of color and turbidity on the influence of organic materials on drinking water.
Migration of Organic Compounds from Polymeric Materials
EN 14395-1 (2004): Organoleptic assessment in storage systems on the influence of organic materials on drinking water.
EN 14728 (2006): Determination of chlorine demand on the influence of organic materials on drinking water.
EN 12873-1 (2003) and EN 12873-2 (2005): Effect of migration on the influence of organic materials on drinking water.
EN 14944-1 (2006) and EN 14944-3 (2007): Effect of cement products on drinking water.
prEN 15768 (2009): Identification of water leachable organic substances from materials in contact with water intended for human consumption using GC-MS.
Since Portugal is a member of the European Union, these directives have been adopted and the Portuguese Environment Ministry has established a national level decree for drinking water in Decreto-lei no 306/2007 de 27 de Agosto.
Though there are no approved systems for materials that come in contact with water at both European and Portuguese level, there is an urgent need to ensure that materials which come in contact with drinking water meet the required quality. It is for this reason that EPAL (Epresa Portuguesa das Aguas Livres, S.A.) has developed an internal approval system for organic and cement materials used in its supply system based on tests defined in European Standards. Other European countries have developed their own national approval systems based on these European standards.
1.3 Target Organic Compounds.
Butylacetate (1-acetoxybutane, acetic acid butyl ester).
It is a colorless liquid with a mild odor that is usually used in the manufacture of paints, coatings and adhesive. It is also used as an extraction solvent in the pharmaceutical industries because of its low solubility in water15.
Migration of Organic Compounds from Polymeric Materials
6
Since it is applied to plastic coatings, there is a tendency for it migrating from the plastic product to the environmental matrix. Ingestion of this compound is harmful to the lungs and nervous system15.
Determination of this compound has been done by GC coupled with FID16. The Drinking Water Directive has no parametric value for this compound and the WHO guidelines and US EPA have not established any limit yet.
Cyclohexanone
It is a colorless liquid that is produced by the oxidation of cyclohexane in air or partial hydrolysis of phenol. They are usually applied to paints, vanish removers, natural and synthetic resins. This compound degrades rapidly by reaction to sunlight and it is biodegradable in water17.
This compound could be analyzed by HPLC and GC coupled with FID18. There is no parametric value for this compound in the Drinking Water Directive and the WHO guidelines and USEPA have not set any limits for it.
Styrene (Vinylbenzene, Phenethylene, Ethenylbenzene, Styrol).
This compound is produced for the catalytic dehydrogenation of ethyl benzene and also used for the production of polystyrene and styrene polymers19.
Exposure to small quantities of styrene could cause neurotoxic, hematological and carcinogenic effects20. This compound has been determined with HPLC coupled with FID, ECD, NPD and MS21. There is no parametric value for this compound in the Drinking Water Directive but the WHO guidelines have set a limit of 0.02mg/L and the US EPA has established a limit of 0.1mg/L.
Xylenes (m-,o-,p-xylene or xylol or dimethylbenzene).
These compounds occur naturally in petroleum, coal tar and could be formed during forest fires22. They are used as solvents in paints, rubber and leather and are also used in the manufacture of plastics23. Exposure to these compounds could lead to damaging effects in the liver, heart, kidneys, lungs and nervous system24.
Migration of Organic Compounds from Polymeric Materials
These compounds are usually analyzed in water samples by GC/MS with the use of sample preparation techniques like Purge and Trap, HS, SPME and LLE. There are no parametric values for these substances in the Drinking Water Directive and the WHO guidelines have not set any value for them. However, the US EPA has set an MCL of 1mg/L for these compounds.
Compound Structure Nominal
Mass(Da) Boiling Point (0C) Melting Point (0 C) Water Solubility Vapour Pressure at 200C n-Butylacetate (C6H12O2) 116 126 -74 0.7g/100ml 1.3KPa
m-Xylene(C8H10) 106 139 -48 Insoluble 1.12KPa
p-Xylene(C8H10) 106 138.35 13.2 Insoluble 1.11KPa
Styrene(C8H8) 104 145 -30 <1% 5mmHg
o-Xylene 106 144.4 -24 Insoluble 0.19KPa
Cyclohexanone (C6H10O)
Gas Chromatography-Mass Spectrometry Time of Flight (GC/TOFMS)
8
2. Gas Chromatography-Mass Spectrometry Time of Flight
(GC/TOFMS).
The coupling of gas chromatography to mass spectrometry is an advanced technique that is commonly used in the identification and quantification of organic pollutants in environmental samples. This technique offers a wide range of applications because while gas chromatography results in high separation efficiency, mass spectrometry provides good qualitative information and high sensitivity12.
2.1 Gas Chromatography.
It is one of the most common and powerful instrumental techniques used in the identification if coupled to mass spectrometry and measurement of individual components in a sample based on differences in their volatilities and structures8. This technique is capable of achieving high efficiencies of separation with capillary columns, provides high sensitivity of detection for very small amounts of separated components and gives precise and accurate data for quantitative analysis of complex samples9.
2.2 Gas Chromatographic Parameters8.
Retention Time (tR).
It is a measure of how long it takes a compound to travel down the column and could be considered as the time a compound spends in the column. It is the total time that the compound spends in the stationary and mobile phases. This time is dependent on the column type, column temperature and carrier gas linear velocity.
Gas Chromatography-Mass Spectrometry Time of Flight (GC/TOFMS) Adjusted Retention Time (tlR).
It is simply the difference between the retention time (tR) and the column dead time (tm). The
column dead time is usually determined by injecting a non-retained compound and measuring its retention time.
tlR= tR - tm Equation 2.2.1
Retention Factor (k).
It is the ratio of the time a compound spends in the stationary phase (tlR) to the time it spends
in the mobile phase(tm).
k = tlR/tm Equation 2.2.2
Phase Ratio (β).
It is a dimensionless value relating the diameter (2r) and film thickness (df) of the column. It
is used to assess the effect of column diameter and thickness on retention. β = r/2df Equation 2.2.3
Distribution Constant (Kc).
It is the ratio of the concentration of a compound in the stationary and mobile phase. It can also be expressed as a product of the phase ratio (β) and capacity factor (k).
Kc = (A)S/(A)M =kβ Equation 2.2.4
Selectivity or Separation Factor (α).
It is the ratio of the capacity factors of two peaks. If α = 1, it means that the two peaks have the same retention and co-elute.
α = k2/k1 Equation 2.2.5 k1 = partition ratio of the earlier eluting peak. k2 = partition ratio of the later eluting peak.
Gas Chromatography-Mass Spectrometry Time of Flight (GC/TOFMS)
10
Resolution (R).
It is a measure of the amount of separation between two peaks by considering the widths of the peaks. A resolution of 0.3% overlap means that two peaks are fully resolved without any baseline or space between them. Resolution less than 1.5 means that two peaks are partially resolved or have some degree of overlap. Resolution of more than 1.5 means that peaks have a baseline between them.
R = 1.18(tR2-tR1)/(wh1+wh2) Equation 2.2.6
tR1 = retention time of peak 1.
tR2 = retention time of peak 2.
wh1 =peak width at half height of peak 1.
wh2 = peak width at half height of peak 2.
Column Efficiency.
Column efficiency enables us to account for the occurrence of broader peaks at longer retention times. Two main parameters can be used to express column efficiency:
Number of Theoretical Plates (N).
This is a simple relationship between the retention time of a peak and its width. This is a better parameter that could be used in comparing chromatographic columns.
N = 5.545(tR)2/(Wh)2 Equation 2.2.7
tR = retention time of peak.
Gas Chromatography-Mass Spectrometry Time of Flight (GC/TOFMS)
Height Equivalent to a Theoretical Plate (H).
This is a measure of efficiency that is independent of the total column height. If each theoretical plate is shorter, there is a greater number that can fit into a unit length of the column leading to a greater number of theoretical plates per meter.
H = L/N Equation 2.2.8 L = column length (mm)
2.3 Gas Chromatographic Instrumentation8.
A basic gas chromatographic system (Figure 2.1) is composed of the following components: Gas Supply and Flow Controllers.
Pressurized cylinders and gas generators are usually used to supply high purity gases. Pressure regulators and flow controllers control the flow and amount of gas delivered into the gas chromatograph.
Injector.
This is a hollow, metal cylinder containing a glass liner or insert. It introduces the sample into the open tubular column. The column is inserted into the bottom of the injector so that the column end resides inside of the glass liner. Samples are always introduced into the injector through a resealable septum using a small syringe. An injector is usually kept at a 100-3000C so that volatile components can be easily transformed into vapor. Injection techniques used in gas chromatography include:
Split Injection: A sample of 1ul is injected into the injection port followed by rapid vaporization. About 0.1-10% of the vapor enters the column and the rest of the vaporized sample and large flow of carrier gas are transported through a split or purge valve.
Splitless Injection: A sample of 1-5ul is injected into the heated injection port and it is vaporized. The vaporized sample is slowly carried on a cold column and after a few seconds,
Gas Chromatography-Mass Spectrometry Time of Flight (GC/TOFMS)
12
the split valve is opened so that any residual vapor at the injection port is taken out of the system.
Cold on-column Injection: The sample is injected directly on-column and it is vaporized. A special syringe is usually used with the needle made of silicone or steel and has a diameter of about 0.15mm. It is kept at a temperature of 40 C when it penetrates the column or pre-column before raising the temperature to normal operating temperatures.
Direct Vaporization injection: This is mostly used for injecting samples in packed columns. An important feature of this injector is that it has a metal tube with a glass sleeve or insert.
On-column Injection: The sample is introduced by inserting a precisely aligned needle into a capillary column and making injections inside the column.
Column and Oven.
The column is placed in the oven where the temperature is accurately controlled. The interior walls of the column are coated with a thin film of polymeric material called the stationary phase that affects the extent at which a compound is retained in the column. The retention of a compound in the column is affected by the length and diameter of the column, chemical structure and amount of the stationary phase and the column temperature. Two main types of columns are used in gas chromatography:
Packed Columns: These are made of stainless steel or glass, have diameters of 1.18 to 6.35mm and lengths ranging from 1 to 3m. The stationary phase is impregnated or bound on an inert and stable porous solid support made of spheres of approximately 0.2mm in diameter. Silanol groups are present on supports in packed columns.
Open Tubular Capillary Columns: These columns are usually smaller in diameter and longer in length (3 to 100m). The stationary phases used for these columns are polysiloxanes. The major types of open tubular columns include: wall-coated (WCOT), support-coated (SCOT) and porous-layer (PLOT). Among these types, the WCOT columns are mostly used.
Gas Chromatography-Mass Spectrometry Time of Flight (GC/TOFMS)
Detector.
There are various types of GC detectors and they usually operate by interacting with a physical or chemical property of the analyzed compound. This interaction leads to an electric signal that corresponds to the amount of compound in a sample.
Recording Devices.
In the past, these included strip chart recorders and integrators. Nowadays, computer data systems which usually vary in degree of complexity, features and price are used. They plot the size of the detector signal versus the time elapsed since sample introduction into injector. The plot yields a chromatogram that appears as a series of peaks.
Figure 2.1: Schematic digram of gas chromatograph.
2.4. Mass Spectrometry-Time of Flight.
This is an analytical technique that enables the determination of a compound in a sample based on mass-to- charge ratio (m/z) of charged particles. The technique uses electric and magnetic fields to measure the m/z of ions when they pass through10.
Gas Chromatography-Mass Spectrometry Time of Flight (GC/TOFMS)
14
2.5 Components of a Mass Spectrometer-Time of Flight. The basic components of the MS-TOF are:
Pumping Systems10.
These pumps are mainly used to establish vacuums for the mass spectrometer in two stages: a fore-pump leads to a drop in vacuum from 10-1 to 10-3 torr, and either an oil diffusion pump or turbomolecular pump drops the analyzer pressure from 10-5 to 10-7 torr.
Usually, the vacuum pressures are always measured by two types of gauges: a thermoconductivity gauge such as a Pirani gauge is used to measure the medium- level vacuum of the fore pump while a hot cathode gauge is used to measure high vacuums produced by oil diffusion or turbomolecular pumps.
The Interface to the Gas Chromatograph10.
The interface enables the transfer of sample from the GC into the source without the mixing of separated bands. It can be adapted as a separator so that the sample is concentrated to about 50-fold and reduces the source pressure by removing much of the carrier gas. A basic interface that is commonly used is a direct connection of the capillary column end into the sample inlet port on the ionized source.
The Ionization Chamber and Electron Source10.
Though a number of sources have been designed for sample ionization in mass spectrometers, only two sources are commonly used in GC/MS systems. These include:
Electron Impact (EI) Source: The sample leaving the GC interface is exposed to a
beam of 70-eV electrons from the filaments. As a result, the sample is ionized and could also fragment producing a fragmentation pattern that is characteristic of the ionized sample.
Chemical Ionization (CI) Source: The sample exiting the GC interface interacts with
ionization gas in the ionization chamber. Gases which are normally used to absorb the initial ionization electron include CH4, C4H10 and CO2. Usually, the collision process generates an
Gas Chromatography-Mass Spectrometry Time of Flight (GC/TOFMS)
uncharged gas molecule and a molecular ion with very little fragmentation. This ionization process occurs at a much lower energy than EI ionization.
Time of Flight (TOF) Analyzer12
All the ionized fragments leaving the source are accelerated into a field- free flight tube within a linear electric field. The movement of ions in this field leads to the generation of kinetic energy which is related to the velocity. As the velocity is inversely proportional to the square root of the mass to charge ratio of the ions, separation of ions occurs such that lighter ions travel faster through the acceleration and drift regions and reach the detector before the heavier ions.
The resolving power of this analyzer is dependent for a given uncertainty of time and square of mass to charge ratio. This mass resolving power can be improved by:
Increasing the flight time which is achieved by decreasing the acceleration voltages or using longer flight distance.
Decreasing the uncertainty of time.
There are several factors that have an effect on the time of flight. These include:
Spatial Spread: Difference in initial positions at which ions are formed.
Temporal Spread: Difference in time over which ions are formed.
Kinetic Energy Spread: Difference in initial velocity of the ions.
Angular Spread: Difference in direction of motion of ions.
In order to correct for dispersion in arrival time of ions at the detector due to differences in ionization positions, spatial focusing is employed. This involves the generation of ions in an electric field such that ions formed further from the detector would experience a force much longer so that they achieve higher velocities. This leads to time-focusing where ions of the same mass reach the detector at the same time.
Gas Chromatography-Mass Spectrometry Time of Flight (GC/TOFMS)
16
Also, the analyzer has a device called the reflectron which enables velocity focusing. This device is situated at the end of the drift region and it acts as a retarding field due to the presence of a series of lens plates with different voltages. Ions of the same mass with higher kinetic energy will penetrate more deeply into the retarding field and take more time to energize. As a result, they reach the detector at the same time with ions of lower kinetic energy.
Microchannel Plate Detector10.
This is an assembly of several point detectors that are connected to act as a single detector. Secondary electrons are produced on collision with the wall from electrons that cascade through individual electron multiplier. This results in signal amplification which is received by the data system.
Sample Preparation
3. Sample Preparation
3.1. Solid Phase Microextraction.
This technique, usually combined with GC uses an immobilized liquid phase (i.e. polydimethylsiloxane or polyacrylate polymers) as a stationary phase and enables the direct extraction of target organic substances from water by dipping the fiber into the aqueous sample or headspace11. Solid phase microextraction technique consists of two steps:
Adsorption of target compounds from the aqueous matrix by dipping the SPME fiber into the matrix or headspace.
Desorption of target compounds from the polymeric layer of the fiber into the carrier gas of the heated GC injector.
3.2. Theory of Solid Phase Microextraction11.
The principle of SPME is based on the partitioning of components between an aqueous sample and the polymeric film on the fiber. A simple mathematic model has been developed which relates a direct proportionality between the amount of component adsorbed on the polymeric film at equilibrium (infinite volume) and its concentration in the aqueous solution and is determined by the partition coefficient.
n= KfsVfCoVs/(KfsVf +Vs) Equation 3.2.1
n= number of moles of component adsorbed on polymeric film.
Kfs= partition coefficient of component between polymeric film and aqueous phase.
Vf = volume of the polymeric film.
Vs= volume of the aqueous phase.
Sample Preparation
18
Since Vs>>> KfsVf, the amount of component extracted on the polymeric film is:
n=KfsVfCo Equation 3.2.2
This implies that the amount of component adsorbed on the polymeric fiber is not dependent on the volume of the aqueous phase (Vs) but on the amount of component in the aqueous
phase (Co). After extracting the organic components, the fiber is transferred to the hot GC
injector where the components are thermally desorbed.
Since there is a linear relationship between the concentration of component in the sample and the amount adsorbed on the fiber, a linear GC detector response is obtained if adsorption conditions in the sample and desorption conditions at the GC injector are reproducible. In order to extract organic components from aqueous samples using SPME, two approaches are mainly used:
Headspace Sampling: This approach is mostly used for the extraction of volatile
compounds in aqueous samples and it is advantageous because of faster extraction times and improved selectivity. It mainly involves the exposure of the fiber above the liquid sample. Liquid Sampling: This approach is used for the extraction of semi-volatile compounds
from the aqueous matrix. In this approach, the fiber is completely immersed in the liquid sample.
Method Validation
4. Method Validation
14.
Method validation is the process of defining an analytical requirement, and confirming that the method under consideration has performance capabilities consistent with what the application requires.
Possible performance parameters that are usually evaluated in a method validation study include:
Accuracy: It is a measure of how close the measured value is to the true value. Usually,
accuracy is determined by three different ways:
Comparison to a reference material.
Analyte recovery.
Standard addition method.
Precision: It is defined as the degree of agreement among individual test values when
the procedure is applied repeatedly to multiple samplings of a homogenous sample. It is often expressed by standard deviation (SD) or relative standard deviation (RSD) According to the International Conference on Harmonization (ICH), precision is divided into:
Repeatability: It involves using the same conditions over a short period of time to measure precision of the method.
Intermediate precision: It is performed when the same method is applied many times in the same laboratory varying time of analysis and operator.
Reproducibility: It mainly examines the precision between laboratories and it is usually estimated in collaborative studies or method transfer experiments.
Linearity: It simply measures how well a calibration plot of response against
concentration approximates a straight line. The least square method is regularly used to determine the correlation coefficient which is a measure of the linearity of an analytical method. A linearity coefficient of 0.999 is considered acceptable for most analytical methods. However, this coefficient can be influenced by low and high concentration values. Another
Method Validation
20
method that is usually being used in determining linearity is by plotting the response factor (sensitivity) against the concentration. The response factor of each concentration is obtained as a quotient of the detector response by the analyte concentration.
Range: It is the lower and upper concentration for which a method has adequate
accuracy, precision and linearity.
Limit of Detection: It is the smallest amount of analyte that gives a measurable
response. Mathematically, it can be calculated as: LOD=3*Sy/x/b or LOD=3*σ
Sy/x and b are the residual standard deviation of the calibration curve and slope respectively
of the calibration curve.
Also, σ is the standard deviation of a series of measurements of the lowest concentration under repeatability conditions.
Also the limit of detection is based on a signal to noise ratio which is typically 2 or 3.
Limit of Quantification: It is the smallest amount of analyte that gives a response that
can be accurately quantified.
Mathematically, it can be calculated as:
LOD=10*Sy/x/b or LOD=10*σ
Sy/x and b are the residual standard deviation of the calibration curve and slope respectively
of the calibration curve.
Also, σ is the standard deviation of a series of measurements of the lowest concentration under repeatability conditions.
Experimental Procedure
5. Experimental Procedure.
5.1 Materials and Equipments.
Analytical Balance Mettler XS 204.
Agilent Technologies 6890N-Gas Chromatograph. Injector: Split/Splitless.
Column: HP 5 MS (30m x 0,25mm x 0,25um). PAL Combi SPME System Autosampler. MassLynx Software Version 4.1
Waters Micromass GCT Premier Mass Spectrometer. Analyzer: Oa –TOF.
Ion Source: Electronic Ionization (EI). Microchannel Plate Detector.
SPME fiber assembly:
100um Polydimethylsiloxane coating (Red). 85um Polyacrylate, Fused Silica (White).
50/30um DVB/Carboxen/PDMS Stable Flex (Gray). 65um Polydimethylsiloxane- Divinylbenzene (Blue). 75um Carboxen-PDMS (Black).
Vortex, MS 3 Digital, IKA
System for obtaining Ultrapure water: Ultrapore model Milli-Q® , Advantage A-10® , Millipore
Experimental Procedure
22
5.2 Reagent.
Methanol (CH3OH) - Merck KGaA (99.8%).
Ultrapure Water.
5.3 Samples.
Tap water from EPAL Laboratory.
Surface water(Tagus River) 5.4 Analytical Standards.
Table 5.1: Analytical Standards.
Standard % Purity Supplier
n-Butylacetate 99.5 CHEMSERVICE
o+p Xylene 99.5 CHEMSERVICE
m-Xylene 99.5 Dr.Ehrenstofer GmBH Styrene 99.5 CHEMSERVICE 1,3-Dichloroacetone NA CHEMSERVICE Cyclohexanone 99.5 CHEMSERVICE 5.5 Preparation of Solutions.
5.5.1 Preparation of Individual Standard Stock Solutions.
These solutions are prepared by weighing a certain mass of each standard into a 25-ml volumetric flask followed by dilution with methanol.
Experimental Procedure
Table 5.2: Concentration of individual standard stock solutions.
Compounds Concentration(mg/l) n-Butylacetate 8596 m- Xylene 16060 1,3- Dichloroacetone 20660 Styrene 9344 o-Xylene 26424 p-Xylene 12412 Cyclohexanone 29288
5.5.2 Preparation of Mixed Solutions.
Several mixed solutions are prepared by measuring a specific volume from the individual standard stock solutions into a volumetric flask followed by dilution with methanol. These mixed solutions are used for different purposes.
Preparation of Mixed Solution A.
It is prepared by measuring a certain volume (V1) of each individual standard stock
solution into a 10-ml volumetric flask followed by dilution with methanol. This solution would be used to pre-establish the chromatographic and SPME conditions using the 50/30um DVB/Carboxen/PDMS Stable Flex (Gray) fiber.
Table 5.3: Concentration of standards in Mixed Solution A
Compound V1(ml) Concentration(mg/l) n- Butylacetate 0.005 4.3 m-Xylene 0.003 4.8 1,3-Dichloroacetone 0.1 61 Styrene 0.005 4.7 o-Xylene 0.002 5.3 p-Xylene 0.004 5.0 Cyclohexanone 0.1 291
Experimental Procedure
24
Preparation of Mixed Solution B.
It is prepared by measuring a certain volume (V2) of each individual standard stock
solution into a 10-ml volumetric flask followed by dilution with methanol. This solution would be used for fiber optimization.
Table 5.4: Concentration of standards in Mixed Solution B.
Compound V2(ml) Concentration(mg/l) n- Butylacetate 0.5 430 m-Xylene 0.01 16 1,3-Dichloroacetone 4 8264 Styrene 0.01 9.3 o-Xylene 0.01 26 p-Xylene 0.01 12 Cyclohexanone 0.2 586
Preparation of Mixed Solution C.
It is prepared by measuring a certain volume (Vb) of Mixed Solution B into a 10-ml volumetric
flask followed by dilution with methanol. This solution would be used to prepare the calibration standards.
Table 5.5: Concentration of standards in Mixed Solution C
Compound Vb(ml) Concentration(mg/l) n- Butylacetate 0.4 17 m-Xylene 0.4 0.64 1,3-Dichloroacetone 0.4 330 Styrene 0.4 0.37 o-Xylene 0.4 1.0 p-Xylene 0.4 0.50 Cyclohexanone 0.4 23
Experimental Procedure
Preparation of Mixed Solutions for Precision Studies.
The mixed solutions for the repeatability and intermediate studies were carried out using two levels of concentration for each standard i.e. minimum and medium concentration
Table 5.6: Two levels of Concentration for Precision Studies.
Compound Min. Conc.(µg/l) Med. Conc. (µg/l)
n-Butylacetate 34 92 m-Xylene 1.3 3.4 1,3-Dichloroacetone 660 1432 Styrene 1.4 2.6 o-Xylene 2.1 5.6 p-Xylene 1.0 2.6 Cyclohexanone 234 453
5.6 Gas Chromatographic and Mass Spectrometric Conditions.
5.6.1 Equipment.
The equipment used for the analysis is an Agilent Technologies 6890N-Gas Chromatograph coupled to a Waters Micromass GCT Premier Oa -TOF Mass Spectrometer.
5.6.2 Gas Chromatographic Conditions. Mode of injection: Split mode.
Column dimensions: 30m x 0.25mm x 0.25um Software for data analysis: MassLynx 4.1 Carrier gas: Helium (purity 99.999%). Flow rate: 1ml/min.
Experimental Procedure
26
Temperature of injector: 200oc Desorption Time: 1min
5.6.3 Mass Spectrometric Conditions.
MCP Voltage:2600-2700 Electron Energy: 70eV Source Temperature:1800C Trap Current:178μA TOF Flight Tube: 4602V Reflectron Voltage: 1763 Push out Voltage: 981 Mass Range:50-250
GC Re-entrant Temperature: 2500 C Re-entrant Temperature: 1000 C
Discussion of Results
28
6. Discussion of Results
.
6.1 Optimization of Chromatographic Parameters.
All gas chromatographic parameters were optimized according to validated methods at the EPAL Central Laboratory.
Table 6.1 shows one of the temperature programs of the column oven that is routinely used at the laboratory for the analysis of volatile and semi-volatile components with an initial oven temperature of 400C at 1min.
Table 6.1: Column oven program used at EPAL Laboratory.
Temperature(0C) Rate(0C/min) Hold(min) Total(min)
50 2 4 9
70 4 2 7
250 10 10 28
The retention times and areas of the target compounds are obtained by injecting a certain concentration of each standard using a syringe followed by analysis with GC/TOFMS. Since electron ionization mode was used, identification of each compound was made by comparing the obtained fragmentation pattern at that retention time to spectral library stored in the NIST library search. Since several fragmented ions are produced for each compound, the ion mass of each spectrum that produced the largest area in full scan mode of each target compound was used for quantification.
Table 6.2 shows the retention times and the ion masses that are used for the quantification of each compound.
Discussion of Results
Table 6.2: Retention times and mass ions for target compounds.
Compound Retention Time(min) Ion Mass used for
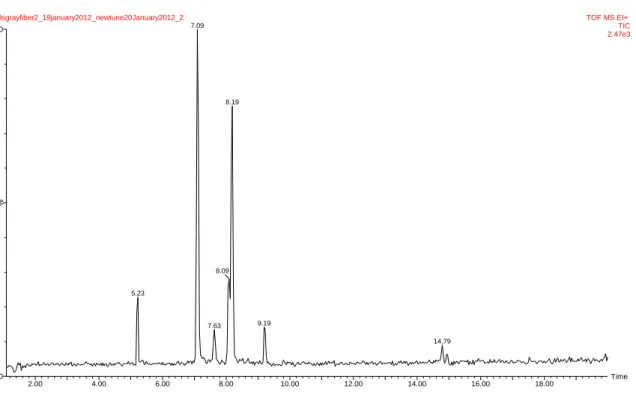
Quantification n-Butylacetate 5,23 56,06 m-Xylene 7,06 91,06 p-Xylene 7,09 91,06 1,3-Dichloroaectone 7,63 76,98 Styrene 8,09 78,05 o-Xylene 8,19 91,06 Cyclohexanone 9,19 98,07
6.1.1 Optimization of Column Oven Temperature Program.
Since all of the compounds are eluted within a very short period, it was necessary to adjust the column oven temperature program so that the analysis could be performed in a very short time. By injecting a mixed solution containing all components in equal concentration with a syringe, it was observed that there was co-elution between m-xylene and p- xylene and also between styrene and o-xylene. Several column oven temperature programs were tried so as to obtain good resolution between the compounds that co-eluted but all proved to be unsuccessful. As a result, the best option was selected based on the shortest length of time for the analysis (2omins). Table 6.3 is the column oven temperature program used for all the analysis with an initial oven temperature of 40 0C at 1min.
Table 6.3: Optimized column oven program for analysis.
Temperature(0C) Rate(0C/min) Hold(min) Total(min)
50 2 4 9
70 4 2 7
100 0 10 3
With this column oven temperature program, the identification and quantification of styrene and o-xylene were done using the ion masses of 78,05 and 91,06 respectively. However, since m-xylene and p-xylene could both be identified and quantified using 91,06, it was assumed
Discussion of Results
30
that the resulting peak and area was a combination of both compounds. This meant that the peak area at 7,09 min was the addition of the concentrations of m-xylene and p-xylene which was considered as m+p xylene. This column oven temperature program was now used for the optimization of SPME.
Figure 6.0 is a representation of the chromatogram obtained using the optimized column oven temperature program.
Figure 6.0: Chromatogram of target compounds. The peak at 7.09 is because of the co elution of
m+p Xylene.
6.2 Optimization of SPME Method.
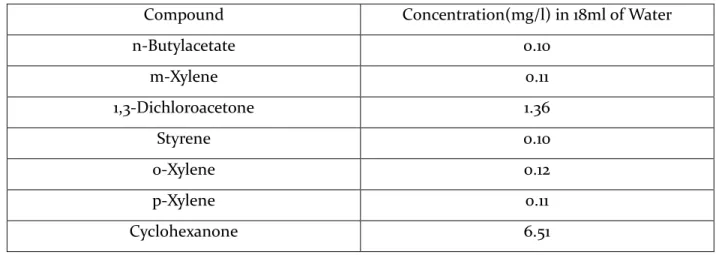
After investigating several mixed solutions containing different concentrations of the target compounds with the 50/30um DVB/Carboxen/PDMS Stable Flex (Gray) fiber, it was observed that 400ul of Mixed Solution A in 18ml of water (immersion mode for SPME) produced detectable peaks that are characteristic for all target compounds. Table 6.4 shows the concentrations used in the immersion mode for the optimization of the SPME method. Time 2.00 4.00 6.00 8.00 10.00 12.00 14.00 16.00 18.00 % 0 100
240sgrayfiber2_19january2012_newtune20January2012_2 TOF MS EI+ TIC 2.47e3 7.09 5.23 8.19 8.09 7.63 9.19 14.79
Discussion of Results
Table 6.4: Concentration of components in immersion mode (18ml water).
Compound Concentration(mg/l) in 18ml of Water
n-Butylacetate 0.10 m-Xylene 0.11 1,3-Dichloroacetone 1.36 Styrene 0.10 o-Xylene 0.12 p-Xylene 0.11 Cyclohexanone 6.51
6.2.1 Optimization of Split Ratio.
Since all target compounds were considered to be volatile, split injection mode was used for the analysis and several split ratios were investigated. Figure 6.1 shows the areas obtained for each compound at different split ratios.
Figure 6.1: Optimisation of split ratio using 50/30um DVB/Carboxen/PDMS Stable Flex (Gray)fiber.
It could be observed that a split ratio of 20 produced highest areas for most compounds. The usage of lower split ratios other 20 and Splitless injection produced broad peaks. A split ratio of 20 was chosen for further analysis since it produced thin peaks.
0 200 400 600 800 1000 1200 20 30 40 50 60
Discussion of Results
32
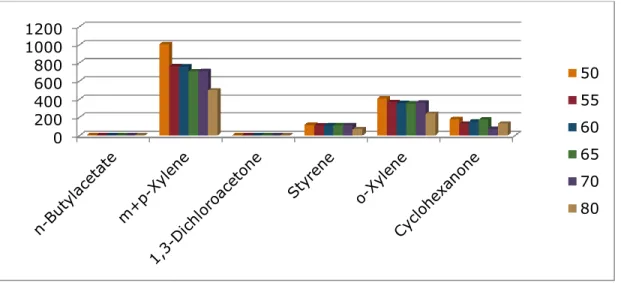
6.2.2 Optimization of Extraction Temperature.
With a split ratio of 20, several extraction temperatures were investigated. From Figure 6.2, it could be seen that an extraction temperature of 500C produced largest areas for most compounds.
Figure 6.2: Optimisation of extraction temperature using 50/30um DVB/Carboxen/PDMS Stable Flex
(Gray) fiber.
6.2.3 Optimization of Stirring Speed.
With a split ratio of 20 and an extraction temperature of 500C, three rotational speeds were investigated and Figure 6.3 shows that a speed of 500rpm produced highest areas for each compound. 0 200 400 600 800 1000 1200 50 55 60 65 70 80
Discussion of Results
Figure 6.3: Optimization of stirring speed using 50/30um DVB/Carboxen/PDMS Stable Flex (Gray)
fiber.
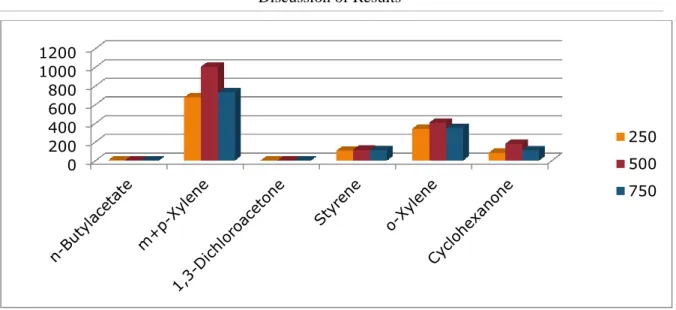
6.2.4 Optimization of Extraction Time.
With a split ratio of 20, extraction temperature of 500C and rotational speed of 500rpm, the areas of each compound were obtained at several extraction times. Figure 6.4 shows that 120seconds was the best extraction time for most compounds.
Figure 6.4: Optimisation of extraction time using 50/30um DVB/Carboxen/PDMS Stable Flex (Gray)
fiber. 0 200 400 600 800 1000 1200 250 500 750 0 200 400 600 800 1000 1200 1400 60 120 180 240 300 360 600 900
Discussion of Results
34
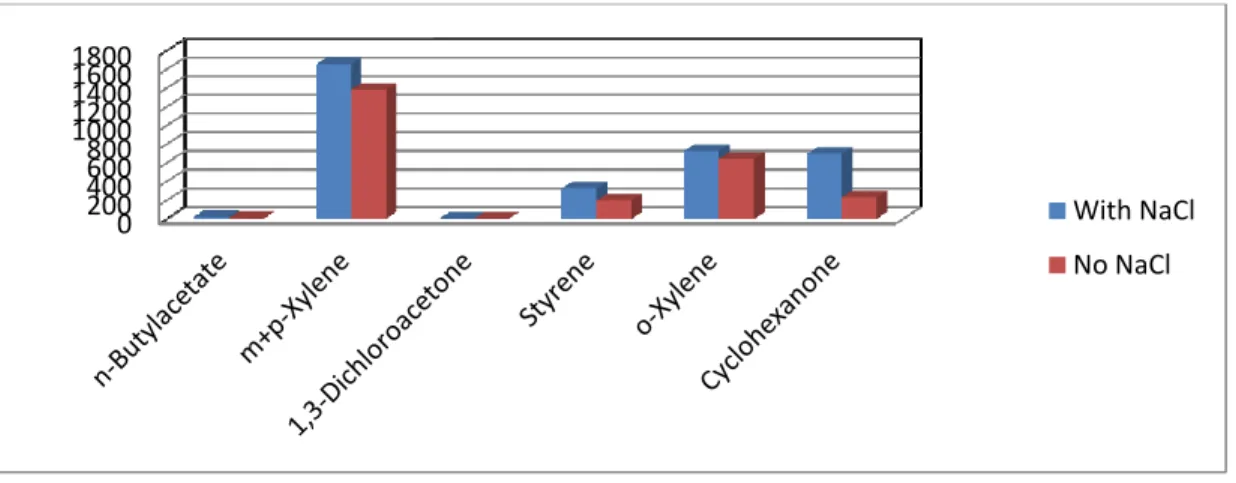
6.2.5 Effect of Sodium Chloride (Salting-out) on Extraction of Components.
With a split ratio of 20, extraction temperature of 500C, rotational speed of 500rpm and extraction time of 120seconds, all the compounds are extracted from a solution containing 5,4g of NaCl and the areas of the extracted components were compared to those of a solution with no NaCl (Figure 6.5). It was observed that though the addition NaCl increased the amount of extracted components; the effect was not so significant compared to when no NaCl is used. This implied that it was preferable to extract components without salting-out since there was not any significant difference in areas for all compounds with and without salting out.
Figure 6.5: Salting-out effect using 50/30um DVB/Carboxen/PDMS Stable Flex (Gray) fiber. It was decided that in order to optimize the SPME adsorption conditions for each fiber, a split ratio of 20 would be used and the rotational speed of the autosampler would kept constant at 500rpm because investigation of higher speeds could damage the fiber the SPME fiber assembly.
6.3 Optimization of Fibers for SPME.
In order to obtain the best fiber and its optimal conditions that could be used for validation studies, 400ul of Mixed Solution B was placed in 15ml of water and three SPME adsorption parameters (mode of extraction, temperature of extraction and extraction time) were optimized of all five fibers using a constant split ratio of 20 and rotational speed of 500rpm. Table 6.5 shows the concentration of each compound in the vial of 15ml of water.
0 200 400 600 800 1000 1200 1400 1600 1800 With NaCl No NaCl
Discussion of Results
Table 6.5: Concentration of standards in Headspace mode (15ml water).
Compound Concentration(mg/l) in 15ml of Water
n-Butylacetate 11.46 m-Xylene 0.43 1,3-Dichloroacetone 220.37 Styrene 0.25 o-Xylene 0.70 p-Xylene 0.33 Cyclohexanone 15.62
6.3.1 Optimization of 65um Polydimethylsiloxane-Divinylbenzene (Blue) Fiber.
This fiber is coated in a cross-linked form and it is bipolar in nature. It is mostly used for the extraction of polar volatiles and adsorption is the main principle of extraction7.
• Optimization of Mode of Extraction for 65um Polydimethylsiloxane-Divinylbenzene (Blue) Fiber.
Figure 6.6 is a comparison of the extraction efficiency at headspace and immersion mode. It was observed that the extraction efficiency for all compounds was higher when using headspace as compared to immersion mode.
Discussion of Results
36
Figure 6.6: Comparison of extraction efficiency at different extraction modes with 65um
Polydimethylsiloxane- Divinylbenzene (Blue) fiber.
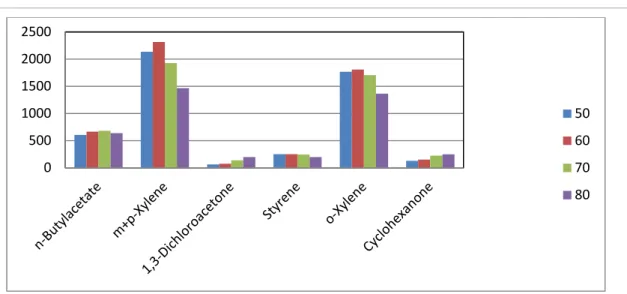
• Optimization of Temperature in Headspace Mode for 65um Polydimethylsiloxane-Divinylbenzene (Blue) Fiber.
With headspace mode, a comparison of the extraction efficiency is made at different temperatures (Figure 6.7). It was considered that 60 0C could provide better extraction efficiency than at other temperatures.
Figure 6.7: Comparison of extraction efficiency at different temperatures with 65um
Polydimethylsiloxane- Divinylbenzene (Blue) fiber.
0 500 1000 1500 2000 2500 3000 3500 4000 4500 5000 Headspace Full Vial 0 500 1000 1500 2000 2500 3000 3500 4000 4500 5000 50 60 70 80