M
ASTER IN
F
INANCE
M
ASTER
´
S
F
INAL
W
ORK
DISSERTATION
DO THE RESULTS OF
CANADIAN HOCKEY HAVE ANY
INFLUENCE IN SPORTS-RELATED COMPANY STOCKS?
CAROLINA ELISA FERNANDES GARCIA
M
ASTER IN
F
INANCE
DISSERTATION
DO
THE
RESULTS
OF
CANADIAN
HOCKEY
HAVE
ANY
INFLUENCE
IN
SPORTS-RELATED
COMPANY STOCKS?
CAROLINA ELISA FERNANDES GARCIA
S
UPERVISION:
P
ROFESSORP
EDROR
INOV
IEIRAiii
A
BSTRACTIce hockey is considered the main sport in Canada, hence moving a lot of money in the
country’s economy, more specifically in sport related companies. This empirical study’s
objective is to evaluate the impact that Canadian ice hockey outcomes has on the abnormal returns of sport-related company.
This was accomplished by using the event study methodology on 4 sport-related companies, quoted on the Canadian Stock Exchange, and four Canadian hockey team, playing in the National Hockey League (NHL), between 2005 and 2015 (the equivalent to 10 hockey seasons). The NHL is a professional ice hockey league composed by American and Canadian teams. Subsequently 3 different hypotheses were tested on the impact of the hockey results: Win and Loss; Many Goals and Less Goals; and “easy”
opponent and “hard” opponent.
The methodology used by this dissertation is the event study methodology, where abnormal returns (AR) and average abnormal returns (AAR) are calculated in order to conclude if there is evidence that sports results lead to abnormal returns.
iv
v
R
ESUMOO hóquei no gelo é considerado o desporto rei do Canadá, neste contexto, o hóquei faz mexer muito dinheiro na economia do país. Este estudo empírico tem como objetivo avaliar o impacto dos resultados desportivos do hóquei canadiano no valor de mercado das empresas relacionados com o desporto estudado.
Isto foi conseguido usando a metodologia de estudo de eventos (event studies) em 4 empresas relacionadas com desporto, cotadas na Bolsa Canadiana, e quatro equipas canadianas de hóquei no gelo, que jogam na Liga Nacional de Hóquei no Gelo (NHL), entre 2005 e 2015 (o equivalente a 10 temporadas de hóquei). Posteriormente foram testados seis diferentes testes de hipóteses do impacto que os resultados do hóquei têm nas empresas: vitória e derrota; muitos golos e poucos golos; e adversário “fácil” e
adversário “difícil”.
A metodologia usada nesta dissertação é a de estudos de eventos, onde são calculados os retornos anormais (AR) e os retornos anormais a fim de se concluir se existe evidência de que os resultados desportivos levam a retornos anormais.
Os resultados obtidos mostram que existem AR como resultado dos resultados desportivos do hóquei no gelo. O valor de mercado das empresas é positivamente afetado por uma vitória e negativamente por uma derrota. Adicionalmente, uma vitória por uma diferença de golos grande tem um efeito negativo, enquanto uma vitória por uma diferença de golos pequena tem um efeito positivo. Por fim, uma vitória contra um
oponente “difícil” ou “fácil” tem um impacto negativo ou positivo, respetivamente, nas
vi
Palavras-chave: Estudo de eventos, Finanças no hóquei no gelo, Liga Nacional de
TABLEOFCONTENTS
RESUMO ... V
LIST OF TABLES ... VIII
LIST OF ACRONYMS AND INITIALS ... X
1. INTRODUCTION ... - 1 -
2. LITERATURE REVIEW ... - 5 -
3. METHODOLOGY ... - 9 -
3.1. DATA ... - 9 -
3.2. ABNORMAL RETURN ... - 10 -
3.3. HYPOTHESIS TESTS ... - 12 -
4. RESULTS ... - 17 -
4.1 T-STUDENT ... -17-
4.2 SIGNTESTANDWILCOXONRANKTEST ... -26-
4.3 COMPARINGTOOTHERSTUDIES... -27-
5. CONCLUSION AND FUTURE RESEARCH ... - 28 -
REFERENCES ... - 31 -
APPENDIX 1 ... - 33 -
viii LIST OF TABLES
Table 1 - Critical Value of the Rejection Area… ... ………- 16 -
Table 2 AAR & TStudent (Win/Loss) ... 20
Table 3 AAR & TStudent (Win/Loss) by Hockey Team ... 21
Table 4 AAR & TStudent /Many/Less Goals) ... 22
Table 5 AAR & TStudent (Hard Opponent/ Easy Opponent) ... 24
Table 6 Summary of Impact on Stock Prices ... 25
Table 7 PValue Sign Test & Wilcoxon Rank Test ... 26
Table 8 AAR & TStudent (Many/Less) by Hockey Team ... 34
Table 9 AAR & TStudent (Win(many)/Loss(many)) by Hockey Team ... 34
Table 10 AAR & TStudent (Win(less)/Loss(less)) by Hockey Team ... 35
Table 11 AAR & TStudent (Opponent(hard)/(easy)) by Hockey Team... 35
Table 12 AAR & TStudent (Win(hard)/Loss(hard)) by Hockey Team ... 36
-ix LIST OF FIGURES
Figure 1 Histogram Abnormal Return Roger ... 13
Figure 2 Histograma Abnormal Return BCE ... 13
Figure 3 Histograma Abnormal Return BPF... 14
Figure 4 Histograma Abnormal Return BNS ... 14
Figure 5 Stock Prices TSX ... 17
Figure 6 Stock Prices Rogers ... 17
Figure 7 Stock Prices BCE ... 17
Figure 8 Stock Prices BNS ... 17
Figure 9 Stock Prices BPF ... 18
Figure 10 BNS Linear Regression ... 19
Figure 11 Roger Linear Regression ... 19
Figure 12 BCE Linear Regression ... 19
-x LIST OF ACRONYMS AND INITIALS
AAR - Average Abnormal Return
AIM - Alternative Investment Market
AR - Abnormal Return
ARCH - AutoRegressive Conditional Heteroskedasticity
BCE - Bell Canada Enterprises
BPF - Boston Pizza
BNS - Bank of Nova Scotia
CAPM - Capital Asset Pricing Model
CAAR - Cumulative Average Abnormal Returns
E - Edmonton Oilers
“easy” - Appendix 1
GARCH - Generalized AutoRegressive Conditional Heteroskedasticity
“hard” - Appendix 1
H0 - Null Hypothesis
H1 - Alternative Hypothesis
xi
NBA - National Basketball Association
MC - Montreal Canadians
NHL - National Hockey League
OLS - Ordinary Least-Square market model
Roger - Rogers Communication Inc.
TML - Toronto Maple Leafs
TSX - Canadian Stock Exchange
US - United States
- 1 -
1.
INTRODUCTION
Ice hockey is the official national sport and the most popular game in Canada. It is the country with most players (721 thousand), spending around US$120 million annually on players and hockey operations (The Canadian Encyclopedia). The Canadian economy has over US$11 billion related to hockey (Sportsnet). Hence, the second and third most valuable teams in the National Hockey League (NHL) - the premier ice hockey league are from Canada, namely the Montreal Canadians (MC) and the Toronto Maple Leafs (TML) - are worth US$1.18 billion and US$1.15 billion, respectively. NHL is composed by 30 ice hockey teams, in which 23 are from the United States and 7 from Canada. The current value of the top twelve NHL teams ranges from US$455 million to US$1.2 billion in which four out of twelve are Canadian hockey teams (Abeza et al.). Moreover, the operating income of the five largest Canadian teams is between US$17.2 million and US$91.3 million (Statista).
Canadians account for 50% of all players in the NHL. The teams that won the most NHL Cups between 1915 to 2016 were Canadian teams (1st Montreal Canadians, 2nd Toronto Maple Leafs and 6th Edmonton Oilers).
- 2 -
Majority of the NHL’s revenue (80%) was generated from local (non-shared) sources
such as tickets, luxury seating, advertising and television in 2014/2015, where the average ticket price was US$62.18.
On average Canadian people spend 7 hours per week watching Television or talking about hockey during the season. In 2015, the average viewing of NHL games on TV reached to 5.6 million people. Canadians believe that hockey is “part of their cultural
fabric” and it is considered almost as a religion in Canada.
Generally, investors buy stocks to make money by investing in companies that they believe will have a positive return, applying the opportunity cost, depending on the risk they want to take. However, in the case of ice hockey there is a certain irrationality behind it. To invest in NHL teams, specifically Canadian hockey teams, one has to buy stocks from companies largely attached to NHL teams, since there are no Canadian teams quoted in the Canadian Stock market. Four of those companies are Rogers Communication Inc. (Roger), Bank of Nova Scotia (BNS), Bell Canada Enterprises (BCE) and Boston Pizza (BPF). These companies are chosen for the impact they have in the Canadian economy. Rogers is considered the most highly levered company to the
NHL’s success and BCE is the largest telecommunication company in Canada. BPF, the
- 3 -
Divulging further into this, we are using 4 companies quoted on the Canadian stock exchange and 4 top Canadian hockey teams playing in the NHL between 2005 and 2015 (10 hockey seasons). The conclusion reached was that there is a relationship between the outcomes of the sporting event and the market value of sport-related companies,
more specific, “good” outcomes have a positive impact on stock prices and “bad”
outcomes have a negative impact on the stock prices. Moreover, the number of goals a team wins or loses and the opponent the team plays against with also impacts the stock performance of the companies. These results are in line with the conclusions reached by Scholtens & Peenstra (2009) and Brown & Hartzell (2001)
So, the objective of this dissertation is to try to answer to the following questions:
1. What is the impact of the hockey outcomes on the stock prices of the companies?
2. Is the impact on the stock prices due to games against “stronger” opponents
similar to the games against “weaker” opponents?
3. Is the impact on the stock prices due to games with result difference equal or higher than three similar to games with result difference less than three?
4. Is there asymmetry between the abnormal returns of the different sporting outcomes?
- 4 -
- 5 -
2.
LITERATURE REVIEW
What do we know about the influence of ice hockey on Canadian sport-related companies? Until now and to my best knowledge there are no studies about the topic, however there are related literatures that concerns with other sports, mainly soccer, or other variables which influence stock performances (Samagaio et al, 2009).
The purpose of the study leads us to the question, “Are the markets efficient to new information in the case of ice hockey outcome?” The first literature about market efficiencty and event studt originates from Fama et al. (1969), which tries to study how price adjust to new information, as a consequence of a stock split. The conclusion reached by the author was that the stock prices adjust very fast to new information, thereby making the market considerably efficient.
Renneboog & Vanbrabant (2000) had as their aim was to investigate if share prices of English soccer clubs listed on the London Stock Exchange (LSE) and on the Alternative Investment Market (AIM) are affected by the team’s performance between 1995 and 1998. Using event study methodology, they found out that there is a positive abnormal return (AR) of around 1% in the first trading day after a victory, while after a loss or tie there is a negative abnormal return of 2.5% and 0.6%, respectively. These authors did not find any different reactions in stock returns between games in the Premier League and games in the European Championships.
- 6 -
Association (NBA) and the impact it caused on their stock returns. The authors found that stock prices are directly affected by the team performance, however there is an asymmetry on the reaction between wins and losses. Furthermore, in the regular-season game performances have smaller impact in stock prices than playoff games. Besides, they also got to the conclusion that game performances have a higher impact in trading volume and volatility during the basketball season.
Scholtens & Peenstra (2009) also studied if there is an effect on the abnormal return of stock returns caused by soccer matches performances. 1274 matches of eight teams in the national and European competition during 2000-2004 were analyzed. The countries studied were England, Portugal, Scotland, Turkey, Italy, Germany, Holland and Denmark. The fact that the study was made with international teams and not only with teams from the same country is an innovation. The conclusion reached is in line with the one of Brown & Hartzell (2001), there is a significant and positive reaction in the stock market for victories and negative for defeats, being the effect of a defeat stronger than that of a victory. Additionally, Renneboog & Vanbrabant (2000) found evidence for a stronger impact on the stock prices when playing in the European competition comparing to when playing in the national competition.
- 7 -
fact that trading volume is higher at the end of the season. The novelty was the introduction of a variable that explains the sporting success, as it was considered more important for a victory near to the end of the Championship than a victory to the beginning of the Championship.
Betting markets co-exist with stock markets for professional soccer clubs listed on the Stock Exchange Market. Palomino, Renneboog & Zhang (2005) study the stock market reactions of this two markets. The study was around 16 teams during the period between 1999 to 2002. The authors argued that there was no impact on the stock prices after the odd release by bookmakers, but the opposite happened after sporting results. Moreover, the odds can be used to predict short-run stock prices.
Stadtmann (2003) argued that only the expectation error should influence stock prices. He applied the news model to the football industry to analyze, whether new information regarding the sporting succeed could explain subsequent changes in the stock price of the soccer team Borussia Dortmund. In this study 97 games were examined during 2000 to 2002. Additionally, it was proved that there is a direct link between the team success in a game and changes in stock returns.
- 8 -
- 9 -
3.
METHODOLOGY
3.1.DATA
The study developed in this dissertation follow an event study methodology. This assesses the impact of a specific event on a company’s market value, in a particular time period. Brown & Werner (1980, 1985) gave detailed explanation about this methodology.
The first step of the event study methodology is to define the parameters. The companies selected to assess this study are somehow linked to sport. These companies quoted on the Canadian Stock Exchange (TSX), are Rogers Communication Inc., BCE Inc., Boston Pizza and Bank of Nova Scotia. Rogers is levered to the NHL results; BCE transmits all hockey games; BNS has a credit card partnership with the NHL; and BPF belongs to one of the most visited restaurants in Canada. Due to the strong relation to the sport hockey, these companies have been selected to analyze if the sporting results of the Canadian hockey teams affect the market value of the selected companies. Ice hockey in Canada is worth over US$11 billion annually.
- 10 -
occurs is defined as “day 0”. In the time period chosen there are 10.468 hockey games
(Brown & Hartzell, 2001) and the estimation period used as a robustness check was the whole sample. The sporting results were taken from www.hockey-reference.com.
The event window chosen was the next trading day of the Canadian Stock Exchange, a day after a game (Scholtens & Peenstra, 2009). For the purpose of this study, the only important analysis is the impact that a single game has on the market value of the companies. Therefore, the event window cannot be longer than one day, due to an overlap of information which may lead to contaminated results (Dyckman et al., 1984; Glascock et al., 1991).
3.2.ABNORMAL RETURN
To measure the impact of the sporting results, the abnormal returns were calculated. The abnormal return is the difference between the observed return and the expected return of the stock price k on day t (Brown & Warner, 1983). Define:
(1)
With the observed return as:
(2) (
)
Where, is the stock price k at day t adjusted, already includes the dividend, and
- 11 -
For this study, the market model was chosen to calculate the expected return, following Brown & Warner (1980 and 1985); Beaver (1981); Dyckman et al. (1984), under a wide variety of conditions and a well-specified model. The index used as a proxy was the TSX, the Canadian stock exchange market, one of the largest stock exchange markets in the world (8th largest by market capitalization) with around 1500 companies listed on the stock market. The model is defined as:
(3)
Where is the market return of the index at day t; are estimated using the ordinary least-square (OLS) market method during the estimation period; and is the error term.
Brown & Werner (1980 and 1985) and Mackinlay (1997) explained that other models can be used when calculating the abnormal return, like the mean adjusted return, the market adjusted return and the capital asset pricing model (CAPM). Thus, in this study we will only focus on the OLS market model, since it takes into accounts the market
and firm conditions and relates it to the company’s shares. Moreover, “there is no
evidence that a more complicated methodology” has better outcomes than the market model, and some papers actually reach to the conclusion that complicated methodologies can lead to worse results (Brown & Werner, 1980). Therefore, since majority of researchers use the market model and is not considered a complicated model, it is the one used in this dissertation.
The abnormal return is defined as:
- 12 -
The next step is the aggregation of the abnormal returns, so that a more general conclusion on the impact on the stock prices due to sporting results can be taken (Fama e al., 1969); MacKinlay, 1997; Serra, 2002). This aggregation is important when dealing with multiple events (MacKinlay, 1997), and was made in two components, by result and by company.The aggregation process starts by joining the abnormal returns by the final game outcome (win or loss), calculating an arithmetic mean, where N is the number of observations of an outcome. The average abnormal return (AAR) is defined as:
(5) ∑ ( ), with r=1,2 where 1 - Win and 2 - Loss.
3.3.HYPOTHESIS TESTS
Parametric and non-parametric tests are used to test the outcomes of the average
abnormal return and analyze if there is an impact on the company’s stock prices owed to
sporting results. The t-test is used as a parametric test (Mackinlay, 1997). The null hypothesis (H0) is defined as the outcomes having no impact on the stock price of the company, which means that the average abnormal return of the stocks on the day after a game is equal to zero. The hypothesis test assumes that the abnormal return is normal distributed:
( ( )) with ( )
The t-test is defined as:
(6)
- 13 -
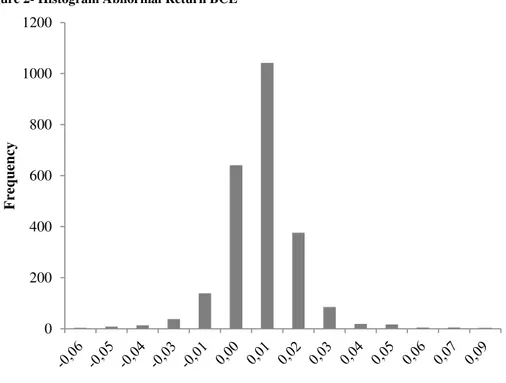
Looking at the abnormal returns of the four sport-related company it can be concluded that the majority of the sample is normal distributed. This can be seen in the Histogram of the abnormal returns of each company (see Figure 1 to 4).
Figure 1 - Histogram Abnormal Return Roger
Figure 2- Histogram Abnormal Return BCE 0
50 100 150 200 250 300 350 400
-0,06-0,05-0,04-0,03-0,02-0,01-0,01 0,00 0,01 0,02 0,03 0,04 0,04 0,05
F
re
qu
ency
0 200 400 600 800 1000 1200
F
re
qu
- 14 -
Figure 3 - Histogram Abnormal Return BPF
Figure 4 - Histogram Abnormal Return BNS
Roger, BCE and BPF are clearly following a normal distribution, while BNS has a sample that is more uniformly distributed.
0 100 200 300 400 500 600 700 800
F
re
qu
ency
0 5 10 15 20 25 30 35 40 45
-0,010 -0,007 -0,005 -0,002 0,000 0,003 0,005 0,008
F
re
qu
- 15 -
Company shares do not follow a normal distribution; therefore, non-parametric tests have an important role in the event study methodology. When analyzing abnormal returns on a single day, it is proofed that non-parametric tests have better results than parametric tests (Kolari & Pynnonen, 2011). Thus, two non-parametric tests will be used, the sign test and the Wilcoxon test. The need to make non-parametric test relates to the fact that if the assumption of normality of abnormal returns is violated, the parametric tests are not well specified. Non-parametric tests are considered a more powerful and well-specified tests than the parametric tests, as they better detect a false null hypothesis of no abnormal returns (Serra, 2002).
The sign test is a simple binomial test, which examines if the frequency of abnormal, positive or negative, return is equal to 50%. This test takes into consideration the evidence of skewness in abnormal returns (Serra, 2002). Hence, the null hypothesis is defined as the probability of the frequency being positive or negative is equal to 50% (p=0.5) and the alternative hypothesis is defined as p>0.5, in case of a victory, or p<0.5 in case of a loss. We are dealing with a large sample, so the test statistic gets very near to the normal standard distribution, following the limit theorem.
- 16 -
defined as the median being equal to zero ( ) and the alternative hypothesis is defined as the median being different from zero ( ).
The critical value for the rejection region for the three tests, are presented below:
Tabela 1 - Critical Value of the Rejection Area
T-Value Unilateral Bilateral
2.326 1.0% 2.0%
1.960 2.5% 5.0%
1.645 5.0% 10.0%
In the conclusions presented on section 4, we will use the unilateral region, as the purpose of this study as to test if the abnormal returns of the day after a victory game is higher or equal to zero and the day after a losing game is lower or equal to zero.
Finally, when analyzing the hockey outcomes we have to take into account two things.
Firstly, investors do not see a win or a loss against a “strong” opponent the same way as
a win or loss against a “weak” opponent. In the point of view of an investor a win
against a “strong” opponent has a positive impact on the investor’s mood, while a loss
against a “weak” opponent has a negative impact. Consequently, the impact on investors
- 17 -
4.
RESULTS
4.1T-STUDENT
The stock prices used in this dissertation to analyze the investor reaction relatively to the sporting outcomes, was taken from Bloomberg with a time period between 5th of September 2005 and 25th of April 2015 (10 hockey seasons). Analyzing this time range it can be seen that there was an abrupt descending tendency from 2007 to 2008, followed by a growing tendency until the end of the time period. This tendency can be seen in the Canadian Stock Prices, as well as, in the stock prices of the four Canadian related-sport companies (Figures 5 to 9).
Source: Bloomberg
Figure 5 - Stock Prices Rogers
Source: Bloomberg
Figure 7 - Stock Prices BNS
Source: Bloomberg
Source: Bloomberg
- 18 -
The financial crisis of 2007 to 2009 was the main reason for the descending trend seen in all stock prices on that period. The bankruptcy of Lehman Brother, one of the biggest investment bank in the world, almost led to the collapse of the world financial system. The bursting of the U.S housing bubble turned a crisis into the worst recession seen in the last 80 years. However, the Canadian economy recovered fast reaching the same market values as the pre-crisis values.
Following the methodology described in the previous section, the outcomes of the NHL games were taken from www.hockey-reference.com where all four teams participated, (10.468 game outcomes during 10 hockey seasons).
Firstly, the linear regressions of the four teams are presented below:
Source: Bloomberg
- 19 -
From the four figures above, we can see that there is a linear relationship between the returns of the TSX and the sport-related companies.
In Table 2 are the average abnormal returns of the day after a hockey game of the four sport-related companies. -0,15 -0,1 -0,05 0 0,05 0,1 0,15
-0,2 -0,15 -0,1 -0,05 0 0,05 0,1 0,15
-0,15 -0,1 -0,05 0 0,05 0,1 0,15
-0,15 -0,1 -0,05 0 0,05 0,1 0,15
Figure 10 - BNS Linear Regression Figure 11 - Roger Linear Regression
-0,15 -0,1 -0,05 0 0,05 0,1 0,15
-0,3 -0,2 -0,1 0 0,1 0,2
-0,15 -0,1 -0,05 0 0,05 0,1 0,15
-0,5 -0,4 -0,3 -0,2 -0,1 0 0,1 0,2
- 20 -
Table 2 - AAR & T-Student (Win/Loss)
AAR(%) t-Student AAR(%) t-Student AAR(%) t-Student AAR(%) t-Student
Win 0.005% 0.279 0.008% 0.528 0.0241% 1.37* -0.0104% -0.908
Loss -0.0003% -0.017 -0.0393% -1.70** 0.0263% 1.35* -0.0113% -1.011
Roger BCE BPF BNS
*,** represents the level of significance of 5% and 10%
Roger Communication Inc. (Roger); Bell Canada Enterprises (BCE); Boston Pizza (BPF); Bank of Nova Scotia (BNS)
From table 2 it can be said that on average a win has a positive impact in the value of the companies Roger, BCE and BPF, while the stock prices of the company BNS react on average negatively to a win. In case of loss, it has a negative impact in all market value of the companies, except for BPF. The effect of a loss is higher comparing to the effect of a win in the stock prices. With the t-Student test, BCE and BPF are statistically significant in a loss, while the remaining outcomes of the other companies are not, besides the win outcome of the company BPF.
The company that is more affected by the sporting outcomes is BPF (0.024%). This outcome can be a consequence of a more direct linkage between restaurant and the sporting results comparing to other sectors like telecommunication or bank. Generally, the public watch games in restaurants without knowing the outcome of the game, therefore the restaurant is often profitable whenever there is a game regardless of a loss or a win. In table 2 this result can be seen, showing that both win and loss have a positive impact on the company value as people consume drinks/ food independently of the outcome.
- 21 -
company is the owner of some of Toronto’s professional sports franchises. This effect
can be observed in table 2 where the company value of Roger is affected by 0.005% if the sporting outcome is a win, while BCE is affected by 0.008%. The same effect can be seen when the outcome is a loss.
Table 3 are the average abnormal returns of the day after a hockey game, divided by teams.
Table 3 - AAR & T-Student (Win/Loss) by Hockey Team
AAR(%) t-Student AAR(%) t-Student AAR(%) t-Student AAR(%) t-Student
Win 0.0111% 0.400 0.0865% 2.82** 0.0807% 2.76** 0.0336% 1.219
Less 0.0757% 2.68** -0.0187% -0.692 -0.0604% -2.14** -0.0345% -1.29*
AAR(%) t-Student AAR(%) t-Student AAR(%) t-Student AAR(%) t-Student
Win -0.0202% -1.071 -0.0027% -0.151 -0.0232% -1.29* -0.0236% -1.32*
Loss -0.0289% -1.75** -0.0261% -1.52* -0.0869% -4.51** -0.0292% -1.76**
AAR(%) t-Student AAR(%) t-Student AAR(%) t-Student AAR(%) t-Student
Win 0.0285% 1.064 -0.0668% -2.63** -0.1457% -5.92** 0.0546% 2.43**
Loss -0.0583% -2.59** -0.0417% -1.68** 0.0396% 0.956 -0.0685% -2.62**
AAR(%) t-Student AAR(%) t-Student AAR(%) t-Student AAR(%) t-Student
Win 0.0305% 0.967 0.2185% 6.91** -0.0455% -1.63* 0.0022% 0.089
Loss 0.0358% 1.31* -0.0528% -1.94** 0.1502% 4.70** -0.0761% -2.49**
Roger
BNS
Edmonton Montreal Toronto Vancouver Edmonton Montreal Toronto Vancouver
BPF
Edmonton Montreal Toronto Vancouver
BCE
Edmonton Montreal Toronto Vancouver
*,** represents the level of significance of 5% and 10%
Roger Communication Inc. (Roger); Bell Canada Enterprises (BCE); Boston Pizza (BPF); Bank of Nova Scotia (BNS)
- 22 -
Canadians and this is owed to three main reasons: a) the Montreal Canadian ice hockey team is worth more (US$1.18); b) the team has won more NHL Cups from 1915 to 2016; c) and the team has more fans.
Other tests were made, beside seeing if a win or a loss has an impact on the stock prices of the four companies. Table 4 describes the impact the number of goals has on an investor and if the number of goals in a win/loss has a higher/lower effect on the investors reaction.
Table 4 - AAR & T-Student /Many/Less Goals)
AAR(%) t-Student AAR(%) t-Student AAR(%) t-Student AAR(%) t-Student Many -0.0139% -1.94** -0.0310% -4.81** 0.0203% 2.19*** 0.0079% 1.49* Less 0.0085% 0.738 -0.0045% -0.430 0.0069% 0.640 -0.0105% -1.53* Win (many) -0.0029% -0.917 -0.0065% -1.85** -0.0011% -0.336 0.0112% 3.44*** Loss (many) 0.0001% 0.045 -0.0049% -3.18** 0.0032% 1.61* -0.0018% -1.40* Win (less) 0.0411% 3.07** -0.0158% -1.116 0.0244% 1.74** -0.0168% -1.88** Loss (less) 0.0076% 0.96* -0.0012% -0.216 -0.0013% -0.207 -0.0054% -1.279
Roger BCE BPF BNS
*,** represents the level of significance of 5% and 10%
Roger Communication Inc. (Roger); Bell Canada Enterprises (BCE); Boston Pizza (BPF); Bank of Nova Scotia (BNS)
- 23 -
amount of goals has a positive reaction on Rogers and a negative reaction on the other three teams. All companies are statistically significant when talking about wins by a small amount of goals.
BPF has an interesting result: if there is a win and the goal difference is more than three there is a negative impact on the company value, while a loss affects the company positively. The inverse happens to the company value when there is a win with goals difference of less than 3. The company value increases with a loss by many goals or by a win but with less goals, which can be translated to that people tend to stay longer in the restaurant after a losing a game by many goals or after a winning game (with a goals difference less than 3 goals).
BNS is the official sponsor of the NHL however, it is not much affected by the sporting results. A possible reason for this can be the crisis of 2007 to 2009, which is included in the time period chosen for this study. All the bad publicity that the bank had during the crisis, due to some bankruptcies that occurred all over the world, lead to an uncertainty and distrust relatively to the banking sector. Therefore, investors are highly risk averse when dealing with this specific sector, even when it is strongly linked to ice hockey.
- 24 -
result of Roger having the total rights of broadcast of NHL games and people are incline to watch the game commentaries since fans tend to feel that the outcome is unfair when they lose by less goals compared to losing for many goals.
Finally, the opponent was also taken in consideration. It was tested if a “hard”/”easy” opponent has an impact on the value of the companies and if the investors react differently if a team wins/ losses against a “hard”/”easy” opponent (Table 5).
Table 5 - AAR & T-Student (Hard Opponent/ Easy Opponent)
AAR(%) t-Student AAR(%) t-Student AAR(%) t-Student AAR(%) t-Student Opponent (hard) 0.0051% 0.559 -0.0106% -1.41* 0.0140% 1.59* -0.0054% -0.948 Opponent (easy) 0.0054% 0.550 -0.0066% -0.673 0.0051% 0.496 -0.0096% -1.61* Win(hard) 0.0047% 1.133 -0.0035% -0.867 0.0017% 0.378 -0.0025% -0.843 Loss(hard) 0.0000% 0.598 -0.0046% -1.166 0.0012% 0.287 -0.0037% -1.195 Win (easy) 0.0118% 1.67** -0.0059% -0.684 0.0058% 0.854 0.0007% 0.139 Loss(easy) 0.0109% 1.32* -0.0057% -1.027 0.0020% 0.276 -0.0091% -2.07**
Roger BCE BPF BNS
*,** represents the level of significance of 5% and 10%
Roger Communication Inc. (Roger); Bell Canada Enterprises (BCE); Boston Pizza (BPF); Bank of Nova Scotia (BNS)
The results obtained in this study are in majority not statistically significant, therefore it cannot be said that these outcomes reflect the characteristic of the impact of a winning or losing game has on stock prices. However, five results are statistically significant,
which we can conclude that a game against a “hard” opponent affects negatively the
stock prices of BCE, while a game against a “easy” opponent has also a negatively
effect on the stock prices of BNS.
On the other hand, the AAR of winning a game against a “hard” opponent has a positive
effect on the stock price of BPF and a negative effect on the ones from the other three
companies. While a loss against a “hard” opponent has no effect on the market value of
- 25 -
a “easy” opponent, while BNS reacts negatively in both cases. BCE has an asymmetric
reaction, where in case of a win it reacts positively, and in case of a loss negatively.
The overall results show that the company values are less affected by a win/ loss against a hard opponent than by an easy opponent, hence when a team is playing against a hard opponent it is easier to guess the outcome; therefore a smaller reaction. The only company that is more affected by the outcome against an “easy” opponent is Rogers, being indifferent to a win or a loss as it reacts positively to both outcomes.
Table 6 summarized the effects of all tests described above.
Table 6 - Summary of Impact on Stock Prices
Roger BCE BPF BNS
Win + + +
-Loss - - +
-Many - - + +
Less + - +
-Win (many) - - - +
Loss (many) + - +
-Win (less) + + +
-Loss (less) + - -
-Opponent (hard) + - +
-Opponent (easy) + - +
-Win(hard) - + -
-Loss(hard) = = = =
Win (easy) + + +
-Loss(easy) + - +
-*Not all results were statistically significant
Roger Communication Inc. (Roger); Bell Canada Enterprises (BCE); Boston Pizza (BPF); Bank of Nova Scotia (BNS)
- 26 -
compared to “normal” restaurants, being a sport chain a good choice for watching
hockey games (The Economist and Chron). The exact opposite happens to BNS, it is more negatively affected by the game results than positively, due to the banking sector as the bankruptcy of the Lehman Brothers in 2008 gained aa great deal of uncertainty and distrust by part of the general public. Therefore, people are not keen to invest in the banking sector, even when the bank has a linkage to sports.
4.2 SIGN TEST AND WILCOXON RANK TEST
In Table 7 we have the p-value, of the same tests made for the T-Student, of the Sign test and the Wilcoxon Rank test.
Table 7 - P-Value Sign Test & Wilcoxon Rank Test
Sign Test Wilcoxon Sign Test Wilcoxon Sign Test Wilcoxon Sign Test Wilcoxon
Win 0.612 0.529 0.949 0.960 0.057** 0.063** 0.439 0.557
Loss 0.675 0.683 0.525 0.570 0.254 0.288 0.604 0.452
Many 0.759 0.7285 0.024** 0.021** 0.307 0.263 0.838 0.789 Less 0.221 0.189* 0.9377 0.9107 0.072** 0.089** 0.774 0.961
Win (many) 0.685 0.618 0.155* 0.128* 0.685 0.614 0.155* 0.128* Loss (many) 0.8644 0.8010 0.001** 0.001** 0.016** 0.013** 0.016** 0.013**
Win (less) 0.400 0.351 0.471 0.456 0.471 0.439 0.631 0.623 Loss (less) 0.051** 0.050** 1.000 0.942 0.171* 0.170* 0.770 0.743
Opponent (hard) 0.426 0.413 0.504 0.476 0.239 0.215 0.975 0.895 Opponent (easy) 0.534 0.451 1.000 0.876 0.090** 0.122* 0.778 0.954
Win(hard) 0.646 0.581 0.927 0.855 0.646 0.583 0.783 0.707 Loss(hard) 0.171* 0.173* 0.528 0.479 0.141* 0.130* 0.207 0.180*
Win (easy) 0.889 0.812 0.328 0.308 0.485 0.447 0.209 0.194* Loss(easy) 0.128* 0.117* 0.589 0.566 0.184* 0.177* 0.085** 0.078**
Roger BCE BPF BNS
*,** represents the level of significance of 5% and 10%
Roger Communication Inc. (Roger); Bell Canada Enterprises (BCE); Boston Pizza (BPF); Bank of Nova Scotia (BNS)
- 27 -
statistically significant and the Wilcoxon on the other hand is not, this is not a problem to be considered in this dissertation. A game lost with many goals suffered, has a negative impact of 0,49% on the stock prices, while a win has a positive impact (2,41%) on the sport-related company BPF. The non-parametric tests reach the same conclusions as the parametric test, however the non-parametric test show that there are more results reflecting characteristic of the population.
4.3 COMPARING TO OTHER STUDIES
The conclusions achieved for the companies Roger and BCE are in line with the Studies mentioned on Section 2 – Literature Review. Like Renneboog & Vanbrabant (2000) there are asymmetric reactions between a win outcome and a lose outcome, as it can be seen in the AAR of both companies. There is a positive abnormal return around 0.01% in the first trading day after a victory in BCE, while after a loss there is a negative abnormal return of -0.04%. The effect of a defeat is stronger than that of a victory, like it was concluded in the study of Scholtens & Peenstra (2009).
- 28 -
5.
CONCLUSION AND FUTURE RESEARCH
The main objective of the present dissertation is to analyze if the outcomes of the Canadian hockey games have an impact on the stock prices of four sport-related
companies. In almost every “king” sport of a country, money is a key factor, therefore
winning or losing does affect the cash flow of the team and can affect the market value. In order to figure out if there is an impact caused by the investor mood, influenced by the outcome of the supporting team, the event study methodology was used. The average abnormal return (AAR) of the quoted day after a game were calculated for 10.468 hockey games (10 hockey seasons) from four Canadian hockey teams, between 5th September 2005 to 25th Abril 2015. Furthermore, it was tested if the average abnormal return were equal to 0, using one parametric test, t-test, and two non-parametric, the sign test and the Wilcoxon rank test.
Considering the results obtained and answering to the 1st question, it can be concluded that the market value of the companies is positively affected by a victory and negatively by a defeat.
Additionally, the answer to the 2nd question of this research is on one hand a win against
a “hard” opponent negatively affects the stock price, while a loss doesn’t have any
- 29 -
The answer to the 3rd question made in this dissertation is that a win with a large amount of goals difference negatively affects the company value, while a win by less amount of goals affects negatively the company value.
When comparing the results obtained in this dissertation with previous studies, it seems to agree with the conclusion reached by other author like Brown & Hartzell (2001) and Scholtens & Peenstra (2009), where they conclude that the sporting outcome does affect the stock price of the company, as well as there is an asymmetry between wins and losses. The difference in results from this study to previous studies made, can be due to the fact that some of them where analyzing Basketball teams in the case of Brown & Hartzell (2001) and football teams in the case of Scholtens & Peenstra (2007), and this dissertation only focus on hockey teams.
When the stock prices “fully reflect” the available information in the market it is
considered that the market is efficient. In this dissertation it has been concluded that stocks do reflect a small adjustment due to sporting results of ice hockey.
The time period chosen for this study takes into account the financial crisis of 2007 to 2009, which resulted in large economic instability. This could lead to some outliers and create some friction in the abnormal returns. Therefore, the power of the tests conducted can be inferior, since it takes into account the crisis. Hence, this study has 10.468 observations, leading to a more precise outcome, than other studies made before.
sports-- 30 sports--
related companies. This should be taken into account since the national team is normally considered of higher importance than the Canadian hockey teams in general.
Additionally, it can be taken into consideration other factors from the game, like quality of the game, shots on goal, and others and see if it has an impact on the stock prices of the companies.
Likewise, it can be taken into consideration to separate the sample into two: (i) after the financial crisis and (ii) before the financial crisis. This would investigate different results due to the crisis and it would also conclude if the crisis effect does not exist. This can be a way to remove the crisis effect of the results obtained.
- 31 - REFERENCES
Chron. Taken from Small Business: http://smallbusiness.chron.com/types-economic-factors-can-affect-fast-food-industry-36923.html
Abeza, G., Bellefleur, J., Dottori, M., Fleming, K., La, K., Lewis, S., . . . Szucs, B. (2015). The Economic Impact of Hockey in Canada.
Brown, G., & Hartzell, J. (2001). Market reaction to public information: the atypical case of the Boston Celtics. Journal of Financial Economics, 60, 333-370.
Brown, S., & Warner, J. (1980). Measuring Security Price Performance. Journal of Financial Economics, 8, 205-58.
Brown, S., & Warner, J. (1985). Using daily stock returns: the case of event studies. Journal of Financial Economics, 14, 3-31.
Duque, J., & Ferreira, N. (2005). Explaining share price performance of football clubs listed on the Euronext Lisbon. Instituto Superior de Economia e Gestão, Working Paper Nr.1.
Dyckman, T., Philbrick, D., & Stephan, J. (1984). A Comparison of Event Study Methdologies Using Daily Stock Returns: A Simulation Approach. Journal of Accounting Research, Vol.22 .
Edmands, A., García, D., & Norli, O. (2007). Sports Sentiments and Stock Returns. Journal of Finance, Vol. LXII, nr.4.
Fama, E. F., Fisher, L., Jensen, M. C., & Roll, R. (1969). The Adjustment of Stock Prices to New Information. International Economic Review, 10: 1-21.
Forbes. Taken from The Business of Hockey : http://www.forbes.com/nhl-valuations/ Kolari, J. W., & Pynnonen, S. (2011). Nonparametric rank tests for event studies.
- 32 -
MacKinlay, C. A. (1997). Event Studies in Economics and Finance. Journal of Economic Literature, 35: 13-39.
Palomino, F., Renneboog, L., & Zhang, C. (2005). Stock price reactions to short-lived public information: the case of betting odds, . ECGI, Tilburg University, Economic Research Working Paper nr.62.
Renneboog, L., & Vanbrabant, P. (2000). Share price reactions to sporty performance of soccer listed on the London Stock Exchange and the AIM. Tilburg University, Economic Research Working Paper nr.19.
Samagaio, A., Couto, E., & Caiado, J. (2009). Sporting, financial and stock market performance in English football: an empirical analysis of structural relationships. CEMAPRE Working papers, nº06/2009, ISEG Technical University of Lisbon. Scholtens, B., & Peenstra, W. (2009). Scoring on the stock exchange? The effect of
football matches on stock market returns: an event study. Applied Economics, nr.41, 3231-3237.
Serra, A. P. (2002). Event study test: a brief survey. Working paper da FEP, nr.117. Sportsnet. Taken from
http://www.sportsnet.ca/hockey/nhl/study-canadian-hockey-worth-11b-annually/
Stadtmann, G. (2006). Frequent news and pure signals: evidence of a publicly trade football club. Scottish Journal of Political Economy, 53, 485-504.
Statista. Taken from de https://www.statista.com/topics/960/national-hockey-league/
The Canadian Encyclopedia. Ice Hockey taken from
- 33 - APPENDIX 1
The “hard” opponents are:
Arizona Coyotes
Winnipeg Jets
Buffalo Sabes
Toronto Maple Leafs
Boston Bruins
Tampa Bay Lightning
Edmonton Oilers
New York Islanders
Detroit Red Wings
Anaheim Ducks
Dallas Star
Colombus Blue Jacket
Chicago Blackhawks
Vancouver Canucks
Nashville Predators
The “easy” opponents are the other hockey teams on the NHL that were not mentioned
- 34 - APPENDIX 2
Table 8 - AAR & T-Student (Many/Less) by Hockey Team
AAR(%) t-Student AAR(%) t-Student AAR(%) t-Student AAR(%) t-Student
Many -0.110% -4.29*** -0.162% -5.97*** -0.117% -4.43*** 0.135% 7.17*** Less 0.076% 2.67*** 0.063% 2.15*** 0.024% 0.814 -0.028% -0.927
AAR(%) t-Student AAR(%) t-Student AAR(%) t-Student AAR(%) t-Student
Many -0.009% -0.508 0.077% 4.24*** 0.025% 1.48* 0.036% 2.47*** Less -0.028% -1.61** -0.027% -1.529 -0.074% -3.91*** -0.041% -2.19***
AAR(%) t-Student AAR(%) t-Student AAR(%) t-Student AAR(%) t-Student
Many -0.229% -9.74*** -0.120% -6.04*** -0.035% -1.50* -0.120% -5.44*** Less 0.010% 0.411 -0.046% -1.77** -0.044% -1.185 0.008% 0.312
AAR(%) t-Student AAR(%) t-Student AAR(%) t-Student AAR(%) t-Student
Many -0.0925% -3.19*** 0.2948% 8.85*** 0.1620% 5.09*** -0.0137% -0.578 Less 0.0544% 1.87** 0.0582% 2.01*** 0.0457% 1.53* -0.0479% -1.61*
BPF
Edmonton Montreal Toronto Vancouver
BCE
Edmonton Montreal Toronto Vancouver
BNS
Edmonton Montreal Toronto Vancouver
Roger
Edmonton Montreal Toronto Vancouver
Table 9 - AAR & T-Student (Win(many)/Loss(many)) by Hockey Team
AAR(%) t-Student AAR(%) t-Student AAR(%) t-Student AAR(%) t-Student
Win (many) -0.1025% -5.83*** -0.0590% -7.08*** -0.0035% -0.409 0.0979% 10.19*** Loss (many) -0.0012% -0.158 0.0054% 0.979 -0.0107% -2.32*** 0.0067% 1.46**
AAR(%) t-Student AAR(%) t-Student AAR(%) t-Student AAR(%) t-Student
Win (many) 0.0637% 5.65*** 0.0654% 10.40*** -0.0152% -1.45* 0.0678% 7.88*** Loss (many) -0.0119% -2.13*** 0.0004% 0.105 -0.0089% -2.50*** -0.0088% -2.38***
AAR(%) t-Student AAR(%) t-Student AAR(%) t-Student AAR(%) t-Student
Win (many) -0.1002% -5.96*** -0.0042% -0.628 0.0393% 3.09*** -0.0407% -3.03*** Loss (many) -0.0212% -3.17*** -0.0187% -4.47*** -0.0195% -5.15*** -0.0189% -3.76***
AAR(%) t-Student AAR(%) t-Student AAR(%) t-Student AAR(%) t-Student
Win (many) -0.0537% -3.94*** 0.0164% 2.84*** 0.0412% 3.39*** -0.0213% -1.89** Loss (many) -0.0064% -0.613 0.0277% 5.44*** 0.0197% 3.75*** 0.0098% 2.02***
BPF
Edmonton Montreal Toronto Vancouver
BCE
Edmonton Montreal Toronto Vancouver
BNS
Edmonton Montreal Toronto Vancouver
Roger
- 35 -
Table 10 - AAR & T-Student (Win(less)/Loss(less)) by Hockey Team
AAR(%) t-Student AAR(%) t-Student AAR(%) t-Student AAR(%) t-Student
Win (less) 0.1340% 3.09*** 0.2646% 8.89*** 0.2597% 9.51*** 0.0204% 0.765 Loss (less) 0.0541% 2.42*** 0.0525% 3.42*** 0.0279% 1.65** -0.0133% -0.709
AAR(%) t-Student AAR(%) t-Student AAR(%) t-Student AAR(%) t-Student
Win (less) -0.1210% -4.08*** 0.0480% 2.45*** -0.0987% -5.83*** -0.0828% -3.94*** Loss (less) -0.0083% -0.658 -0.0149% -1.63* -0.0429% -4.84*** -0.0213% -2.17***
AAR(%) t-Student AAR(%) t-Student AAR(%) t-Student AAR(%) t-Student
Win (less) 0.1810% 4.33*** -0.2271% -6.92*** -0.1479% -5.05*** -0.0667% -2.43*** Loss (less) -0.0196% -1.115 -0.0208% -1.85** 0.0203% 1.74** 0.0030% 0.244
AAR(%) t-Student AAR(%) t-Student AAR(%) t-Student AAR(%) t-Student
Win (less) 0.1402% 2.73*** 0.0564% 2.11*** 0.001502 5.12*** 0.0431% 1.36* Loss (less) 0.0314% 1.54* -0.0145% -0.985 -0.0003 -2.11*** -0.0083% -0.575
BPF
Edmonton Montreal Toronto Vancouver
BCE
Edmonton Montreal Toronto Vancouver
BNS
Edmonton Montreal Toronto Vancouver
Roger
Edmonton Montreal Toronto Vancouver
Table 11 - AAR & T-Student (Opponent(hard)/(easy)) by Hockey Team
AAR(%) t-Student AAR(%) t-Student AAR(%) t-Student AAR(%) t-Student
Opponent (hard) -0.0019% -0.068 0.0292% 1.028959667 0.1178% 3.98*** -0.0494% -1.78** Opponent (easy) 0.0829% 2.92*** 0.0406% 1.38* -0.0691% -2.45*** 0.0334% 1.159
AAR(%) t-Student AAR(%) t-Student AAR(%) t-Student AAR(%) t-Student
Opponent (hard) 0.0101% 0.578 0.0726% 3.99*** -0.1758% -10.20*** -0.0210% -1.116 Opponent (easy) -0.0480% -2.74*** -0.0848% -5.00*** 0.0128% 0.653 -0.0349% -2.02***
AAR(%) t-Student AAR(%) t-Student AAR(%) t-Student AAR(%) t-Student
Opponent (hard) 0.0047% 0.203 -0.0030% -0.136 -0.1212% -4.89*** -0.0599% -2.57*** Opponent (easy) -0.0417% -1.66** -0.0968% -3.57*** 0.0062% 0.154 0.0258% 0.952
AAR(%) t-Student AAR(%) t-Student AAR(%) t-Student AAR(%) t-Student
Opponent (hard) -0.0227% -0.752 0.1109% 4.16*** 0.0242% 0.856 0.0925% 3.43*** Opponent (easy) 0.0696% 2.45*** 0.0675% 2.12*** 0.0880% 2.81*** -0.1465% -4.82***
BPF
Edmonton Montreal Toronto Vancouver
BCE
Edmonton Montreal Toronto Vancouver
BNS
Edmonton Montreal Toronto Vancouver
Roger
- 36 -
Table 12 - AAR & T-Student (Win(hard)/Loss(hard)) by Hockey Team
AAR(%) t-Student AAR(%) t-Student AAR(%) t-Student AAR(%) t-Student
Win(hard) -0.0118% -0.831 0.0488% 4.27*** 0.0177% 1.73** 0.0140% 1.056 Loss(hard) 0.0063% 0.335 0.0607% 4.55*** 0.0258% 1.75** -0.0414% -2.92***
AAR(%) t-Student AAR(%) t-Student AAR(%) t-Student AAR(%) t-Student
Win(hard) -0.0060% -0.564 0.0178% 2.13*** -0.0234% -3.41*** -0.0311% -3.27*** Loss(hard) 0.0102% 0.936 0.0235% 2.53*** -0.0553% -7.39*** -0.0372% -4.77***
AAR(%) t-Student AAR(%) t-Student AAR(%) t-Student AAR(%) t-Student
Win(hard) 0.0205% 1.67** -0.0262% -2.15*** -0.0073% -0.670 -0.0359% -2.66*** Loss(hard) -0.0100% -0.647 -0.0192% -1.90** -0.0321% -3.31*** -0.0129% -1.29*
AAR(%) t-Student AAR(%) t-Student AAR(%) t-Student AAR(%) t-Student
Win(hard) -0.0012% -0.062 -0.0109% -1.45* 0.0018% 0.154 0.0363% 2.59*** Loss(hard) -0.0136% -0.756 -0.0101% -0.787 0.0299% 2.97*** 0.0134% 1.29*
BPF
Edmonton Montreal Toronto Vancouver
BCE
Edmonton Montreal Toronto Vancouver
BNS
Edmonton Montreal Toronto Vancouver
Roger
Edmonton Montreal Toronto Vancouver
Table 131- AAR & T-Student (Win(easy)/Loss(easy)) by Hockey Team
AAR(%) t-Student AAR(%) t-Student AAR(%) t-Student AAR(%) t-Student
Win (easy) 0,0232% 0,956 0,0068% 0,598 0,0870% 5,72*** 0,0278% 2,66*** Loss(easy) 0,0681% 3,29*** 0,0317% 2,02*** -0,0024% -0,173 0,0315% 1,67**
AAR(%) t-Student AAR(%) t-Student AAR(%) t-Student AAR(%) t-Student
Win (easy) -0,0060% -0,564 0,0178% 2,13*** -0,0234% -3,41*** -0,0311% -3,27*** Loss(easy) 0,0102% 0,936 0,0235% 2,53*** -0,0553% -7,39*** -0,0372% -4,77***
AAR(%) t-Student AAR(%) t-Student AAR(%) t-Student AAR(%) t-Student
Win (easy) 0,0088% 0,363 -0,0363% -2,91*** -0,0371% -2,15*** -0,0021% -0,170 Loss(easy) -0,0473% -2,96*** -0,0438% -3,90*** 0,0332% 3,14*** -0,0108% -0,837
AAR(%) t-Student AAR(%) t-Student AAR(%) t-Student AAR(%) t-Student
Win (easy) 0,0326% 1,30* 0,0306% 2,55*** 0,0764% 4,66*** -0,0286% -2,01*** Loss(easy) 0,0489% 2,41*** 0,0310% 2,07*** -0,0441% -3,02*** -0,0111% -0,720
BPF
Edmonton Montreal Toronto Vancouver
BCE
Edmonton Montreal Toronto Vancouver
BNS
Edmonton Montreal Toronto Vancouver
Roge r