UNIVERSIDADE DE LISBOA
FACULDADE DE CIÊNCIAS
DEPARTAMENTO DE INFORMÁTICA
Modeling CNS receptor binding profiles of small
molecules
Mestrado em Bioinformática e Biologia Computacional
Especialização em Biologia Computacional
Vânia Alexandra Conceição Ferreira
Dissertação orientada por:
Prof. Dr. André Osório e Cruz de Azerêdo Falcão
I
Acknowledgements
This work wouldn’t be possible without the support of all the people who had accompanied me during this journey.
First of all, I would like to thank my thesis advisor, Dr. André Osório e Cruz de Azerêdo Falcão, for having accepted me and guided me along this year.
The most special thank you to my parents who made this dream possible. Thank you for all your unconditional support and love.
To my sister, thank you for always trusting me, for listen me and for all your support. A special thank you to João Cruz for supporting all my decisions, for believing me so much and for all the love.
To all my friends, thank you for being always there for me, for listen my concerns, for your advices and for never stop believing me. A special thank you to Débora and Inês for being the best friends anyone could wish.
To all my family, thank you for your continuous love and support.
To my academic family, I would like to thank you for being always there for me. These years wouldn’t be the same without you and neither would I.
To my master colleagues, thank you for sharing with me this experience, for the exchange of ideas and for all the relaxing moments too.
To all my professors who had accompanied me during this time, thank you for your dedication and for all the knowledge and experience you have shared with us. A special thank you to Dr.ª Mónica Silva for her guidance and advices whenever I need them and thank you for having introduced me to bioinformatics for the first time.
Thank you to Fundação para a Ciência e Tecnologia (FCT) for funding this project. Thank you to LaSIGE for having hosted me during this year.
III
Resumo
A identificação de novos compostos ativos, passíveis de serem aplicados no tratamento de doenças, é a principal preocupação da indústria farmacêutica, que se foca em encontrar compostos de atuação altamente específica, evitando assim a existência de efeitos secundários. Contudo, este processo nem sempre é fácil, pois tem sido comprovado que muitas moléculas têm como alvo mais do que um recetor. Estas são moléculas promiscuas que ao se ligarem a diferentes recetores podem levar ao surgimento de efeitos inesperados. Este problema recebe o nome de polifarmacologia e muitos estudos têm sido desenvolvidos no seu âmbito.
Na primeira parte deste trabalho, tentou-se estabelecer uma relação entre os perfis de ligação de moléculas a diferentes recetores e a sua relação com a semelhança entre as sequências proteicas dos mesmos. Verificou-se que não existe um padrão constante e que, na maioria dos casos, as moléculas apresentam perfis de ligação diferentes, mesmo para recetores muito semelhantes. Este resultado mostrou que a polifarmacologia é, de facto, um problema complexo e que é necessário investir em diferentes tipos de informação para prever perfis de ligação e evitar o surgimento de efeitos secundários indesejados.
Para prever todos os efeitos resultantes da atuação de uma molécula, é necessário ter um conhecimento prévio acerca das interações entre esta e os recetores, conhecer os tipos de ligações e também as suas forças. Uma forma de obter este conhecimento passa por experiências laboratoriais, no entanto, estes são processos muito dispendiosos e que consomem muito tempo.
Uma forma mais acessível de abordar esta questão foi criando modelos computacionais capazes de prever possíveis interações entre moléculas e recetores com o objetivo de identificar moléculas alvo para a realização dos ensaios experimentais, aumentando assim a probabilidade de sucesso.
Muitos destes modelos computacionais são baseados em métodos de aprendizagem automática, abordagens muito comuns em informática. Estes métodos baseiam-se num processo de aprendizagem de entidades, tendo como fundamento as suas caraterísticas já conhecidas, para criar um modelo capaz de classificar novas entidades. O sucesso destas técnicas tem sido comprovado em
IV
vários contextos da bioinformática e são uma aposta promissora na predição de interações entre moléculas e recetores.
Com este trabalho, pretendeu-se utilizar uma abordagem de aprendizagem automática para desenvolver um modelo de predição de interações entre moléculas e recetores, tendo por base as semelhanças estruturais entre as moléculas e os seus respetivos níveis de atividade, já conhecidos, para recetores de serotonina e dopamina.
O interesse nestas duas famílias de recetores recai no facto de fazerem parte da superfamília de recetores acoplados à proteína G, uma das mais importantes presentes no Sistema Nervoso Central. Para além disso, é conhecido o envolvimento de recetores de serotonina e dopamina em doenças neurológicas, como a doença de Parkinson e o Distúrbio de Défice de Atenção e Hiperatividade. Assim, surge a necessidade de identificar, para estes recetores, moléculas candidatas a serem utilizadas como ponto de partida para o desenvolvimento de novos fármacos, a serem aplicados no tratamento de algumas destas doenças neurológicas.
Como técnica de aprendizagem automática, optou-se pela utilização de um classificador de Naive Bayes, um método de aprendizagem supervisionada baseado no Teorema de Bayes e que tem como pressuposto a independência entre as características que classificam uma entidade.
Para obter a semelhança estrutural entre as moléculas foi utilizado o NAMS (Non-contiguous Atom Matching Structural Similarity), um método que identifica o alinhamento ótimo entre os átomos de duas moléculas tendo em conta, não só os seus perfis topológicos, mas também os próprios átomos e as características das ligações entre os mesmos.
Para a concretização deste trabalho foi obtida informação acerca de moléculas com ligações, já identificadas, a recetores de serotonina e dopamina, tendo estes dados sido recolhidos com base em informação presente no ChEMBL. Adicionalmente, foram também recolhidos os valores de bioatividade de cada molécula para cada recetor, sobre a forma de Kis, as constantes de inibição que
quantificam as forças de interação entre as moléculas e os recetores em estudo. No decorrer deste trabalho, foram construídos três modelos de predição de interações molécula-recetor. Estes incluíram informação relativa a semelhanças estruturais entre moléculas e os seus níveis de bioatividade, perfis de ligação de
V
moléculas para com diferentes recetores e uma combinação de toda a informação anterior.
O primeiro modelo de predição foi construído tendo em conta apenas a informação relativa a semelhanças estruturais entre as moléculas e os seus níveis de atividade. Para isso, foram identificadas, para cada recetor, moléculas kernel, isto é, moléculas muito ativas e estruturalmente distintas das restantes, com as quais as moléculas em teste são comparadas. Tendo por base as suas semelhanças estruturais a cada molécula kernel, as probabilidades de ligação a cada recetor são então calculadas. Apesar deste modelo ter demonstrado resultados promissores durante o processo de validação, uma elevada taxa de falsos negativos mostrou que se trata de um modelo conservador e que deve ser aplicado quando se pretendem resultados mais precisos.
O segundo modelo foi construído de modo a verificar se a informação relativa ao comportamento de ligação de uma molécula para com outros recetores pode ser relevante na predição da sua interação com novos recetores. Para isso, foram tidas em conta apenas as moléculas comuns entre recetores e os seus níveis de bioatividade. Com esta informação, foram construídas duas bases de dados contendo as probabilidades usadas aquando do cálculo das probabilidades de interação entre as moléculas em teste e os recetores. Durante o processo de validação, este modelo evidenciou melhores resultados do que o primeiro modelo. Contudo, estes foram considerados como devidos a uma sobrerrepresentação de moléculas ativas nos dados recolhidos. No entanto, não querendo descartar a informação proveniente de outros recetores, os dois modelos foram integrados para construir o terceiro modelo.
O terceiro modelo, integrando informação relativa a semelhanças estruturais entre moléculas, os seus níveis de bioatividade e informação relativa a outros recetores, foi o que demostrou melhores resultados, atingindo o maior nível de acuidade. Para além disso, foi também o modelo que mostrou um maior equilíbrio entre as proporções de falsos positivos e falsos negativos. Consequentemente, este modelo mostrou ser a melhor opção na identificação de potenciais interações entre um conjunto de moléculas e recetores de serotonina e dopamina.
Numa tentativa de aumentar o desempenho dos modelos propostos, tentou-se identificar, para cada recetor, um valor de probabilidade mais preciso a partir do
VI
qual uma molécula deveria ser classificada como ativa. No entanto, apesar de aumentar a especificidade e precisão dos modelos propostos, este ajustamento não conduziu a um melhor desempenho.
Em conjunto, os resultados obtidos mostraram que o classificador de Naive Bayes é um método passível de ser utilizado na construção de modelos de predição de interações entre moléculas e recetores. Também a ferramenta NAMS demostrou um bom desempenho durante a comparação estrutural de moléculas, o que se tornou evidente pelos resultados obtidos durante o processo de validação dos modelos. Adicionalmente, verificou-se que a utilização da semelhança estrutural entre moléculas em conjunto com os seus níveis de bioatividade é uma abordagem promissora na identificação de moléculas candidatas a validação experimental. A nível global, verificámos que a integração de informação de diferentes tipos continua a ser a melhor alternativa na previsão de perfis de ligação entre moléculas e recetores. Para além disso, comprovámos, mais uma vez, que os métodos de aprendizagem automática são uma forma eficiente e pouco dispendiosa de selecionar novos compostos candidatos para validação in vitro.
Palavras-chave: Polifarmacologia; aprendizagem automática; Classificador de Naive Bayes; Recetores acoplados à proteína G; NAMS
VII
Abstract
Pharmaceutical industry has been focused on finding highly selective single-target drugs. However, different studies have been showing that this is not always possible since many molecules can bind to more than one receptor. These molecules are described as promiscuous compounds and their polypharmacological behavior has been case of many studies.
In the first part of our work, we have investigated the relationship between molecules binding profiles and the sequence similarity of their target receptors. We have found different patterns but no evident relationship was identified since many molecules present different binding patterns for different receptors, even when they are very closed. These results show the level of complexity inherent to pharmacology and the importance of finding new methods to predict molecules binding profiles.
When binding to different receptors, a drug can led to unpredictable side-effects which is a limitation in case of disease treatment.
To avoid side-effects it is import to get knowledge on molecules’ binding profiles. With this purpose, different approaches have been developed to predict interactions between molecules and receptors. Many of these approaches rely on the use of machine learning techniques to predict drug-target interactions. These techniques have been widely used in informatics and have already shown their contribute to bioinformatics.
In this work, we have used a machine learning method to predict interactions between molecules and serotonin and dopamine receptors, two of the most important families of receptors present in the Central Nervous System.
To construct our model, we have used the Naïve Bayes classifier, which is a supervised learning method based on applying Bayes’ Theorem with the assumption of conditional independence between features.
We have developed three different models that include co-activity data between receptors, molecular similarity and a combination of these two. Despite the three models have presented promising results, the model integrating all the data has shown to be the one with the best performance.
VIII
Our results have demonstrated that Naïve Bayes is an efficient method to drug-target interactions prediction. Moreover, it was demonstrated that structural similarity between compounds together with their bioactivity levels is a promising approach to identify candidate molecules for further in vitro validation.
Keywords: Polypharmacology; Machine learning; Naïve Bayes classifier; G-protein coupled receptors; NAMS
IX
Table of Contents
List of Figures ...XI List of Tables ... XIII
1. Introduction ... 1
1.1 Polypharmacology: Drug Discovery for the Future ... 1
1.2 Objectives ... 2
1.3 Overview ... 3
2. Concepts and State of The Art ... 5
2.1 Drug Interactions with Receptors ... 5
2.1.1 Quantifying Binding Activities ... 6
2.2 Serotonin Receptors ... 7
2.3 Dopamine Receptors ...11
2.4 Data Mining and Machine Learning ...12
2.4.1 Naïve Bayes Classifier ...13
2.5 Molecular Similarity ...14
2.5.1 NAMS ...15
2.6 Related Work ...15
3. Material and Methods ...19
3.1 Tools ...19
3.2 Data Collection and Processing...19
3.3 Evolutionary Analysis ...20
3.4 Molecular Similarity ...21
3.5 The Probabilistic Model ...21
3.5.1 Receptors Database ...21
3.5.2 Kernels Selection ...22
3.5.3 Kernels Database ...22
3.5.4 Algorithm Implementation ...23
3.5.4.1 Molecular Similarity vs Bioactivity Levels ...23
3.5.4.2 Integrating Receptors Information ...25
3.5.4.3 Receptors Role during Classification Process ...27
3.5.5 Classification Process ...27
3.6 Validation ...28
X
4. Results and Discussion ...29
4.1 Data Analysis ...29
4.2 Evolutionary Analysis ...32
4.3 Kernels Selection ...35
4.4 Validation Results ...37
4.4.1 Models Performances ...38
4.4.2 Comparing Models Performances...40
4.4.3 Impact of Classification Threshold in Models Performance ...42
5. Conclusions and Future Perspectives ...47
6. References ...49
XI
List of Figures
Figure 2.1: Regulation of the activity of a receptor with conformation-selective drugs. The ordinate is the activity of the receptor produced by Ra, the active receptor conformation (e.g., stimulation of adenylyl cyclase by a β adrenergic receptor) while the coordinate represents the concentration of drug L present at the receptor. Taken
from Goodman et al. (2011).. ... 6
Figure 2.2: Summary of changes in 5-HT receptor nomenclature. Taken from Barnes and Sharp (1999). ... 8
Figure 2.3: Scaled phylogenetic tree comparing all human serotonin receptors with bovine rhodopsin (BRHO) which is considered to be the primordial serotonin receptor. Results of bootstrap analysis with 100 replications are given above the branches. The scale bar corresponds to 0.2 substitutions per position for a unit branch length. The tree was constructed using the most current NIH Entrez sequence for each receptor with CLC Free Workbench software (CLC bio, Cambridge, MA). Taken from Nichols and Nichols (2008)... ... 9
Figure 2.4: Structure of a Naïve Bayes Model. ...14
Figure 4.1: Number of molecular binding affinities measured by receptor. Data collected from ChEMBL database. ...29
Figure 4.2: Ki values distribution. ...30
Figure 4.3: Mean Ki values by receptor. ...31
Figure 4.4: Mean spKi values by receptor. ...31
Figure 4.5: Comparison between the distributions of 5000 structural similarity values obtained through the comparison of dataset molecules and 4950 structural similarity values obtained through the comparison of 100 molecules randomly selected from ChEMBL database. Structural similarity values were obtained by using NAMS. ...32
Figure 4.6: A) Neighbor-Joining phylogenetic tree for Serotonin and Dopamine receptors. B) Sequence identity matrix for Serotonin and Dopamine receptors, where yellow (0.0) means “0% of sequence identity” and blue (1.0) means “100% of sequence identity”. The green, pink and red colours identify three pairs of analyzed receptors ...33
Figure 4.7: A) Relation between Sequence Identity and Spearman Coefficient (ρ) for molecules’ binding affinities from each pair of pairwise compared receptors. Only the significant Spearman coefficient values were plotted. The different colours refer to the receptors pairs identified in Figure 4.6. A1) Biactivity values (spKi) representation for the same binding molecules from 5-HT1b and 5-HT1d. A2) Biactivity values (spKi) representation for the same binding molecules from 5-HT2c and D1. A3) Biactivity values (spKi) representation for the same binding molecules from D3 and D4. Pink dotted lines: fitted line. Green dotted bounds: confidence interval. Red dotted bounds: Prediction interval. ...35
XII
Figure 4.8: Number of selected kernel molecules by receptor. ...36 Figure 4.9: Distribution of kernel molecules Ki values. The Ki values were obtained
for the respective receptors...37 Figure 4.10: Distribution of structural similarities between kernels. The structural similarities were obtained by using NAMS. ...37 Figure 4.11: Accuracy of Similarity vs Bioactivity levels (SvsBl) model for each receptor. ...38 Figure 4.12: Accuracy of Receptors (R) model for each receptor. ...39 Figure 4.13: Accuracy of Similarity vs Bioactivity levels plus Receptors (SvsBl+R) model for each receptor. ...40 Figure 4.14: Comparison of accuracy levels for each receptor and applied model. SvsBl: Similarity vs Bioactivity levels model; R: Receptors model; SvsBl+R: Similarity vs Bioactivity levels plus Receptors model. ...41 Figure 4.15: Comparison between accuracy levels for each receptor and model before and after applying the classification thresholds. SvsBl: Similarity vs Bioactivity levels model; R: Receptors model; SvsBl+R: Similarity vs Bioactivity levels plus Receptors model. SvsBl + T: Similarity vs Bioactivity levels model plus thresholds; R + T: Receptors model plus thresholds; SvsBl+R+T: Similarity vs Bioactivity levels plus Receptors model plus thresholds. ...44
XIII
List of Tables
Table 2.1: Different 5-HT receptor subtypes and major signaling pathways. Adapted from Pauwels (2003). ...10 Table 2.2: Properties of cloned dopamine receptor subtypes. Adapted from Lachowicz and Sibley (1997). ...12 Table 4.1: Overall values of accuracy, sensitivity, specificity and precision for the proposed models. SvsBl: Similarity vs Bioactivity levels model; R: Receptors model; SvsBl+R: Similarity vs Bioactivity levels plus Receptors model. ...42 Table 4.2: Classification thresholds obtained for each receptor-model pair, through the classification of training set molecules. ...43 Table 4.3: Overall values of accuracy, sensitivity, specificity and precision for the proposed models when adjusted the classification thresholds. SvsBl+T: Similarity vs Bioactivity levels model plus thresholds; R+T: Receptors model plus thresholds; SvsBl+R+T: Similarity vs Bioactivity levels plus Receptors model plus thresholds. ...45
1
1. Introduction
1.1 Polypharmacology: Drug Discovery for the Future
Despite pharmaceutical industry focus on the development of highly selective single-target drugs, it has been proved that many compounds can bind to more than one receptor. This drug promiscuity or polypharmacology has been referred as one of the hottest fields of modern science. Promiscuous compounds can led to undesired effects when binding to different targets and this behavior compromises their viability as potential drugs to therapy of known diseases (Reddy and Zhang, 2013). On the other hand, this represents an opportunity not only to discover new uses for already known compounds but also to increase the efficacy of already known drugs. In fact, efforts have been made to point promiscuous drugs as solution for complex diseases (Haupt et al., 2013).
In order to address this problem, the identification of drug-target interaction networks is an area of intense research. This identification of new drug-target interactions appears as the key to find new targets to old drugs and also new drug candidates for known targets (Cao et al., 2014). Moreover, drug-target interactions are pointed to facilitate the process of drug discovery, drug side-effect prediction and drug repurposing (Ding et al., 2013).
Despite the importance of drug-target interactions discovery, the current knowledge is very limited. For instance, from the 35 million compounds present in the PubChem database, less than 7000 have information relative to target proteins (Ding et al., 1013). However, the increasing amount of available data present in public databases, during the last years, offers the opportunity to explore and integrate the existing knowledge, contributing to the development of more effective and efficient methods to predict drug-target interactions (Kuhn et al., 2008).
In order to face the problems inherent to in vitro prediction methods, which are extremely costly and time-consuming, in silico approaches have been developed to find potential drug-target interactions that can be validated later through in vitro techniques. Docking simulation and machine learning represent two of these major in silico approaches (Ding et al., 2013).
Introduction
| 2 With some limitations associated to docking simulation, machine learning techniques have been widely used to construct models able to predict drug-target interactions. With special emphasis on supervised learning techniques, many studies show that machine learning is an efficient alternative to in vitro experiments, allowing the identification of potential drug candidates for known receptors (Ding et al., 2013; Mousavian and Masoudi-Nejad, 2014).The G-protein coupled receptors (GPCRs) have been used as target receptors in many of these studies not only for being one of the receptors families for which there is more available information but also for representing one of the most important families of receptors present in the Central Nervous System (CNS) (Shiraishi et al., 2013). Thus, the identification of potential drugs for these receptors can be a starting point to develop new therapies for neurological diseases like Attention-Deficit Hyperactivity Disorder (ADHD) and Parkinson’s disease (Vallone et al., 2000; Fox et al. 2009).
1.2 Objectives
With the present work we expect to contribute with a new machine learning-based method to predict potential drug-target interactions. Our aim is to develop a model integrating information relative to structural similarity between compounds and their bioactivity levels for known targets. For that, we will use a Naïve Bayes classifier as supervised learning method and NAMS to measure molecular similarities. As target receptors we have choosed the Serotonin and Dopamine receptors, two families of GPCRs present in the CNS.
Moreover, we expect to infer the evolutionary relationship between the receptors in study and try to relate it with the binding profiles of their common binding molecules by using their measured binding affinities. We also expect to include this information in our prediction model and improve its performance.
Introduction
| 31.3 Overview
The present work is subdivided into three independent parts. First, an overview over the biological background and the informatics techniques is provided. They are described concepts relative to the receptors in study and the drug-receptors interactions. The used methodologies in this work are also presented and a reference to previous similar studies is made at the end.
In the second part, all the execution of the work is described with special emphasis on the detailed description of the used techniques and the justification of all choices made. The construction of models is presented in detail with the algorithms implementation detailed step-by-step.
In the third and final part, all the results obtained through the execution of the proposed techniques and different approaches are displayed and discussed. The performance of the developed models is analyzed and general conclusions of the presented work are provided.
5
2. Concepts and State of The Art
2.1 Drug Interactions with Receptors
Physiological receptors are protein receptors for endogenous regulatory ligands and act as target receptors to many drugs. These receptors have evolved to recognize and respond with great selectivity to specific signaling molecules, which can be primary classified on the basis of their action when coupled with a target receptor as agonists, antagonists, partial agonists or inverse agonists (Goodman et al. 2011).
Agonists, Partial Agonists and Inverse Agonists
They are considered as agonistic drugs the ones that once associated with a specific physiological receptor mimic the regulatory effects of the endogenous signaling molecules (Figure 2.1). Furthermore, agonistic compounds can also be classified as primary agonists or allosteric (or allotropic) agonists. Primary agonists represent drugs that bind to the same recognition site as the endogenous agonist, while allosteric agonists couple to a different region at the target receptor, the allosteric (or allotopic) site.
Compounds that despite the concentration employed are only partly as effective as agonists are described as partial agonists, while the inverse agonists are represented by compounds that stabilize in an inactive conformation receptors whose constitutive activity is exhibited in the absence of a regulatory ligand (Figure 2.1)(Goodman et al. 2011).
Concepts and State of the Art
| 6Antagonists
Drugs that block or reduce the action of an agonist with respect to a specific receptor are considered as antagonistic compounds. These drugs can compete with agonistic molecules for the same overlapping site on the receptor (syntopic interaction) or may interact and bind to different sites. In the second case the compounds are defined as allosteric antagonists.
Antagonists can be also combined with agonists to produce a response and this type of interaction is termed chemical antagonism. Moreover, agonistic cellular or physiological effects can also be indirectly inhibited by functional antagonists (Goodman et al. 2011).
2.1.1 Quantifying Binding Activities
In order to better understand a drug-receptor interaction a quantification of molecules’ binding affinities is imperative, mostly when trying to find selective compounds for target receptors. Despite the fact that different measures for binding affinities have been developed, some of them remain more used like the half
Figure 2.1: Regulation of the activity of a receptor with conformation-selective drugs. The ordinate is the activity of the receptor produced by Ra, the active receptor conformation (e.g., stimulation of adenylyl cyclase by a β adrenergic
receptor) while the coordinate represents the concentration of drug L present at the receptor. Taken from Goodman
Concepts and State of the Art
| 7 maximal effective concentration (EC50), the half maximal inhibitory concentration (IC50) and the inhibitory constant (Ki).EC50 value represents the molar concentration (M = mol/L) of an agonist that produces half of the maximal possible effect of that agonist, while IC50 value can have different meanings: (1) the molar concentration of an antagonist that reduces the response to an agonist by 50%; (2) the molar concentration of an unlabeled agonist or antagonist that inhibits the binding of a radioligand by 50%; (3) the molar concentration of an inhibitory agonist that reduces a response by 50% of the maximal inhibition that can be attained (Cortés et al., 2001; Neubig et al., 2003).
Ki value is used to quantify a ligand-receptor interaction based on the
equilibrium dissociation constant (K) and refers to the equilibrium dissociation constant of a ligand determined in inhibition studies. It is typically determined in a competitive radioligand binding study through the measurement of the inhibition of the binding of a reference radioligand by the competing ligand of interest under equilibrium conditions and is expressed as a molar concentration. Therefore, the smaller the Ki value, the smaller the ligand quantity needed to inhibit the radioligand
binding, which means that small values of Ki are associated with higher
ligand-receptor binding affinities (Goodman et al., 2011; Neubig et al., 2003).
Ki values are sometimes represented as pKi values, which are described as the
negative logarithm to base 10 of the equilibrium dissociation constant, in this case the Ki value. The use of the pKi measure instead of the equilibrium constant itself
allows an easier comparison of binding affinities given the fact that Ki values often
ranges over many orders of magnitude (from 10-10 M to >10-3 M), while pKi values
mostly range from about 10 to 3. Moreover, from a statistical vision, concentration parameters are generally distributed in a log normal manner. Thus, standard deviations are symmetrical for pKi values but not for Ki values (Neubig et al., 2003).
2.2 Serotonin Receptors
Serotonin (5-HT) receptors family remains one of the most complex and constantly updated receptors family since new members still being discovered and old ones have been reclassified over time (Barnes and Sharp, 1999). In order to
Concepts and State of the Art
| 8 avoid misunderstandings, only the new nomenclature will be considered (Figure 2.2).Figure 2.2:Summary of changes in 5-HT receptor nomenclature. Taken from Barnes and Sharp (1999).
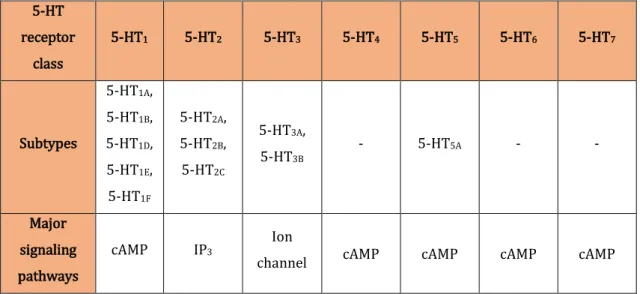
Currently, 5-HT receptors are subdivided, according to the NC-IUPHAR subcommittee on 5-HT receptors, into seven distinct classes (5-HT1, 5-HT2, 5-HT3,
5-HT4, 5-HT5, 5-HT6 and 5-HT7) comprising a total of 14 distinct receptors in
humans (Pauwels, 2003), which are considered to have evolved from a primordial rhodopsin – G-protein-coupled receptor (GPCR) family (Figure 2.3) (Barnes and Sharp, 1999). Moreover, splice variants (belonging to 5-HT3, 5-HT4, 5-HT6 and 5-HT7
classes) and edited isoforms (belonging to 5-HT2C receptor) have also been
identified, which makes receptors classification and functional studies even harder (Barnes and Sharp, 1999; Pauwels, 2003; Nichols and Nichols, 2008). In fact, 5-HT receptors classification not only takes into account operational criteria like drug-related characteristics but also information on intracellular signal-transduction and amino acid sequences (Pauwels, 2003).
Concepts and State of the Art
| 9With the exception of 5-HT3 class, all 5-HT receptors belong to the GPCR
superfamily and have a major role in the regulation of adenylyl cyclase (AC) pathway. They can increase or decrease cyclic AMP (cAMP) intracellular levels. Additionally, 5-HT2 class is also involved in the stimulation of phosphoinositide
hydrolysis (Barnes and Sharp, 1999; Pauwels, 2003; Nichols and Nichols, 2008). Beyond these main functions, their involvement in other signaling pathways has been well described over time (Barnes and Sharp, 1999; Nichols and Nichols, 2008). With respect to 5-HT3 class, it represents a serotonin-gated cation channel
composed by two subunits (5-HT3A and 5-HT3B) and its receptors are classified as
belonging to the ligand-gated ion channel superfamily (Barnes and Sharp, 1999; Pauwels, 2003; Nichols and Nichols, 2008) (Table 2.1).
Figure 2.3: Scaled phylogenetic tree comparing all human serotonin receptors with bovine rhodopsin (BRHO) which is considered to be the primordial serotonin receptor. Results of bootstrap analysis with 100 replications are given above the branches. The scale bar corresponds to 0.2 substitutions per position for a unit branch length. The tree was constructed using the most current NIH Entrez sequence for each receptor with CLC Free Workbench software (CLC bio, Cambridge, MA). Taken from Nichols and Nichols (2008).
Concepts and State of the Art
| 10 5-HT receptor class 5-HT1 5-HT2 5-HT3 5-HT4 5-HT5 5-HT6 5-HT7 Subtypes 5-HT1A, 5-HT1B, 5-HT1D, 5-HT1E, 5-HT1F 5-HT2A, 5-HT2B, 5-HT2C 5-HT3A, 5-HT3B - 5-HT5A - - Major signaling pathways cAMP IP3 Ionchannel cAMP cAMP cAMP cAMP
Table 2.1: Different 5-HT receptor subtypes and major signaling pathways. Adapted from Pauwels (2003).
5-HT receptors are widely distributed in the Central Nervous System (CNS) with some of them also present in the periphery. This widespread distribution is closely related with the numerous functions performed by this well-known family of receptors (Barnes and Sharp, 1999; Nichols and Nichols, 2008). The association of 5-HT receptors with fundamental mechanisms related to survival of species like feeding, reproduction and homeostasis has already been described. In addition to that, their role in the regulation of mood states, cognition and memory was also verified. In fact, these findings have led to the study of 5-HT receptors involvement in psychiatric disorders (Barnes and Sharp, 1999; Nichols and Nichols, 2008) and the implication of some serotonin receptors in degenerative disorders has been demonstrated, with some serotonergic dysfunctions showing to be on the basis of several symptoms associated with Parkinson’s disease (Fox et al., 2009).
5-HT receptors wide distribution in association with an extensive variety of functions and implications in degenerative disorders has made this GPCR family one of the most important classes of therapeutic targets (Nichols and Nichols, 2008). In fact, the search for selective agonists and antagonist has been a priority, since differentiation between related receptors is not an easy process (Barnes and Sharp, 1999; Nichols and Nichols, 2008). For instance, when comparing the affinity values (pKi) of various ligands for 5-HT2 receptor subtypes we verify that despite some
Concepts and State of the Art
| 11 differences in pKi values for the remaining receptors are not as high as we expected(Barnes and Sharp, 1999).
2.3 Dopamine Receptors
Dopamine receptors (DA-Rs) are among the most well-known receptors present in the Central Nervous System (CNS). Their involvement in several signaling pathways is already known and their association with some neurological diseases like Parkinson’s disease and Attention-Deficit Hyperactivity Disorder (ADHD) has been already verified (Vallone et al, 2000).
Although their main location in the CNS, some receptors are also found in the periphery, with their presence being described in kidney and heart (Table 2.2) (Civelli et al., 1993; Lachowiczl and Sibley, 1997; Vallone et al., 2000).
DA-Rs are classified as seven transmembrane domain (7TM) proteins and they belong to the G-protein coupled receptors superfamily. DA-Rs interaction with heterotrimeric G proteins leads to the activation of adenylyl cyclase (AC) that is responsible for increasing or decreasing cyclic AMP (cAMP) intracellular levels. Moreover, DA-Rs are also involved in the activation of additional pathways like stimulation and inhibition of Ca2+ and K+ currents and modulation of arachidonic
acid (AA) synthesis (Civelli et al., 1993; Vallone et al, 2000).
Five different DA-Rs were discovered and subdivided, based on their structural, pharmacological and functional similarities, into two distinct subfamilies: the D1
-like subfamily and the D2-like subfamily. The main reason which led to this initial
separation was the different role played by each receptor in the regulation of the cAMP pathway. While D1-like subtype receptors are positive regulators of cAMP
levels, D2-like subtype receptors are responsible for the inhibition of adenylyl
cyclase and subsequently for decreasing cAMP intracellular levels.
The D1-like subfamily includes the D1 and D5 receptors, while the D2-like
subfamily comprises the D2, D3 and D4 receptors (Table 2.2) (Civelli et al., 1993;
Concepts and State of the Art
| 12Receptor
subfamily D1 – like D2 – like Receptor
subtype D1 D5 D2 D3 D4 Amino acids 446 477 414/443 * 400 387 Introns in ORF No No Yes Yes Yes
Effector
pathways cAMP cAMP
cAMP K+ channel Ca2+ channel K+ channel Ca2+ channel cAMP Distribution Caudate putamen Nucleus accumbens Hippocampus Kidney Caudate putamen Nucleus accumbens Nucleus accumbens Hypothalamus Frontal cortex Heart
Table 2.2: Properties of cloned dopamine receptor subtypes. Adapted from Lachowicz and Sibley (1997).
Despite dopaminergic ligands being easily distinguished between D1-like
ligands and D2-like ligands, their discrimination as selective ligands to the different
subfamilies members is a more complex process. For instance, when comparing binding affinities of several compounds for D1 and D5 receptors we verify that
differences in the affinity values are minimal and in some cases even inexistent. A more heterogeneous scenery is found when comparing compounds affinities for each of the D2-like subfamily members, with some compounds showing evident
differences in their affinity values for different receptors, while for other compounds the identification of a target receptor is a harder process (Vallone et al., 2000).
2.4 Data Mining and Machine Learning
Data mining has emerged to deal with huge datasets, extracting from them patterns and relationships (Hand et al., 2001). In this field, machine learning algorithms are being used to discover knowledge from this large amount of information. These methods are based on the construction of algorithms that can
Concepts and State of the Art
| 13 learn from and data and make predictions on it. They can be classified as supervised or unsupervised learning methods. Supervised approaches assume that training examples are labeled by class labels, while unsupervised ones use unclassified examples (Mitchell, 1997). Machine learning has been of great importance in bioinformatics field, especially the supervised learning approaches. They have been used in genomics, proteomics, microarrays, systems biology, evolution and text mining (Larrañaga et al., 2006). Although some of these techniques have become more popular than others, like artificial neural networks, support vector machines, Markov models, decision trees and random forests (Jensen and Bateman, 2011), other approaches have been also used with good results, like the Bayesian classifiers (Chinnasamy et al., 2005; Wang et al., 2007).2.4.1 Naïve Bayes Classifier
Naïve Bayes Classifier is a supervised machine learning method based on applying Bayes’ Theorem with the assumption of conditional independence between features (Figure 2.4). It is the simplest Bayesian classifier and it is applied as a conditional probability model to assign class labels to problem instances. For that, the model involves a learning step in which the conditional probabilities are estimated, counting the frequency of various data combinations within the training set. After this training step in a supervised learning setting, the model is then used to classify problem instances. Each instance is described by a combination of attribute values. When a new sample is presented, its attributes are used to classify it by obtaining the product of the probabilities for the individual features (Mitchel, 1997; Hand et al., 2001).
Naïve Bayes is distinguished from other supervised learning methods by its assumption of independence between features. However, it has proved its usefulness as machine learning method in bioinformatics and chemoinformatics studies, performing well when predicting coupling between transmembrane domain receptors and G-proteins (Cao et al., 2003) and also in the prediction of heterodimeric protein complexes (Maruyama, 2013).
Concepts and State of the Art
| 14Figure 2.4: Structure of a Naïve Bayes Model.
2.5 Molecular Similarity
Similarity between molecules can be obtained based on chemical similarity, pharmacological similarity, therapeutic similarity and drug-drug interaction similarity (Mousavian and Masoudi-Nejad, 2014).
Chemical-based similarity takes into account the size of the shared substructures between two molecules and use that information to obtain a similarity measure, which can be done using 2D or 3D representations of the compounds (Nettles, 2006). Pharmacological-based similarity is computed by encoding each molecule in a binary vector, in which each element represents a pharmacological keyword. After, a correlation coefficient between vectors is calculated and the obtained value represents the similarity score (Yamanishi et al., 2010). Alternatively, pharmacological-based similarity can be obtained by comparing the number of shared side effects between compounds (Kim et al., 2013). The therapeutic-based similarity uses a hierarchical drug classification system, the Anatomical Therapeutical Chemical (ATC), to classify each drug with an ATC term and measures the similarity between compounds based on their corresponding ATC terms (Skrbo et al., 2004). At last, the drug-drug interaction-based similarity uses a drug-drug interaction network to obtain the similarity between two drugs, calculating the shortest distance between them or obtaining it from the direct interaction between the two compounds (Kim et al., 2013).
In addition to these similarity methods, other studies have used similarity based on features to compare different compounds. For that, each drug-target pair is represented as a vector of descriptors. In these methods, a set of features represent different properties of drugs and targets and allow drug-target interactions (DTIs) prediction by using the most discriminative descriptors (Cao et al., 2012). Each drug,
Concepts and State of the Art
| 15 target or drug-target pair is characterized as a fixed-length vector representing the set of chosen features and this information is then used to infer DTIs in the genome scale (Mousavian and Masoudi-Nejad, 2014). Fingerprints are among the most used descriptors with the 2D structure of compounds being converted in a vector of bits by encoding (hashing) the presence or absence of a defined list of molecular substructures (Kuhn et al., 2008).2.5.1 NAMS
Non-contiguous Atom Matching Structural Similarity (NAMS) is a method used to obtain the structural similarity between molecules through atom alignment. In this method, an annotated molecular graph is created and an optimal atom alignment using pairwise matching algorithms is used to obtain the similarity measure between two molecules by comparing the bonding profiles of their atoms. For that, they are taken into account not only the topological profiles of molecules but also their atoms and bonds characteristics. Despite of a higher computational cost, this method has showed good results when distinguishing either different or very similar compounds, performing better than other most used similarity methods like the Fingerprint-based ones (Teixeira and Falcão, 2013).
2.6 Related Work
Target-based methods and ligand-based methods are two distinct in silico approaches that have been widely used in drug-target interaction (DTI) prediction studies. Target-based methods or docking simulation relies on receptors conformations and molecules chemical structures matches to predict DTIs. For that, a knowledge of target proteins’ three dimensional conformations is required. However, this is not always possible once that little information about crystallized receptors is available. For instance, only a few number of GPCRs have already their structural conformation totally described (Ballesteros and Palczewski, 2001;
Concepts and State of the Art
| 16 Klabunde and Hessler, 2002). Moreover, this type of simulation has shown not only to be time-consuming but also to require a lot of computational resources (Ding et al., 2013). Despite docking strategies be powerful tools resulting in strong DTI predictions their applicability in a large-scale context is compromised by the existence of such limitations.Contrariwise, ligand-based methods apply learning-based methods to DTI prediction by comparing a new ligand to known ligands of a target receptor. Contrarily to docking simulation, these approaches do not need a previous knowledge on proteins’ three-dimensional (3D) structures to predict new interactions and can be applied even when we do not have information about the structural conformation of target receptors. On the other hand, ligand-based methods can be compromised by small numbers of known ligands once that it will result in inaccurate predictions (Mousavian and Masoudi-Nejad, 2014).
In this context, learning-based methods can be categorized into supervised and semi-supervised methods, with supervised learning methods subdivided into similarity-based methods and feature-based methods (Mousavian and Masoudi-Nejad, 2014). Supervised methods infer a model based on labeled training data and use it to infer true labels for unknown instances. For that, both known and unknown interactions between drugs and targets are considered as positive and negative samples, respectively (Cao et al., 2014). However, the selection of unknown interactions as negative samples is taken as an inherent limitation since one does not know which of them represent in fact true interactions (Ding et al., 2013). In order to face this problem, semi-supervised methods have been applied by using a small number of labeled data in conjunction with numerous unlabeled data (Mousavian and Masoudi-Nejad, 2014).
The underlying idea of learning-based methods is that similar drugs are likely to interact with similar receptors and DTIs prediction can be performed by using similarities among drugs, target receptors or both.
Many studies have been integrating different types of information in order to construct more robust DTIs prediction models. A method using a support vector machine algorithm based on chemical-based similarity for ligands and sequence-based similarity for proteins has been proposed by Jacob et al. (Jacob and Vert, 2008). A different approach adopted by Yamanishi et al. uses target sequences, drug
Concepts and State of the Art
| 17 chemical structures and the topology of a drug-target network not only to identify possible drug-target interactions but also to investigate which features become more relevant in DTIs prediction studies. For that, the authors have used a new method, the bipartite graph learning method (Yamanishi et al., 2008). In another study, Yamanishi et al. proposed the use of an algorithm based on distance learning to investigate the relationship between the chemical space, the pharmacological space and the topology of drug-target network. The authors have showed that chemical structure similarity is less correlated with DTIs than pharmacological similarity (Yamanishi et al., 2010). Another study using a kernel-based method and the information on therapeutic and pharmacological data have been proposed by Wang et al. (Wang et al., 2011). More recently, a new approach integrating functional data with chemical data, genomic data, pharmacological data, and the topology of interaction networks has been developed by Yang et al.. In this study the authors have presented a probabilistic graphical model to more accurately predict missing interactions between drugs and targets (Yang et al., 2014).19
3. Material and Methods
3.1 Tools
The data relative to receptors’ binding molecules and their bioactivity values were obtained by using the Python v.2.7.6 programming language through the use of math, bioservices and numpy libraries (Cokelaer et al., 2013; van der Walt et al., 2011).
All the analyses were performed using R v.3.2.1 programming language with the R studio as main interface. Moreover, all the graphics and tables present in this study were designed by using the available R tools.
3.2 Data Collection and Processing
All the data used in this study was collected from ChEMBL and Uniprot databases. First, a search for all the Serotonin and Dopamine receptors from human (Homo sapiens) was carried out and only those present at ChEMBL and for which binding molecules affinities information, in the form of inhibitory constant (Ki), was
available were included in the dataset. In total, we ended with a dataset with 14 different serotonin receptors and 5 different dopamine receptors. For 5-HT3B
serotonin receptor only 4 molecules binding affinities records for human were collected. Due to its lack of binding molecules information it was considered as part of the dataset but it was excluded from some posterior analysis.
In order to handle with outliers, a correction step was applied to records, from different studies, showing different binding affinity levels for the same receptor-molecule pair. For each case the following process was performed: (i) the mean and standard deviation for the registered values were calculated; (ii) all the values above or under the mean plus two times the standard deviation were excluded from the records; (iii) a new mean was calculated using only the remaining values and it was
Material and Methods
| 20 used as the final receptor-molecule pair binding affinity value. In total, we ended with 22690 receptor-molecule records corresponding to 11341 different molecules. After, all the Ki values were converted into scaled pKi (spKi) values according tothe following rules:
If Ki >= 10000, spKi = 0 If 10000 > Ki > 1, spKi = 4 – log10 (Ki) 4 If 1 ≥ Ki, spKi = 1 (1) where Ki is the inhibitory constant and spKi represents the scaled pKi.
3.3 Evolutionary Analysis
In total, 14 protein sequences of distinct serotonin receptors (5-HT1A, 5-HT1B,
5-HT1D, 5-HT1E, 5-HT1F, 5-HT2A, 5-HT2B, 5-HT2C, 5-HT3A, 5-HT3B, 5-HT4, 5-HT5A, 5-HT6
and 5-HT7) belonging to 7 different subfamilies and 5 different ones of dopamine receptors (D1, D2, D3, D4 and D5) belonging to the 2 existing subfamilies were
collected from Uniprot in FASTA format. After, a ClustalW multiple alignment was carried out between all the protein sequences. With the obtained alignment a phylogenetic Neighbor-Joining Phylogenetic Tree was constructed using MEGA version 6 (Tamura et al., 2013).
A sequence identity matrix was obtained using the same 19 protein sequences previously collected. For this purpose, the seqinr R package was used to read the ClustalW multiple alignment in FASTA format, comparing pairs of sequences and calculating their sequence identity value, scaled between 0 (no sequence identity) and 1 (total sequence identity)(Charif and Lobry, 2007). For a better visualization of the obtained results, a colour matrix integrating all the information was generated.
Material and Methods
| 213.4 Molecular Similarity
The NAMS Webtool was used to obtain the structural similarities between the 11341 unique molecules based on the structural/topological relationships of their atoms. As way to reduce the required computational time of this process only molecules with less than 50% of difference between their molecular weights were compared since we expect that molecules with great differences in their molecular weight may not to be sufficiently similar to become relevant in our study.
3.5 The Probabilistic Model
The 11341 unique molecules were subdivided into validation set, with 2000 molecules, and training set, comprising the remaining 9341 molecules. Validation molecules were randomly selected from the set of all molecules and their records were removed from the receptors’ original data files. Probabilistic models were constructed and trained with the training set molecules.
3.5.1 Receptors Database
Taken into account only the information relative to shared binding molecules between receptors and their respective bioactivity levels we have constructed a database storing the conditional probabilities of a certain molecule bind to a receptor given its active behavior towards other receptors. These probabilities were obtained for each pair of receptors by calculating the proportion between the number of active molecules for the first receptor which are also active for the second receptor and the total number of active molecules for the second receptor.
A second database was constructed to store the same probabilities but considering a non-active behavior for the second receptor. For that, the probabilities were calculated as the proportion between the number of active molecules for the first receptor which are non-actives for the second receptor and the total number of non-active molecules for the second receptor.
Material and Methods
| 22 3.5.2 Kernels SelectionFor each receptor a group of molecules from the training set was selected to represent kernel molecules due its discriminant role among all the molecules. Thus, kernels are expected to represent structurally distinct active molecules for a given receptor. The selection was made for each receptor according to the following process:
1. The molecules with spKi value under 0.1 are discarded;
2. The molecule with the highest spKi value is selected as the first kernel;
3. Structural similarities between the selected kernel and all the other molecules are computed by NAMS;
4. Molecules with similarities above 0.6 to the selected kernel are discarded; 5. The molecule with the highest spKi value among the remaining molecules is
selected as the new kernel;
6. Return to point 3 and end when there are no more molecules.
In total, they were selected 807 distinct kernel molecules with some of them being selected as kernel for more than one receptor. The D2 dopamine receptor
registered the highest number of kernels with 143 selected molecules. Otherwise, 5-HT1E, 5-HT1F and 5-HT3B serotonin receptors showed the lowest numbers of
kernels with only 5, 4, and 3 molecules being selected, respectively.
3.5.3 Kernels Database
All the binding molecules for each receptor were compared with the selected kernels for the respective receptors and they were grouped in a database based on their spKi values for the receptor and their similarity to the kernels. For that,
molecules were subdivided into actives, with spKi > 0.1, and less actives, with spKi
<= 0.1, and they were classified according to their similarity to each kernel as S1, if they showed less than 60% of similarity, S2, if they showed between 60% and 80%
Material and Methods
| 23 of similarity, or S3, if they had more than 80% of similarity to the kernel. This information was stored in a database as counts, which are on the basis of the probabilities used later during the classification process using the Naïve Bayes classifier.3.5.4 Algorithm Implementation
We have developed three different models in order to predict drug-target interactions. The first model uses obtained information on structural similarities between molecules and their binding affinities to receptors. The second model is based on co-activity data between receptors and the third model was constructed as a combination of the first two models.
3.5.4.1 Molecular Similarity vs Bioactivity Levels
The first approach takes advantage on the information from structural similarity between molecules and their bioactivity values for the target receptors to compute the binding probability between a molecule and a receptor. The following process is applied to each molecule in order to predict its behavior with respect to the considered receptors:
1. The structural similarity between the molecule in test and all kernels is computed by NAMS;
2. Kernels with more than 50% of similarity to the test molecule are selected; 3. The selected kernels are grouped according to their respective receptors.
They are selected for test the receptors for which at least 3 kernels were selected;
4. For each receptor under test, molecule binding probability is calculated based on a Naïve Bayes method using the structural similarities to the selected kernels as features:
Material and Methods
| 24 I. For each kernel, the level of similarity to the test molecule is classifiedas S1, S2 or S3 (similarity under 60%, between 60% and 80% or more than 80%, respectively);
II. The conditional probability of the test molecule having the specified level of similarity to the kernel given an active behavior is calculated using the counts stored in the kernels database:
P(Sk = Sl | A) =number of active molecules to R with Sk = Sl
Total of active molecules to R
(2) where Sl is the level of similarity to the kernel Sk, A represents an
active behavior and R is the receptor under test.
III. The same process is applied to obtain the conditional probability given an non-active behavior:
P(Sk = Sl | NA) =number of non-active molecules to R with Sk = Sl
Total of non-active molecules to R
(3) where Sl is the level of similarity to the kernel Sk, NA represents an
non-active behavior and R is the receptor under test.
IV. The conditional probabilities for each kernel given an active behavior are multiplied as independent events to obtain the probability of the test molecule being active for the given receptor:
𝑃(𝐴) = ∏P(Sk = Sl | A) 𝑛
𝑖=1
(4) where P(A) is the probability of the test molecule being active and n represents the number of kernels for which they were obtained the conditional probabilities in equation 2.
V. The conditional probabilities given a non-active behavior are also multiplied to achieve the probability of the test molecule being non-active for the same receptor:
Material and Methods
| 25𝑃(𝑁𝐴) = ∏P(Sk = Sl | NA) 𝑛
𝑖=1
(5) where P(NA) is the probability of the test molecule being non-active and n represents the number of kernels for which they were obtained the conditional probabilities in equation 3.
VI. In order to adjust the final probabilities both are individually divided by the total of their sum.
3.5.4.2 Integrating Receptors Information
In an attempt to improve the model based uniquely on molecules similarity and bioactivity levels, the information relative to shared receptors was also integrated according to the following procedure:
1. For each molecule, they are selected the receptors for which there is previous knowledge about the molecule binding behavior. This information is obtained by consulting real data.
2. For each receptor in test during the classification process, the information relative to other receptors is included. Depending on the molecule behavior, one of the following proceedings is applied:
I. If the molecule is active for other receptor, the conditional probability of the molecule being active or non-active to the receptor in test given its active behavior for other receptor is extracted from the receptors database:
𝑃(AR1) = ∏ P(AR1|AR2) 𝑎
𝑖=1
Material and Methods
| 26𝑃(NAR1) = ∏ P(NAR1|AR2) 𝑎
𝑖=1
(7) where P(AR1) and P(NAR1) represent, respectively, the probability of
the test molecule being active and non-active to a receptor R1 as the product of the conditional probabilities of being active and non-active for R1 given being active for other receptor R2. a represents the number of receptors for which it is known the test molecule is active. II. If the molecule is non-active for other receptor, the same proceeding
is applied but this time extracting the probability of the molecule to be active or non-active to the receptor in test given its non-active behavior for other receptor:
𝑃(AR1) = ∏ P(AR1|NAR2) 𝑛𝑎
𝑖=1
(8)
𝑃(NAR1) = ∏ P(NAR1|NAR2) 𝑛𝑎
𝑖=1
(9) where P(AR1) and P(NAR1) represent, respectively, the probability of
the test molecule being active and non-active to a receptor R1 as the product of the conditional probabilities of being active and non-active for R1 given being non-active for other receptor R2. na represents the number of receptors for which it is known the test molecule is non-active.
3. In the end, the final probabilities of the test molecule to be active or non-active to a certain receptor are given by multiplying the probabilities obtained through the kernel molecules (eqs 4 and 5) by the probabilities based on the molecule binding behavior with other receptors (eqs 6, 7, 8 and 9):
Material and Methods
| 27𝑃(AR1) = ∏P(Sk = Sl | AR1) × ∏ P(AR1|AR2)× ∏ P(AR1|NAR2)
na i=1 a i=1 𝑛 𝑖=1 (10) 𝑃(NAR1) = ∏P(Sk = Sl | NAR1) × ∏ P(NAR1|AR2) a j=1 𝑛 𝑗=1 × ∏P(NAR1|NAR2) na j=1 (11) where P(AR1) and P(NAR1) are the probabilities of the test molecule being
active and non-active for a receptor R1 as the product of equations 4, 6, and 8 and 5, 7, and 9, respectively.
4. In order to adjust the final probabilities both are individually divided by the total of their sum.
3.5.4.3 Receptors Role during Classification Process
To better understand the impact of including information on known receptors during classification process, a new approach comprising only this kind of information was developed. For each test molecule, they were used only the conditional probabilities from the receptors database, depending on the molecule behavior with respect to other receptors, as previously described (eqs 6 – 9). Subsequently, the final probabilities of one molecule to be active or non-active to a receptor in test are obtained by multiplying only these probabilities as independent events.
3.5.5 Classification Process
Initially, it was defined a threshold of 50% to classify a molecule as active or non-active for a given receptor, which means that if a molecule has a final probability of being active above 0.5 it can be considered as active for the receptor under study. In opposition, a probability under 0.5 allows its classification as non-active.
Material and Methods
| 28 Afterward, using the training set classification results, they were calculated the False Positive and False Negative rates, for each receptor, which were plotted as a function of the used classification thresholds. The used thresholds varied between 0% and 100% with an increment of 1%. Subsequently, it was selected, for each receptor, the threshold value for which the number of False Positives and Negatives were smaller and it was used as a new classification threshold.3.6 Validation
Validation process was performed by classifying the 2000 molecules from the validation set. The classified molecules for each receptor were grouped and classified as True Positives (TP), True Negatives (TN), False Positives (FP) or False Negatives (FN) according to the real data.
3.7 Results Analysis
The validation results were analyzed by receptor through a confusion matrix. Moreover, Precision-Recall and ROC curves were also plotted for information on the quality of the model for each receptor. Both curves were obtained by varying the threshold used during the classification process.
For the Precision-Recall curve the values of Precision and Recall (or Sensitivity) were calculated as 𝑇𝑃
𝑇𝑃+𝐹𝑃 and 𝑇𝑃
𝑇𝑃+𝐹𝑁, respectively. For the ROC curve they were used
the False Negative rate, 𝐹𝑁
𝐹𝑁+𝑇𝑃, and the False Positive rate, 𝐹𝑃
𝐹𝑃+𝑇𝑁 (Hand et al., 2001).
In order to classify models performances they were also used specificity, 𝑇𝑁
𝑇𝑁+𝐹𝑃 , and
accuracy, 𝑇𝑃+𝑇𝑁
29
4. Results and Discussion
4.1 Data Analysis
For the 19 Serotonin and Dopamine receptors, it was collected a total of 22690 receptor-molecule interactions records, corresponding to 11341 different molecules (see Appendix). D2 receptor registered the highest number of measured
Kis with information for a total of 4634 molecules. In opposition, 5-HT1E, 5-HT1F and
5-HT3B serotonin receptors recorded the smallest numbers of records with only 86,
99 and 4 molecules’ binding affinities being collected (Figure 4.1). Little information for the 5-HT3B serotonin receptor was expected once that it represents only a 5-HT3
receptor subunit (Nichols and Nichols, 2008). For this reason, it was excluded from the majority of the analysis.
Figure 4.1: Number of molecular binding affinities measured by receptor. Data collected from ChEMBL database.
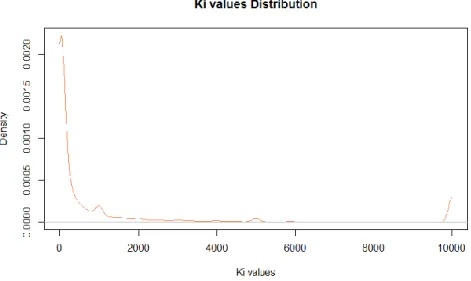
Through the observation of Ki values distribution, we have identified the
presence of 4 peaks (around 1, 1000, 5000 and 10000 values) (Figure 4.2). We believe this occurrence is due to different criteria used during competitive radioligand binding studies. The interest in a specific molecule can vary with its binding affinity value once that smaller affinity values correspond to more active compounds. Therefore, when considering a threshold Ki value to distinguish
between relevant and not so relevant compounds, different criteria can be used by different groups and during different studies. For this reason, we think these peak
Results and Discussion
| 30 values correspond to 4 different thresholds. In fact, this can be a problem since we cannot know which values correspond to real Ki values and which ones areunderestimates of the real values.
In this study, we have considered a threshold of Ki = 5000, whenever it was
required. With respect to spKi values, we have choosed a value of 0.1 (Ki = 3981).
We consider these values a threshold to distinguish between active and non-active compounds.
Figure 4.2: Ki values distribution.
Considering the same graphic, we can also observe a much higher quantity of Ki
values under 1000, which indicates an overrepresentation of active molecules in our records. This occurrence is not a surprise once that our data comes from real studies and most of them tend to test molecules for which the suspicion of activity exists, either by being related to other active molecules or because they have already been tested for other similar receptors.
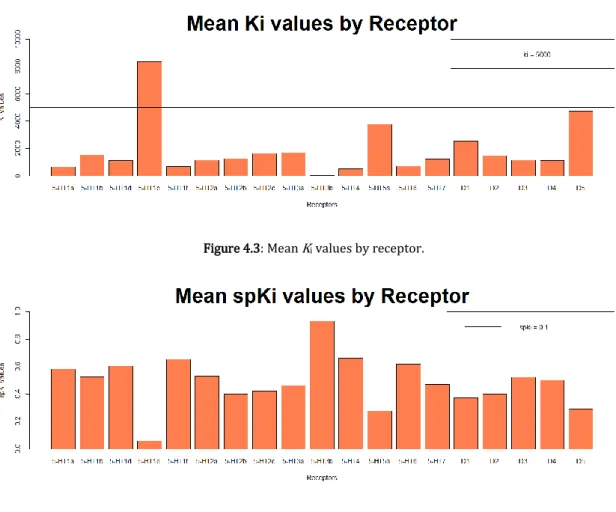
This overrepresentation can also be verified when observing the mean Ki and
spKi values by receptor (Figures 4.3 and 4.4). With the exception of the 5-HT1E
serotonin receptor, all receptors have a mean Ki value under 5000 and a spKi value
above 0.1. This overrepresentation is taken into account during the models implementation and posterior validation.
Results and Discussion
| 31Figure 4.3: Mean Ki values by receptor.
Figure 4.4: Mean spKi values by receptor.
When analyzing the structural similarity values obtained through a pairwise comparison for all molecules present in our dataset, we verify that the majority of our similarity values are around 0.4914, which means that a large part of our compounds have about 50% of structural similarity to other compounds (Figure 4.5). In order to confirm the accuracy of these data, we have observed the distribution of 4950 structural similarity values obtained through the comparison of 100 molecules randomly selected from ChEMBL. What we found in this case was the majority of similarity values distributed around 40% (Figure 4.5).
We consider that the presence of a higher number of structurally similar molecules in our dataset is associated with the overrepresentation of active molecules. Following the assumption that similar compounds can share similar binding behaviors, we believe that a part of the many active molecules present in our dataset correspond to structurally similar compounds. This result highlights once more the presence of a bias in our data.