A Work Project, presented as part of the requirements for the Award of a Masters Degree in Management from the NOVA – School of Business and Economics.
Should Quinta dos Açores expand its retailer
network in Lisbon?
Sofia Gonçalves Ortins, 1716
A Project carried out on the strategy course, under the supervision of: Prof. Sofia Margarida Fernandes Franco
i
Should Quinta dos Açores expand its retailer
network in Lisbon?
ABSTRACT
The primary purpose of this research is to examine the feasibility of expanding Quinta dos Açores retailer network in Lisbon starting from 2015 onwards. A time series model was developed to estimate the company’s future production and sales. A Discounted Cash Flow analysis was also conducted to determine the profitability of this expansion opportunity. Our findings reveal that Quinta dos Açores will face negative results in the first two years of the expansion strategy, but the overall opportunity presents a net positive result of almost three million euros.
ii Acknowledgements
I would like to express my gratitude to my thesis adviser, Prof. Sofia Franco, for her careful guidance, for her perseverance, her constant feedback and for always pushing me further.
I want to thank Helga Barcelos, Quinta dos Açores director, for her collaboration and availability, which allowed me to develop and improve this project.
Finally, I want to thank to my family and friends for their patience and constant presence, support and concern throughout all the months of work.
iii
Contents
1. INTRODUCTION 1
2. COMPANY BACKGROUND 2
2.1 Quinta dos Açores consumers 3
3. THE PORTUGUESE YOGHURT MARKET 4
3.1 Porter Five Forces Analysis 5
3.2 SWOT Analysis 8
4. THE SPREADSHEET MODEL 9
4.1 Forecasting Production 10
4.2 Discounted Cash Flow Model 14
4.3 Calibration 14
5. DISCUSSION OF RESULTS 16
5.1 Production Forecast 16
5.2. From Production to forecasting Sales 22
5.3 Projections for 2015 to 2019 23
5.4 Sensitivy of forecasts 27
6. CONCLUSIONS 27
REFERENCES 28
1 1. Introduction
Quinta dos Açores (QA) is a Portuguese dairy company that produces and sells drinkable yogurts, milk, cheese and ice-cream. Established in 2012, the company is owned by Grupo Barcelos1. The holding group owns five additional companies that operate all through the milk and meat production value-chain. The company currently sells its products in thirteen different locations through four different retailers. Twelve of these locations are located in the Portuguese Azorean islands and only one is located in Lisbon. Currently, Quinta dos Açores’s retail partner in Lisbon is the El Corte Inglês supermarket.
The goal of this work project is to examine the feasibility of expanding Quinta dos Açores retailer network in Lisbon. In particular, we restrict our analysis to the company’s drinkable yogurt segment. The Lisbon market was chosen for this analysis for two reasons. First, Lisbon is the city where yogurt has the highest penetration rate (75%)2. Second, out of the cities where the company has already established distribution and retail partners, Lisbon is the city that presents the largest unexplored customer base. In order to accomplish our goal, we develop a time series forecasting model for Quinta dos Açores yogurt production. The selected forecast horizon is from 2015 to 2019. In addition, we also develop a discounted cash flow model (DCF) to examine the profitability of expanding Quinta dos Açores retailer network in Lisbon.
Quinta dos Açores produces two different types of yogurt: regular and non-fat, also known as elegant. Each yogurt has different production costs and prices. To ensure the accuracy of our DCF analysis we have developed separate forecasting models for each yogurt. We also collected data with Quinta dos Açores regarding its monthly yogurt production from 2012 to 2014. In particular, we forecasted the regular yogurt production using a quadratic trend model with multiplicative seasonal indexes. On the other hand, the non-fat yogurt production was forecasted based on an exponential smoothing method combined with a quadratic regression model.
The findings from our DCF analysis reveal that the expansion opportunity in the Lisbon market is actually profitable. The company will face negative results in the first two
1 Grupo Barcelos is a food-product holding group. Its headquarters are in Angra do Heroismo, Azores. 2
Market penetration rate is a measure for brand adoption. It is defined as the number of people who buy a specific brand, at least once in a given period, compared to the total theoretical market.
2 years, however the overall opportunity presents a positive result of almost three million euros.
The rest of this work project proceeds as follows. The next section provides a brief overview of the company. Then, we conduct an industry analysis where we examine macro-economic factors influencing and inhibiting the growth of the yogurt market in Portugal. We also conduct a Porter’s five forces analysis to offer insights on the market competition through its value chain as well as a SWOT analysis. In section 4 we present our spreadsheet model methodology and we discuss our results in section 5. Finally, section 6 offers conclusions.
2. Company background
Quinta dos Açores public image focuses on its manufacturing know-how and the controlled quality and freshness of its raw materials. The company produces its yoghurts with an ultra-filtration technology that allows them to have higher protein value than its competitors, without adding extra inputs. In addition, QA yoghurts are made exclusively of milk and fruit pulp. The company vision is actually “We know how to do it organically” (“saber fazer natural”, in Portuguese). Quinta dos Açores also uses Pure-Pak® packaging and aseptic filling techniques that ensure a longer shelf life of its perishable products3.
Quinta dos Açores has from the beginning engaged in a marketing strategy that focus mostly on product differentiation targeting a premium niche market. The firm positioned its yoghurts as a gourmet “Made in Portugal” product, highlighting the Azorean origin of its ingredients. The firm also developed a very transparent and multidimensional communication plan with its end-consumers. For example the company allows consumers to tour its production facilities without previous scheduling. Some production departments have even glass walls so that visitors can observe directly the production process and therefore, experience a more engaging visit. In addition, the company has also at its headquarters a restaurant and a regional market where consumers may find not only QA products but also other “made in Azores” products. The company has recently opened its second restaurant in S. Miguel Island, given the success of the first restaurant at its headquarters.
3 Pure-Pak® packaging is a carton recyclable beverage container. The odor and taste free packaging maximizes product shelf life due to optimized barrier properties for light and oxygen protection.
3 Quinta dos Açores communication plan focus on raising brand awareness. The ultimate goal is to inform consumers about QA products, highlighting its quality and stimulating demand. The program is based on sales promotions at the P-O-S, sponsorships and events. However, the company has also made efforts to use alternative marketing channels such as billboards and digital marketing (through its Facebook page and official website) to create greater brand awareness. The company pricing strategy is also aligned with the industry practices.
Currently the company holds a market share both in Azores and Portugal mainland, with store formats that include supermarkets and local stores. In particular, the company sells its products in thirteen different locations: six INSCO Group stores (the group that owns the Continente supermarkets in Azores), located in three different islands of Azores; the Emater Group which has three supermarkets in Terceira Island; the Almeida group which has one store in Pico and one store in São Jorge Island; its regional products store at QA headquarters and Lisbon’ El Corte Ingles supermarket.
2.1 Quinta dos Açores consumers
In order to understand Quinta dos Açores current market position, we conducted a survey on different aspects of the company and its products. The survey involved running a local and in person questioner to 100 random consumers in Terceira Island. Quinta dos Açores oldest point-of-sale is located in Terceira Island, which is also where the company holds its headquarters.
Our results from the survey reveal that Quinta dos Açores has currently a market penetration rate of 67%. This rate is higher for women (69.7%) than for man (61.8%). The company is operating in the Terceira market for three years now. It is a local brand and thus a higher market penetration rate was expected. The main reasons highlighted for a lower than expected brand adoption include the consumers’ low-involvement in the yoghurt purchase and the preference for already established brands. Actually, yoghurt is the most planned food category. According to Kantar Worldpanel (2012), 62% of shoppers decide which yoghurt segment and brand to buy before entering a supermarket.
One of the biggest concerns that emerged from the survey is the low consumption frequency of QA yoghurts. The results show that only 18% of the interviewed
4 consumers claim to consume Quinta dos Açores yoghurts on a regular basis4. In particular, 42% of individuals state that they have already tried the product once but never consumed it again while 40% consume the product in a monthly basis. The three main reasons mentioned for such low-frequency consumption were the price (41.5%); preference for already established brands (16%) and poor store product availability (11%). Another issue pointed out by several QA consumers was the functionality of the current packaging. In particular, 12.4% of the interviewed consumers recommended a more functional packaging. The most regular consumers are females with an income between 1,000 euros and 2,000 euros and males with an income higher than 2,000 euros5.
Finally, when asked to describe Quinta dos Açores brand, the most frequent keywords mentioned by the consumers in our sample were quality, innovation and Azorean
product. This in turn seems to suggest that Quinta dos Açores communication plan is
effective and that, at least in the Azorean market, the company is achieving its aimed product positioning.
3. The Portuguese Yoghurt Market
Yoghurt is a dairy product resulting of a controlled milk fermentation process. Special bacteria are added to the milk that changes its texture and gives it unique properties – it is a source of calcium and vitamins and improves digestion. Plain yoghurt is typically produced from whole, low-fat or non-fat milk without additional flavoring ingredients. Flavored yoghurt has sugar, artificial flavoring or added natural fruit (or both).
In 2013, the retail sales of yoghurt and sour milk products reached 529 million euros and sales volume were over 195,800,000 kg in the Portuguese market. The drinkable yoghurt segment generated 52% of this revenue vis-à-vis the 48% generated by the spoonable yoghurt.6 The industry 2008-2013 CAGR was -0,8%7. The main reason for a decreasing industry growth rate is the decrease in the consumption per capita of spoonable yoghurt. Spoonable yoghurt 2008-2013 CAGR was -4.9%. In contrast, drinkable yoghurt 2008-2013 CAGR was 2.3%. A possible reason for the market
4 From the survey conducted, 16% of the interviewed population claim they consume Quinta dos Açores yoghurts on a weekly basis and 2% consume it on a daily-basis.
5 We define as the most regular consumers, the class of consumers that has a higher weekly consumption rate.
6 Euromonitor International report: Yoghurt and Sour Milk Products in Portugal, January 2014. 7
5 performance of these two types of yoghurts is related to the fact that drinkable yoghurt is a more suitable product for on-the-go consumption, fitting better the busy lifestyles of consumers in large cities.
Health concerns and changes in the consumers’ tastes for healthier food products are two of the factors driving the market in the last few years.8 The current economic crisis has also been mentioned as another factor that may have led to some changes in the eating habits of many households. Nowadays, it is quite common for Portuguese households to bring their meals to work. Since drinkable yoghurt is a ready to eat and portable product, it has heavily capitalized on this trend. However, the Portuguese yoghurt market exists for almost one hundred years. According to the Product Life Cycle theory, a market with this time frame categorizes as a mature market. This limits growth opportunities in the category.
3.1 Porter Five Forces Analysis
According to Porter (2008), the structure of an industry is determined by how its economic value is divided along the value chain as well as the extent to which it is limited by substitute products and constrained by potential new entrants. These competitive forces are the underlying drivers of industry participants’ profitability and the foundation for their rivalry. As so, we conduct a Porter Five Forces analysis to discuss the Portuguese yoghurt market profitability.
Suppliers
In the drinkable yoghurt industry there are two main sets of suppliers: the dairy farms and the additional toppings suppliers. The dairy farms supply milk. The additional toppings suppliers sell all the other products used in yoghurt production, such as sugar and fruit or packaging. Dairy farms have major influence over yoghurt producers as they supply a critical input, milk. Milk has no substitutes. Additionally as they do not depend on the yoghurt industry for its revenues (since milk can be sold to other dairy products manufacturers), dairy farms have high bargaining power. However, the milk suppliers’ market is highly fragmented (see exhibit 8) and yoghurt industry participants face no switching costs in changing suppliers. The second set of suppliers, sell similar production inputs. These are widely available at highly competitive prices, making it easier to mix and match inputs. The industry’s profitability is not affected by suppliers.
8
6 Buyers
Yoghurt producers have one main buyer: in-store retailers. Although yoghurt is a common product in the domestic retailers’ portfolio, retailers’ shelf space is a finite resource and there are many different brands they can choose to sell, including their own. In addition, the number of retailers is highly concentrated. The six leading modern distributors have grown to represent nearly 93% of the yoghurt category value. The main distributors in the market include Sonae and Jerónimo Martins with 39% and 19%, respectively (Kantar Worldpanel, 2012). However, end-consumer loyalty may force retailers to stock specific brands.
Threat of new entrants
There is a very low threat of new entrants, due to high barriers to entry. The major players, such as Danone or Lactogal, have already developed extensive product portfolios and built brands with large marketing and advertising budgets, meaning that one would have to invest a significant amount of resources to generate sufficient consumer awareness. Geographic factors also limit competition since dairy products are highly perishable and require a high turnover and a reliable supply chain. Additionally, the growing promotional activity has pressured operating margins and thus, heightened the need for economies of scale in production, which further increases the capital requirements for aspiring entrants.
Threat of substitutes
The threat of substitutes is also negligible. Compared to other products, yoghurts offer a very competitive price-quality trade-off, being perceived as practical, tasty and yet healthy snacks which diversity and low price greatly encourage daily consumption (TNS, 2012). There is however some substitute snacks, such as smoothies or small flavored milk packages, which can be used for the same purpose within the same price range. It is also possible for consumers to replace conventional milk products with vegetable alternatives, such as soya milk, almond milk, rice milk, oat milk and coconut milk. Yet, these alternatives to cow milk products represent only a marginal market share and are often relatively expensive.
7 Internal Rivalry
The industry Herfindahl-Hirschman Index is approximately 0.11. This suggests a fierce monopolistic competitive industry. Danone Portugal SA leads the yoghurt industry with 30% market share.9 The company leads in both drinkable and spoonable categories. Danone offers a wide range of well-known and well-established brands, including Activia, Actimel, Dan’Up, Corpos, Puro and Danacol. The company benefits from its long-standing presence on the Portuguese market as well as on a strong distribution network and a substantial marketing budget. Lactogal SA and Lactalis Nestlé Produits Frais are the second and third leading players in the industry. They each hold a market share of 8%. Both companies enjoy strong consumer loyalty due to a long-standing presence in the market. Private labels excel in terms of growth. They represent 13% of total yoghurt sales in 2013.
Figure 1: Company Market Shares in the Portuguese yoghurt industry
Source: Euromonitor,2014
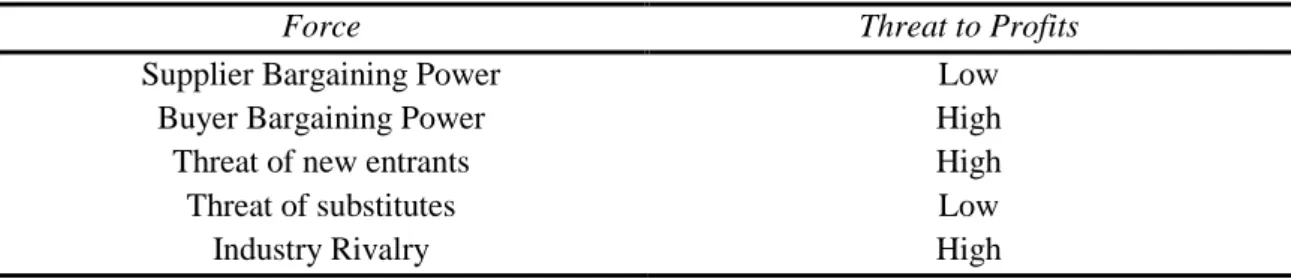
Strategies for coping with the Five forces
Table 2 summarizes how the five forces affect the profitability of the Portuguese yoghurt industry. How can a firm succeed? Entry and competition is a sort of trial-and-error process. Entrants are attracted by the prospect of being able to differentiate their products capitalizing on current trends and by charging high prices. Only a few entrants
9 Source: Euromonitor International report: Yoghurt and Sour Milk Products in Portugal, January 2014. Danone Portugal SA 30.30% Lactogal SA; 840% Lactalis Nestlé Produits Frais; 8.10% GL Importação e Exportação SA; 6% Jerónimo Martins Distribuição de Produtos de Consumo Lda; 4.90% Sonae Modelo Continente Hipermercados SA; 4% Unilever Jerónimo Martins Lda; 3.60% Gelgurte; 2.90% Nestlé Portugal SA;
2.80% Lidl; 2.10% Clesa Portugal;
1.10%
8 will establish the connection with retailers required to reach the final consumers and only a few of these will have successful placements. As a result, only a small percentage of entrants will actually enjoy sustained success. Cooperation among firms and their suppliers may improve productivity and sales for both.
Table 2: Five Forces Analysis of the Portuguese yoghurt industry
Force Threat to Profits
Supplier Bargaining Power Low
Buyer Bargaining Power High
Threat of new entrants High
Threat of substitutes Low
Industry Rivalry High
3.2 SWOT Analysis
We will perform a SWOT analysis to identify the key internal and external factors that may impact Quinta dos Açores expansion opportunity success. This analysis has two main purposes. First we aim to determine any possible competitive advantages Quinta dos Açores may have in the market segment, by matching its strengths to the market opportunities. Additionally we will identify possible weaknesses or threats so the company can, in the future, define strategies either to minimize or to convert weaknesses into strengths or opportunities. Table 3 presents the SWOT analysis of Quinta dos Açores opportunity to expand its retailer network in Lisbon.
From the analysis of Table 3, it is clear that an on-the-go product is a today’s trend in the market. Consumers look for healthy products in convenient formats that can be taken everywhere. Quinta dos Açores yoghurts fits definitely this profile. However, there are imminent threats than can’t be disregarded. QA is not a very well-known brand while charging similar prices to the already established brands. Its marketing budget has no comparable range to the incumbents’ budget. It will be quite challenging to raise brand awareness.
9 Table 3: Quinta dos Açores SWOT analysis
Strengths Weaknesses
o Perceived as a quality brand due to the usage of Azorean milk as a raw material – as is conveyed by the brand name;
o Differentiating packaging; o Niche market positioning.
o Unknown brand with a smaller communication budget compared to other players;
o Location of QA production facilities implying higher transportation costs for product placement in the continental market when compared with competitors and a reduced capacity for immediate response to ad-hoc orders and deliveries.
o Highly perishable market due to its cold chain dependency. Since Quinta dos Açores production facilities are located in Azores, its products are available for a smaller period of time than its competitors in stores, due to days needed for placement of products in Continental Portugal (transportation via sea or air).
Opportunity Threats
o Increased awareness of the Portuguese population regarding healthy eating habits fueled by the consumption of quality products and quality domestic goods;10
o Campaigns to promote the Azores and the consumption of Azorean products developed by the Portuguese and the Azorean Government;
o Drinkable yoghurts account for 52% of the sectors revenues and for which is forecasted a growing trend.
o Constant introduction of product innovations in the different segments by competitors;
o Mature market, where growth of new brands is mostly done at the expense of already existing ones;
o Power of private labels, accounting for 13% of the market with diversified and cheaper offerings
4. The Spreadsheet Model
This section develops a forecasting model of Quinta dos Açores yoghurt production. The goal of this model is to examine the company’s production and forecast its future sales. In addition, we study the feasibility of Quinta dos Açores expanding its retailer network in Lisbon by developing a Discounted Cash Flow (DCF) model. To complement our analysis we also present a sensitivity analysis of changes in the company’s revenue growth rate.
10
10 4.1 Forecasting Production
We had access to QA monthly yoghurt production data from 2012 to 2014. We then used this data to develop a time series forecasting model to extrapolate future production. The general form of the forecasting model developed is represented as follows:
̂ ( ) (1)
where ̂ represents the predicted value for Quinta dos Açores production in time period t+1 and represents the actual production value in period t.
There are several methods for modeling time series data. In most cases it’s impossible to know in advance which method will be more effective. Therefore, we tried several modeling techniques and evaluated how well they explained the past behavior of the company’s production. The selection criteria used to determine which of the techniques was the most accurate included the mean absolute deviation (MAD), the absolute percentage error (MAPE), the mean square error (MSE) and the coefficient of determination ( ). These measures are defined as follows:
∑| ̂ | (2)
∑ | ̂| (3)
∑( ̂ ) (4)
∑ ( ̅)
∑ ( ̂ ̅) (5)
Note that in equations (2)-(5), stands for the actual value of production in period t while ̂ is the forecasted value for production, ̅ is the mean of these values and n is total number of observations in our dataset.
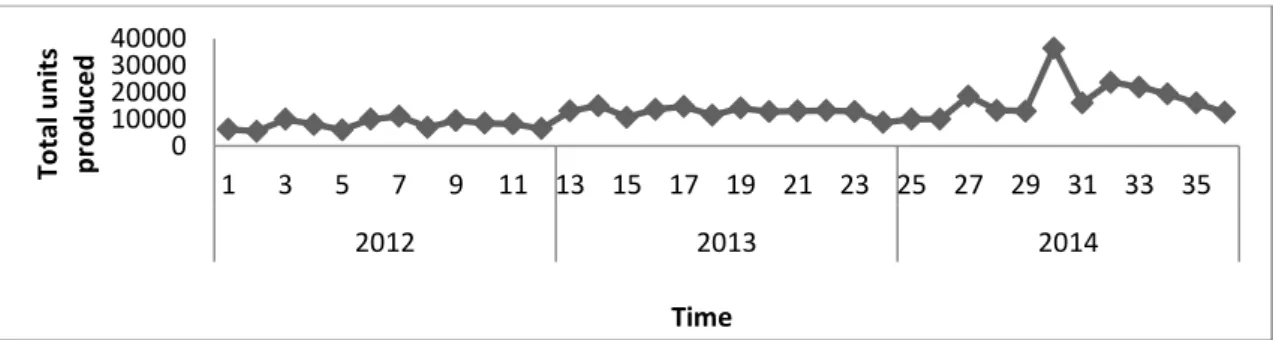
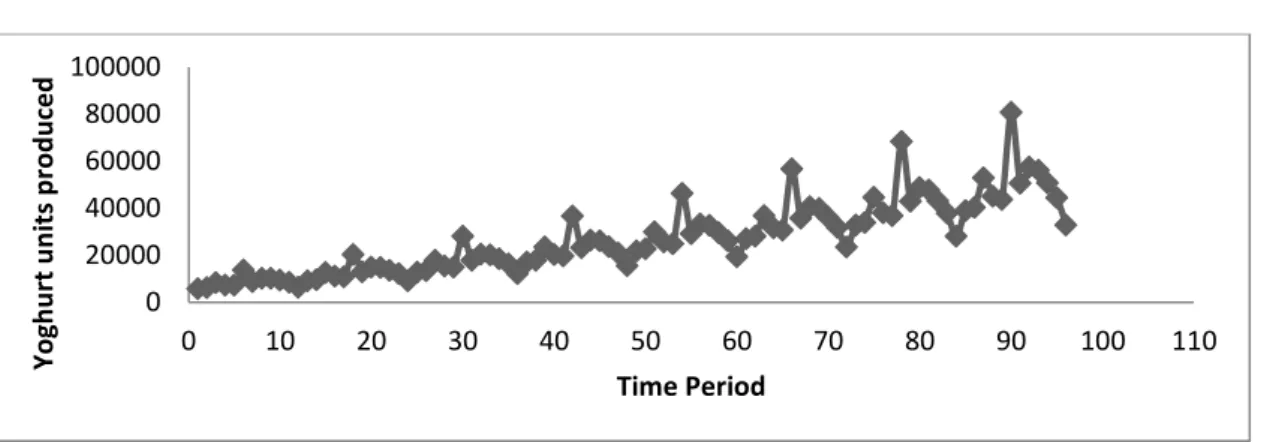
Graph 4 plots Quinta dos Açores past production. Note that this graph suggests a slight upward trend in the data and continuing quarterly patterns.
11 Graph 4: Quinta dos Açores yoghurt production from 2012 to 2014
Next, we investigated whether our time series process was stationarity. There are two types of stationarity: strict stationarity and weak/covariance stationarity. A process is said to be strictly stationary if its distribution is the same over time. Since there are no methods available for testing if financial data is strict stationary we focused on covariance stationarity. A process is said to be covariance stationary if its mean and variance are constant over time and the covariance of two of its elements depends only on the time interval between them, and not on the moment in time in which those elements were collected. Formally, the three conditions of weak stationarity that must be met are:
( ) (6)
( ) (7)
( ) (8) To examine whether Quinta dos Açores production process is stationary we then computed the autocorrelation values between the observed production and its lagged values as
( )
(9) where represents the autocorrelation value for the time lag h, t is the time period and
is the variance. If the time series is stationary, then must be met. Stationarity is an important prerequisite for being able to statistically learn from time series data. However, many series exhibit either trend and/or seasonal effects. Decomposition procedures are then used to describe the trend and seasonal factors. We used the decomposition method to estimate the seasonally adjusted production values
0 2000 4000 6000 8000 10000 12000 14000 0 5 10 15 20 25 30 35 40 Yogh u rt u n its p ro d u ce d Time
12 and separate the underlying pattern in the data series from randomness. The underlying pattern can then be projected into the future and used as forecast. The following two structures are usually considered for basic decomposition models:
̂ (10)
̂ (11)
The decomposition divides the dataset into four components: a trend (T) that captures the change in the mean of the series, a seasonal (S) component that captures the repetition of a pattern in the series after some fixed time interval, a cycle (C) component that captures a repeating pattern with unknown and/or changing periodicity and an error (E) component.
As our production data has a time frame of three years, the cyclicality and the error components are disregarded in our analysis. The cyclic pattern is usually of at least two years and isn’t visible when analyzing data for a period inferior to five years. Additionally, to accurately state that a change in the data pattern was caused by the error component, a minimum time frame of ten years is necessary. Given our previous discussion, our model displays one of the following two structures:
̂ (12)
̂ (13)
Equations (10) and (12) represent the additive decomposition model and equations (11) and (13) the multiplicative. The additive model is useful when the seasonal variation is relatively constant over time. The multiplicative model is useful when the seasonal variation increases over time. To determine which model better fits our data we run both (12) and (13) and selected the model based on the criteria discussed in (2)-(5).
There are several methods to decompose time series. Examples include the moving average method, the Holt’s method and exponential smoothing methods. When the time series is stationary, the moving averages technique or the simple exponential smoothing are the most appropriate modeling methods. Yet as both techniques use some average of the previous values to forecast future values, they consistently underestimate the actual values when there is an upward trend in the data. Therefore, one should use instead the Double Moving Average (DMA) technique, the double exponential smoothing technique (also known as Holt’s method) or Holt-Winter’s method when the time series exhibit clear trend.
13 With the Moving Average (MA) technique, the predicted value for production in period
t+1 results of the average of a subset of past periods production values:
̂
(14) The value of k determines how many past observations should be included in the moving average. No general method exists to determine which value of k is best for a particular time series. As such we tried several values of k and selected the optimum value with selection criteria (4). One drawback of the MA technique is that all past data is weighted equally and we can often obtain a more accurate forecast by assigning different weights to the data. The Weighted Moving Averages (WMA) is a simple variation of the MA technique that allows for weights to be assigned to the data being averaged. In WMA technique the forecasting function is represented by:
̂ (15)
where and ∑ . In addition to determining the value of k, we must also determine the values of the weights that minimize the MSE.
Exponential Smoothing (ES) is another averaging technique for stationary data that allows weights to be assigned to past data. ES models assume the following form:
̂ ̂ ( ̂) (16)
Equation (16) indicates that the predicted value for time period t+1 is equal to the predicted value for t plus an adjustment of the error made in predicting the previous period’s value. The parameter can assume any value between 0 and 1.
Our next step was to define a decomposition procedure that yield an explicit trend. This was done based on the seasonality adjusted data. To model the trend in our data we tested several types of relationships between production and time using Excels’
trend-line function. We then chose the relationship with the highest goodness-to-fit based on
14 Table 5: Relationships between production and time
Linear ̂
Exponential ̂
Logarithmic ̂ ( )
Quadratic ̂
Power ̂
with a,b and c constants, t representing time period and ̂ is the forecasted value.
4.2 Discounted Cash Flow Model
To examine the feasibility of expanding in the Lisbon market, given QA production forecasts for 2015 to 2019, we developed a two-stage Discounted Cash Flow (DCF) model. The discounted cash flow analysis estimates the net present value (NPV) of the projected cash flows net of the cash needed for generating the expected growth. The first stage of the DCF model is a period of explicit forecast, while the second stage, the terminal value, assumes that the cash flows grow at a constant perpetual growth rate. The terminal value reflects the benefit of the cash flows from the end of the forecast period into perpetuity. The model can be represented as follows:
∑ ( ) ( )
( ) ( )
(17)
where represents the Free Cash Flow of year t, is the discount rate, is the revenue growth rate and is the tax rate. is measured in euros.
The DCF method of valuation involves projecting FCF over the period of interest, calculating the terminal value at the end of that period, and discounting the projected FCFs and terminal value using the discount rate to arrive at the NPV of the total expected cash flows of the business opportunity.
4.3 Calibration
Next, we explain how the calibration of the parameters for the DCF analysis was done. Let t represent the time period (measured in years) with t=1 representing the current year (2015). The sales values for 2012, 2013 and 2014 were set to the values QA reported for each of those years. The sales values for 2015 to 2019 were projected based
15 on the results of section 4.1, QA operational costs presented in table 4 and on the assumption that 100% of Quinta dos Açores forecasted net production represents actual sales.
Net production refers to the number of units produced net production losses. It is considered a production loss any product that cannot be sold to the final consumer due to faulty production11. The assumption relating net production to sales was based on the company’s current situation. The company is currently selling 100% of all the yoghurt available for sale. We therefore assumed this situation would remain unchanged for the forecasting horizon to simplify our calculations.
Table 6 presents Quinta dos Açores 2014 Operational structure. Data on table 16 was provided to us directly by the company.
Table 16: Quinta dos Açores 2014 operational structure
Transportation costs per unit 0.06 € Production costs per QA Regular yoghurt unit 0.25 € Production costs per QA Elegant yoghurt unit 0.29 € Regular yoghurt average selling price 0.53 € Elegant yoghurt average selling price 0.49 €
Distributers Margin 20%
To simplify our calculations, we also assumed that QA operational structure remained constant throughout the forecasting horizon. Additionally, we had no particular reason to believe that this structure would suffer changes from 2014 to 2015. Thus, we assumed both the cost structure and the selling price presented on table 4 for the year 201512. Furthermore, the company has already determined that its marketing expenditures would stay unchanged for the next 5 years. As such we held those expenses at 30,000 euros.
We also assumed QA is already satisfying 100% of the demand of its current points-of-sale. Thus any additional production should be sold through additional retailers. Since 100% of demand is assumed to be already fulfilled, we kept the yoghurt orders for the
11
Faulty production occurs when the final product differs from its design specifications during the production process.
12 Quinta dos Açores transportation costs have been the same since production start. The company has already established transportation partners that carry their entire product offering to the Portuguese mainland. Additionally the firm already established a distribution partner that is responsible for product delivering once it reaches the Lisbon port. There is no reason to believe any of these costs will change.
16 current retailers at the levels of 2014. In particular, we assumed that current retailers would order 158,104 units of the regular yoghurt and 151,000 units of the elegant yoghurt during our forecasting horizon.
The revenue growth rate ( ) used in our benchmark to project QA FCF and terminal value was set to Euromonitor drinkable yoghurt CAGR projection for 2013 to 2018 – 1.3%. Later, we performed comparative statics of this parameter by changing its value between 0.5% and 2%. The interest rate( ) to discount the cash flows was set to 2,4% which is the current Portuguese risk-free rate.13 The tax rate was set to 16.8% for the entire forecasted period as it is the current tax rate charged by the Azorean Government14. We assumed this tax rate remained constant as it is the preferred policy of the Azorean Government.
A 5 years period projection was also chosen based on two criteria: size of the firm and magnitude and sustainability of competitive advantages. These criteria were based on New York Stern Business School research on the DCF model. Common DCF models are built with 5 to 10 years projection periods. As Quinta dos Açores is a small firm, it’s likely to earn excess returns and maintain these excess returns than otherwise similar larger firms as it has more room to grow. Smaller entrant firms have the potential for high growth (at least in revenues) over a longer period. However, because the Portuguese yoghurt market is competitive and there are incumbent firms with sustainable competitive advantages that may attempt to strategically block Quinta dos Açores, if they prove to have a successful product, a time-frame beyond 5 years is not reliable.
Next, we present the results of our analysis.
5. Discussion of Results
5.1 Production Forecast
Quinta dos Açores produces two types of yoghurt: the regular yoghurt and the non-fat yoghurt, also known as elegant. The two products have different production costs and prices. To ensure the accuracy of our DCF analysis we performed separate forecasts for each yoghurt using the procedures described in section 4.1.
13 Source: Bloomberg.
14
17 Regular Yoghurt Production
The regular yoghurt production plot highlights two interesting features of our data. On the one hand it shows that there is signs of seasonality as there are three repetitive patterns over the three years for which we gather data. Graph 7 also reveals the existence of a slight upward trend.
Graph 7: Total regular yoghurts units produced by Quinta dos Açores
Graph 8 shows the regular yoghurt production data auto-correlation. The graph reveals that autocorrelation values are between -1 and 1 and are exponentially close to zero. Thus, we conclude our dataset is stationary. Based on our discussion in section 4.1., the models we applied next were the moving averages or exponential smoothing.
Graph 8: Quinta dos Açores data Auto-Correlation plotted
We start by applying the Moving Average (MA) technique. We run (14) for k=2 ;3; 4. The k=3 is selected as it minimized the MSE15
Table 9: k determination for MA technique
k=2 k=3 k=4
MSE 28,798,187.5 24,218,758.5 26,434,190
15 It’s uncommon to apply a .
0 10000 20000 30000 40000 1 3 5 7 9 11 13 15 17 19 21 23 25 27 29 31 33 35 2012 2013 2014 To tal u n its p rod u ce d Time -0,2 0 0,2 0,4 0,6 1 2 3 4 5 6 7 8 9 10111213141516171819202122232425262728293031323334 A u to co rr e lation Va lu es Lag
18 We proceed to model the raw data with the Weighted Moving Average (WMA) technique. Again we use k=3 as it was proven to minimize the MSE. We run (15) and use Excel’s Solver to determine the optimal weights of each of the 3 months averaged. The three optimal weights are calculated to minimize the MSE. The results obtained were the following: .
Then, we run (16) to exponentially smooth our data according to section 4.1. We use Solver Settings to calculate the optimal value of that minimizes the MSE. The result was .
Table 10 shows the decision criteria (2)-(4) for the three models described above: Table 10: MSE, MAPE and MAD of the modeling techniques for stationary data
Technique MAD MAPE MSE
Moving Average (k=3) 2,805.96 19.11 24,218,759 Weighted Moving Averages (k=3) 2,743.21 18.74 23,093,640 Exponential Smoothing 2,872.57 19.93 24,472,800
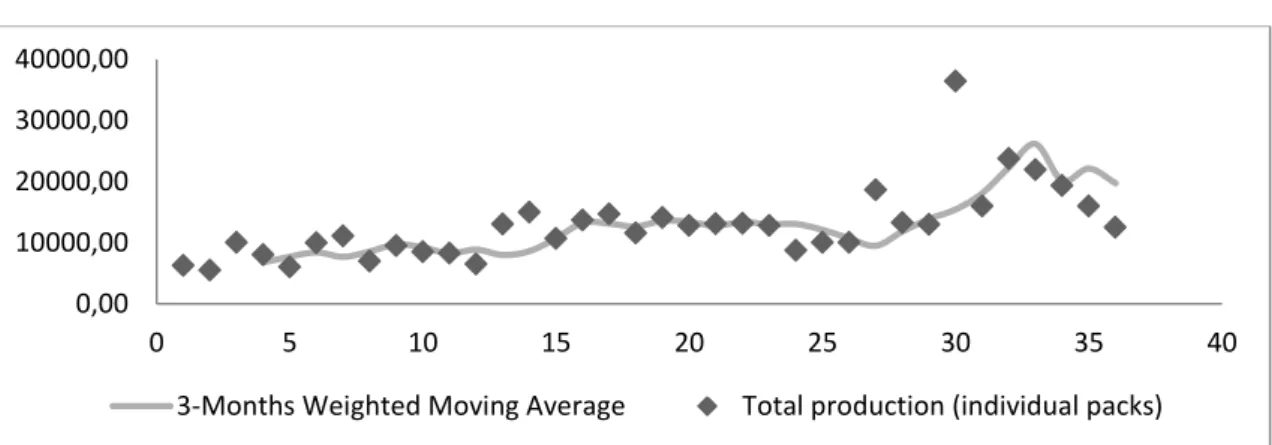
We will build our seasonal component forecast based on the Weighted Moving Average technique as it has the highest fit to our data. The WMA presents the lower values under our three model selection criteria. WMA forecast are plotted below:
Graph 11: Total yoghurts units produced smoothed by its seasonality component
To model the trend in our data we test several types of relationships between production and time, as presented in section 4.1 based on graph 4 seasonality adjusted data.
0,00 10000,00 20000,00 30000,00 40000,00 0 5 10 15 20 25 30 35 40
19 Table 12: Trend estimation of deseasonalized Quinta dos Açores production data
Equation Linear: Y = 418.23t + 4443.3 0.705 Exponential: Y= 6397.4e0,0316t 0.77 Logarithmic: Y = 6100.9ln(t) – 4557 0.58 Polynomial: Y = 12.87t2 - 96,578t + 8424,5 0.75 Power: Y = 3052.6t0,4823 0.7
The exponential equation is chosen as it presents the highest . To simplify our calculations we linearize the exponential equation applying a logarithmic transformation:
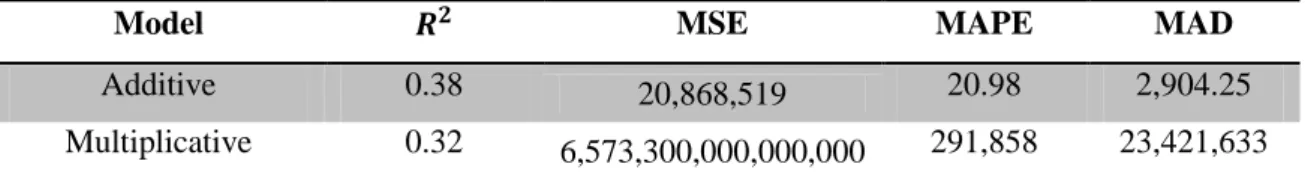
( ) ( ) ( ) ( ) (18) Finally, we test both the additive and multiplicative model and forecast the production for the period between 2015 and 2019 using the model with the highest goodness-to-fit. Table 13 shows the results of such analysis.
Table 13: Goodness-to-fit comparison between additive and multiplicative models
Model MSE MAPE MAD
Additive 0.38 20,868,519 20.98 2,904.25
Multiplicative 0.32 6,573,300,000,000,000 291,858 23,421,633
Unfortunately, neither decomposition model presents a good fit to Quinta dos Açores production data. Both have exceptionally high error values and low levels. This implies that the models developed previously are not explaining the variability observed in the company production. So we run the alternative models presented in section 4.1 to investigate if any of them provides a better fit. Table 14 shows the results of this additional investigation.
From table 14 we conclude that the Quadratic trend model with multiplicative seasonal indices provides the most accurate explanation of QA regular yoghurt past production data. As such we proceed to forecast QA production using this alternative methodology.
20 Table 14: MSE and of alternative forecasting techniques for data that present
trend and seasonal effects
Model MSE
Double moving average 0.13 274,984,968
Holt’s method 0.33 24,461,243
Holt-winter method for additive seasonal data 0.2 31,393,043 Holt-winter method for multiplicative seasonal data 0.26 29,835,638 Linear trend with additive seasonal indexes 0.43 21,507,309 Linear trend with multiplicative seasonal indexes 0.47 18,365,377 Quadratic trend with additive seasonal indexes 0.43 19,122,800 Quadratic trend with multiplicative seasonal indexes 0.74 8,701,190 To build our forecast model we started by fitting a curved trend line to the data using the following quadratic model:
(19)
The resulting estimated regression function for this model is:
̂ (20)
We obtain the values for using Excel’ Regression command and determine the estimated production level for each time period using Excel’ TREND formula. We derived the following regression:
̂ .02 (21)
We then proceed to obtain the seasonal index for each month by computing the average of the actual production values as a percentage of trend (21). These values are then optimized to minimize MSE using Solver function. We use seasonal indices to adjust trend projections of future periods for the expected effect of seasonality. To adjust the trend forecasts of equation (21), we multiply each of them by the appropriate seasonal index. Therefore, based on the seasonal indices and equation (21) we forecast Quinta dos Açores regular yoghurt production for 2015 to 2019:
21 Graph 15: Quinta dos Açores Production Forecast for 2012 to 2019
Elegant Yoghurt Production
To forecast Quinta dos Açores Elegant yoghurt production from 2015 to 2019 we follow a similar procedure to the one presented previously. The autocorrelation plot of the Elegant yoghurt production presents a very similar pattern to graph 7. The auto-correlation terms are again near zero for all time-lag separations and in-between the critical values. Thus we can conclude that this dataset is also stationary.
Graph 16: Quinta dos Açores data Auto-Correlation plotted (EL)
As we are dealing with stationary data once more, the methodology we follow is the same as we applied in previous dataset. Again k=3 minimized the MSE the Moving Average procedure.
Table 17: MSE, MAPE and MAD of stationary data modeling techniques
Technique MAD MAPE MSE
Moving Average (k=3) 2,906.31 24.01 14,715,789 Weighted Moving Averages (k=3) 2,890.60 23.94 13,881,327
Exponential Smoothing 2,765.59 23.20 13,623,313 0 20000 40000 60000 80000 100000 0 10 20 30 40 50 60 70 80 90 100 110 Yogh u rt u n its p ro d u ce d Time Period -0,2 0 0,2 0,4 0,6 1 2 3 4 5 6 7 8 9 10111213141516171819202122232425262728293031323334 A u to co rr e lation Va lu es Lag
22 The Exponential Smoothing is the technique that better fits the data as it has the lower values for all three decision measures. Once deseasonalized the data we capture the trend component using the methods described in section 4.1. You can find the decomposed time series and a table comparing the fit of all possible relationships between the data in appendix a and b correspondently. The equation with the higher for this second dataset is the following:
(22)
To conclude we test both additive and multiplicative models as you can check in appendix 10. The selected forecasting model is:
̂ (23)
where, (104)
(25)
Using the model in equation (22) we forecast Quinta dos Açores Elegant yoghurt production for 2015 to 2019.
Graph 18: Quinta dos Açores Elegant yoghurt Production Forecast for 2012-2019
5.2. From Production to forecasting Sales
Based on the results from subsection 5.1, and section 4.1 assumptions, we extrapolate Quinta dos Açores sales for our period of interest, 2015 to 2019.
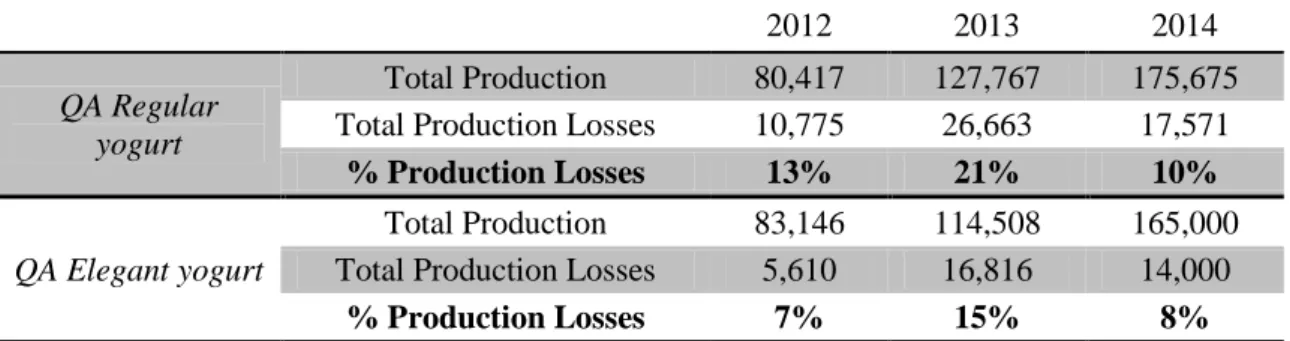
To forecast the production losses from 2015 to 2019 we estimate a linear regression, based on the production losses so far. Given our very short dataset, we designed the forecast using percentage production losses to more accurately forecast the production errors. Again we forecasted production losses individually to each yoghurt type.
0 20000 40000 60000 80000 100000 120000 1 6 11 16 21 26 31 36 41 46 51 56 61 66 71 76 81 86 91 96 El e gan t yo gh u rt u n its p rod u ce d Time
23 Table 19: Quinta dos Açores yoghurt production losses
2012 2013 2014
QA Regular yogurt
Total Production 80,417 127,767 175,675 Total Production Losses 10,775 26,663 17,571
% Production Losses 13% 21% 10%
QA Elegant yogurt
Total Production 83,146 114,508 165,000 Total Production Losses 5,610 16,816 14,000
% Production Losses 7% 15% 8%
We plot the percentage production losses values highlighted in table 19 and use Excel’
trend line function to determine the optimal equation for each yoghurt production:
̂ (116)
̂ = 0.0087t + 0.0823 (27)
where ̂ is the forecasted production loss for the time period t. Equation (26) refers to the production losses of the regular yoghurt and has an R² equal to 0.9863. Equation (27) refers to the production losses of the elegant yoghurt and has an R² of 0.434.
Based on graph 15 and 18, equations (26) and (27) and an industry CAGR projection of 1.3% we present next our forecast for the sales of both yoghurts.
Table 20: Quinta dos Açores Sales Forecast for 2015-2019
2015 2016 2017 2018 2019 QA Regular Yogurt Forcasted Production 270,432 340,787 418,122 502,435 593,729 P. Losses 11% 10% 8% 6% 5% Forecasted Sales 239,738 307,901 384,881 471,033 566,714 Forecasted Sales + Growth 242,855 311,904 389,885 477,156 574,082
QA Elegant Yogurt Forcasted Production 282,964 397,193 538,403 706,593 901,764 P. Losses 12% 13% 13% 14% 15% Forecasted Sales 249,829 347,226 465,988 605,409 764,786 Forecasted Sales + Growth 253,077 351,740 472,046 613,279 774,728 Total Forecasted Sales 495,931 663,644 861,930 1,090,435 1,348,810
5.3 Projections for 2015 to 2019
Based on table 20 and section 4.3 we present our forecast for Quinta dos Açores Profit and Loss Statement for 2015-2019.
24 The return on sales, on every period, is quite low, yet it presents an increasing trend. As costs are constant throughout the 5 year period, Quinta dos Açores Regular yoghurt has a gross profit of 0.11 euros per unit, during the forecasted period. This represents a profit margin of 21%. Quinta dos Açores Elegant yoghurt has a gross profit of 0.04 euros per unit and a profit margin of 8% for the same period16.
Table 21: Quinta dos Açores Profit and Loss Statement for 2015-2019, in 000’€
2015 2016 2017 2018 2019
Forecasting of total Regular yogurt
units sold 242,855 311,904 389,885 477,156 574,082
Past demand 158,104 158,104 158,104 158,104 158,104
Sales at new selling points 84,751 153,800 231,781 319,052 415,978 Total Regular yogurt Sales Revenue 44,917.8 81,513.9 122,843.8 169,097.7 220,468 Total Production Costs 21,357 38,757.5 58,408.8 80,401 104,826.4 Total Transportation Costs 5,085 9,228 13,906.9 19,143 24,958.7
Gross Profit on QA Regular yogurt 18,475.6 33,528.4 50,528.2 69,553.4 90,683
Forecasting of total Elegant yogurt
units sold 253,077 351740 472046 613,279 774,728
Past demand 151,000 151000 151000 151,000 151,000
Sales at new selling points 102,077 200740 321046 462,279 623,728 Total Elegant yogurt Sales Revenue 50,017.7 98 362.75 € 157 312.31 € 226,516.8 305,626.7 Total Production Costs 29,806.4 58 616.17 € 93 745.30 € 134,985.5 182,128.6 Total Transportation Costs 6,124.6 12 044.42 € 19 262.73 € 27,736.8 37,423.9
Gross Profit on QA Elegant yogurt 14,086.6 27 702.16 € 44 304.28 € 63,794.5 86,074.5
Total Sales Revenue 94,935.5 179 876.62 € 280,156 395,614.5 526,094.8 Total Cost of Sales 62,373 118 646.11 € 185,323.6 262,266.6 349,337.3
Gross Profit 32,562 61,230.5 94,832.5 133,348 176,757.6
Operating Expenses
Total Sales and Marketing Expenses 30,000 30,000 30,000 30,000 30,000
Distributers Cost 18,987 35,975 56,031 79 123 105,219
Income from Operations -16,424.9 -4,744.8 8,801.27 24,225 41,538.6
Return on Sales -0.17 -0.03 0.03 0.06 0.08
In 2009, when the company was deciding its pricing strategy, a 30% profit margin on the yoghurt products was stated as the main goal. To reach the target value the company can act in four different ways: 1. make its production process more efficient and so reduce production costs; 2. negotiate with its retailers and sell its products at a higher price; 3. reduce transportation cost per unit and/or 4. renegotiate the distributer margin.
25 The product that needs the highest investment is the elegant yoghurt. It has the highest production costs and sells at a lower price than the regular yoghurt. The profit margin of this yoghurt is too low. The options that have the biggest impact on both yoghurts profit margin are: a decrease of the production costs and of the transportation cost per unit. A decrease of 0.01 euros in either one of these costs would increase both yoghurts profit margin by 2% each. The only additional strategy that improves the elegant yoghurt profit margin by 2% is increasing its selling price to 0.5 euros.
A 30% profit margin is only feasible if the company can lower its production costs to 0.20/0.22 euros per unit. Quinta dos Açores distributer margin is already quite low compared to other perishable products manufacturers17. A transportation price of 0.06 euros is not big enough to sustain an increase to a 30% profit margin. Additionally if the company tried to sell its product at a higher price, given the price increase needed to reach a 30% profit margin, QA yoghurts would no longer be competitive in the market. Based on table 21 and on the parameters presented in section 4.3 we now forecast Quinta dos Açores DCF model. It is presented in table 22.
If Quinta dos Açores decides to start selling its yoghurts in mainstream supermarkets in mainland Portugal, it will have a positive result of 2,941,581.63 €. The company will face negative results in both 2015 and 2016 but the overall opportunity is profitable. Quinta dos Açores is currently selling, on average, 24,000 yogurts per retailer. Assuming that, in Lisbon, the company would have the same average demand it faces on its current POS, in year one it should expand to twenty new points of sale. However this assumption is highly unrealistic given that twelve of QA current POS are located cities with around 10% of Lisbon population. So in order to accurately determine how many retailers Quinta dos Açores should add to its network, the company should use as a comparison base the sales to El Corte Inglês supermarket.
26 Table 22: Quinta dos Açores Discounted Cash Flow analysis, in 000’€
18
The company did not provide us with the real value. We use a fictional value.
Free Cash Flow Build up
Projected Annual Forecast
2015 2016 2017 2018 2020
Period 1 2 3 4 5
Total Income from Operations -16,424.86 -4,744.81 8,801.27 24,225.02 41,538.61
EBIT -22,024.86 -10,344.81 3,201.27 18,625.02 35,938.61
Tax rate 16.8% 16.8% 16.8% 16.8% 16.8%
NOPAT -22,024.86 -10,344.81 2,663.45 15,496.02 29,900.92
Depreciation & Amortization18 5,600.00 5,600.00 5,600.00 5,600.00 5,600.00
Unlevered Free Cash Flow -16,424.86 -4,744.81 8,263.45 21,096.02 35,500.92
Discount Rate 2.4%
Present Value of FCF -16,039.91 -4,525.01 7,695.94 19,186.71 31,531.16
Sum of Present Value of FCF 37,848.90
Terminal Value Growth in perpetuity method
Long term growth rate 1.3%
Discount rate 2.4%
Free Cash Flow (t+1) 31,941.06
Terminal Value 2,903,732.73
Present Value of Terminal Value 2,903,732.73
27 5.4 Sensitivy of forecasts
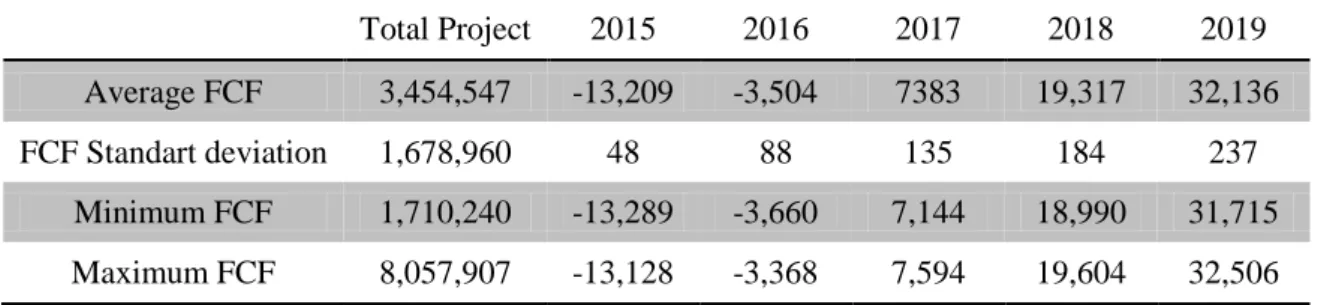
In this section we run a Monte Carlo Simulation (MCS) to account for changes the revenue growth rate (g). We perform comparative static analysis by changing g value between 0.5% and 2% using a continuous uniform distribution. This distribution is chosen as there are no perceptions about a most probable case.
The scenario simulation shows that, the long term results of this project, for an industry CAGR between 0.5% and 2%, will always be positive. Quinta dos Açores should always thrive to sell their products in mainland Portugal. Yet this will imply negative results both in 2015 and 2016. The FCF of the scenario simulation don’t vary much from our benchmark scenario during our 5 year forecasting. In the best case scenario the company can make over 8 Million euros in perpetuity with the project. Worst case scenario Quinta dos Açores profit is a little under 2 Million euros.
Table 23: Summary measures of the Monte Carlo simulation, in 000’€
Total Project 2015 2016 2017 2018 2019 Average FCF 3,454,547 -13,209 -3,504 7383 19,317 32,136 FCF Standart deviation 1,678,960 48 88 135 184 237 Minimum FCF 1,710,240 -13,289 -3,660 7,144 18,990 31,715 Maximum FCF 8,057,907 -13,128 -3,368 7,594 19,604 32,506 6. Conclusions
In this work project we developed a quadratic trend forecasting model with multiplicative seasonal indexes to forecast Quinta dos Açores regular yogurt production and an additive exponential smoothed polynomial trend model to forecast Quinta dos Açores Elegant yogurts. Based on the company past performance we can state that, for the next five years, Quinta dos Açores yoghurt production follows a significant increasing trend. The models developed here can have multiple applications for the firm, varying from inventory management to purchase planning, just to mention a few. Additionally, based on both models, we concluded Quinta dos Açores should expand its retailer network in Lisbon as this project could create up to 3 million euros to the company.
28 References
Albright, S. Christian; Winston, Wayne L. 2009. Management Science Modeling.
South-Western CENGAGE Learning.
Pindyck, Rober S.; Rubinfeld, Daniel L. 1998. Ecometric Models and Econometric Forecast. Singapore. McGraw-Hill Book Co.
Barcelos, Diana da Rocha. 2011. “Case Study: Quinta dos Açores Estratégia integrada
de comunicação para o lançamento da marca Quinta dos Açores”. Católica Lisbon
School of Business and Economics MA Dissertations.
January 2014. “Yoghurt and sour milk products in Portugal”. Market research provider: Euromonitor International.
Barbosa, Mariana; Carvalho, Teresa. 2014 “O iogurte no ciclo da vida.” Portuguese association of nutrition specialist e-book collection, Nº 33.
Gabinete de Planeamento e Políticas. 2007. “Leite e lacticínios, Diagnóstico
sectorial”. Ministério da Agricultura, Desenvolvimento Rural e Pescas publications.
Yildiz, Fatih. 2010. Development and Manufacture of Yogurt and Other Functional Dairy Products. CRC Press Taylor & Francis Group.
Autoridade da Concorrência. October 2010. “Relatório Final sobre Relações
Comerciais entre a Distribuição Alimentar e os seus Fornecedores”.
Anonymous. 2011. “Produtores de Leite Manifestam-se à Porta da Lactogal”, Público.
Porter, Michael E. 2008, “The Five Competitive Forces that Shape Strategy”, Harvard
Business Review, 78-93.
Associação Nacional dos Industriais de Lacticínios e Federação Nacional das Cooperativas de Produtores de Leite. 2011. Memorando conjunto.
Associação Nacional de Industriais de Lacticínios. 2004. O Perfil do consumo no
sector de lacticínios e as estratégias de marketing para o século XXI.
Marktest Investimentos. 2015. “Magros e Líquidos - os principais líderes na categoria
29 Grupo Marktest. 2004. “Consumo de iogurtes”. Consumo/Utilização de bens/serviços/produtos.
Grupo Marktest. 2008. “Sabe quantos portugueses consumiram iogurtes líquidos?” Comportamento do consumidor.
Grupo Marktest. 2013. “Iogurtes líquidos com maior exposição em linear”. Grande distribuição.
Grupo Marktest. 2006. “Perto de 2,5 milhões consomem iogurte líquido”. Consumo/Utilização de bens/serviços/produtos.
30
Appendix
Appendix 1 – Quinta dos Açores product portfolio
Appendix 2 – Yogurt Sales in Portugal from 2008 to 2013, in 000’€
2008 2009 2010 2011 2012 2013 Yoghurt 552,685.2 542,730.2 535,065.6 532,930.3 532,073.8 528,753.6 Drinking Yoghurt 284,955. 288,710.2 293,435.6 297,550.3 301,094.4 304,087.5 Spoonable Yoghurt 267,730.0 254,020.0 241,630.0 235,380.0 230,979.4 224,666.1
Appendix 3 - Yogurt Sales Growth from 2008 to 2013, % Value
2012/2013 2008-13CAGR 2008/13 Total Yoghurt -0.6 -0.9 -4.3 Drinking Yoghurt 1.0 1.3 6.7 Spoonable Yoghurt -2.7 -3.4 -16.1 Fresh Milk 1L Skimmed Semi-skimmed Whole 250 ML Semi-skimmed Skimmed Chocolate Drinking Yogurt 200 ML Slim Regular
Ultra filtrated fresh cheese Pradinho 80gr
Requeijão 125gr
Traditional fresh cheese 70gr/ 95gr
Semi-skimmed Skimmed Cured Cheese Cottage Cheese Soft ripened cheese
Ice Cream 150ml/500m Chocolate Vaunilla Strawberry Doce de leite Queijada da Graciosa D.Amélia
31 Appendix 4 - Yogurt Sales Forecast for 2013 to 2018, % Value Growth
2013-18 CAGR 2013/18 Total
Yoghurt -0,2 -0.8
Drinking Yoghurt 0.4 2.3
Spoonable Yoghurt -1.0 -4.9
Appendix 5 - Yogurt Sales Forecast for 2013 to 2018, % Volume Growth
2013-18 CAGR 2013/18 Total
Yoghurt 1.5 7.9
Drinking Yoghurt 1.6 8.0
Spoonable Yoghurt 1.5 7.7
Appendix 6 – Dairy farm corporate structure per class of economic Dimension
Appendix 7 – Elegant yogurt production smoothed by its seasonality component
0 10000 20000 30000 0 5 10 15 20 25 30 35 40 Units p ro d u ce d Time
32 Appendix 8 – Regular yogurt production data seasonal indexes optimized
Seasonal Month Index 1 85% 2 86% 3 112% 4 94% 5 90% 6 164% 7 101% 8 114% 9 110% 10 98% 11 85% 12 62%
Appendix 9 – Trend estimation of deseasonalized Quinta dos Açores elegant yogurt production data Equation Linear: Y = 322t + 5543.8 0.74 Exponential: Y= 6669.8e0.027t 0.79 Logarithmic: Y = 3189.8ln(t) + 3019.7 0.49 Polynomial: Y = 12.2t2 – 130.98t + 8412.7 0.83 Power: Y = 5262.2t0,27 0.57
Appendix 10 – Goodness-to-fit comparison between additive and multiplicative models, for elegant yogurt production data
Model MSE MAPE MAD
Additive 0.52 11,335,960.7 24.7 2,759