A Modularity-Based Method Reveals Mixed
Modules from Chemical-Gene Heterogeneous
Network
Jianglong Song1‡, Shihuan Tang2‡, Xi Liu1, Yibo Gao1, Hongjun Yang2*, Peng Lu1*
1Institute of Automation, Chinese Academy of Sciences, Beijing, China,2Institute of Chinese Materia Medica, China Academy of Chinese Medical Sciences, Beijing, China
‡These authors contributed equally to this work.
*[email protected](HY);[email protected](PL)
Abstract
For a multicomponent therapy, molecular network is essential to uncover its specific mode of action from a holistic perspective. The molecular system of a Traditional Chinese Medi-cine (TCM) formula can be represented by a 2-class heterogeneous network (2-HN), which typically includes chemical similarities, chemical-target interactions and gene interactions. An important premise of uncovering the molecular mechanism is to identify mixed modules from complex chemical-gene heterogeneous network of a TCM formula. We thus proposed a novel method (MixMod) based on mixed modularity to detect accurate mixed modules from 2-HNs. At first, we compared MixMod with Clauset-Newman-Moore algorithm (CNM), Markov Cluster algorithm (MCL), Infomap and Louvain on benchmark 2-HNs with known module structure. Results showed that MixMod was superior to other methods when 2-HNs had promiscuous module structure. Then these methods were tested on a real drug-target network, in which 88 disease clusters were regarded as real modules. MixMod could identi-fy the most accurate mixed modules from the drug-target 2-HN (normalized mutual informa-tion 0.62 and classificainforma-tion accuracy 0.4524). In the end, MixMod was applied to the 2-HN of Buchang naoxintong capsule (BNC) and detected 49 mixed modules. By using enrich-ment analysis, we investigated five mixed modules that contained primary constituents of BNC intestinal absorption liquid. As a matter of fact, the findings ofin vitroexperiments using BNC intestinal absorption liquid were found to highly accord with previous analysis. Therefore, MixMod is an effective method to detect accurate mixed modules from chemical-gene heterochemical-geneous networks and further uncover the molecular mechanism of multicom-ponent therapies, especially TCM formulae.
Introduction
Since network pharmacology emerged, multicomponent therapy becomes an important aspect of network medicine [1,2]. A fundamental characteristic of multicomponent therapy that a11111
OPEN ACCESS
Citation:Song J, Tang S, Liu X, Gao Y, Yang H, Lu P (2015) A Modularity-Based Method Reveals Mixed Modules from Chemical-Gene Heterogeneous Network. PLoS ONE 10(4): e0125585. doi:10.1371/ journal.pone.0125585
Academic Editor:Byung-Jun Yoon, Texas A&M University, UNITED STATES
Received:December 23, 2014
Accepted:March 24, 2015
Published:April 30, 2015
Copyright:© 2015 Song et al. This is an open access article distributed under the terms of the
Creative Commons Attribution License, which permits unrestricted use, distribution, and reproduction in any medium, provided the original author and source are credited.
Data Availability Statement:All relevant data are within the paper and its Supporting Information files.
Funding:This work was supported by National Science Foundation of China (grant nos. 81303152, 81330086, and 81203005) and the Fundamental Research Funds for the Central public welfare research institutes (grant no. ZZ070830).
differs from conventional drugs is that different components of a therapy usually function in a synergistic manner to relieve complex diseases [3,4]. Thus, TCM (Traditional Chinese Medi-cine) recipes containing hundreds of herbal constituents and mediating thousands of potential targets are essentially multicomponent therapies with empirical efficacy for diverse chronic dis-orders [4,5]. However, the increasing amount of constituents and associated targets leads to unprecedented complexity in the pharmacology research and drug design of multicomponent therapies [6]. In fact, the molecular mechanism of most TCM formulae stay unclear [4]. There-fore, to uncover the mode of action of a classic therapy especially TCM formula is a difficult and urgent task to facilitate the development of multicomponent drug discovery.
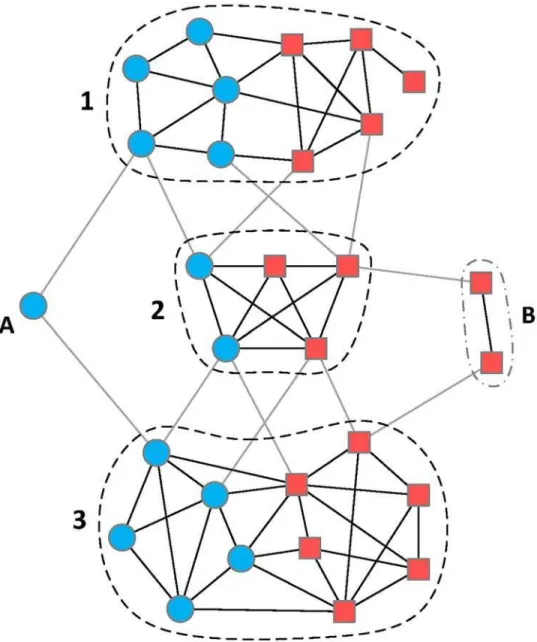
Complex network is an essential and practical tool to model and analyze the molecular sys-tem of a multicomponent therapy [7,8]. For example, a TCM formula usually contains hun-dreds of chemical constituents and these chemicals may regulate thousands of gene targets. Thus the molecular system of this TCM formula could be modeled by a 2-class heterogeneous network (2-HN) in which chemicals and gene targets are nodes and interactions between nodes are considered as links [9]. 2-HN is a kind of graph whose nodes belong to two classes and whose links connect nodes from arbitrary class. However, when the number of nodes in a network reaches high order of magnitude, it costs a lot of efforts to perform qualitative analysis from a holistic perspective. An available solution is to capture the dominant modules within a network using module detection techniques and then analyze these modules with biological knowledge [10–12]. This is based on an assumption that chemicals with similar structures usu-ally share similar functions, namely act on same group of genes. In general, complex processes in a biological system are accomplished by the concerted action of different groups of genes [13–15]. In the chemical-gene heterogeneous network of a multicomponent therapy, the domi-nant modules typically contain both chemicals and gene targets (Fig 1). Such modules are called mixed modules since they contain nodes of two classes (one class is chemical and the other is gene). A mixed module indicates that the chemicals within it achieve certain functions by synergistically regulating the expression of corresponding targets [11]. Therefore, by using module detection methods, we could identify primary mixed modules from a chemical-gene molecular system and further reveal the mode of action underlying each module.
A number of methods have been proposed to detect modules from complex biological net-works. Markov Cluster algorithm (MCL) is one of the earliest methods to identify highly inter-connected modules from a network, which was based on random walks in the network [16]. Then a well-known hierarchical clustering method named Girvan-Newman algorithm was proposed [17]. It employed edge betweenness as a metric to decompose a network into ules. Newman and Girvan subsequently devised a quality function, commonly known as mod-ularity, to evaluate the“goodness”of network partition (a partition of a network is the set of detected modules from the network) [18]. A number of modularity optimization methods had been developed to identify significant modules [19]. One of the most popular modularity-based methods is Louvain method with high efficiency in detecting modules in large networks [20]. In addition, Infomap, a method derived from information theory, was proposed to reveal the community structure by compressing the description of information flows in a network [21]. Although many classical methods can fulfill the task of module detection, few are particu-larly devised for 2-HN and certain important information is omitted by these methods in iden-tifying mixed modules from 2-HNs (Fig 1). Therefore, a novel method is necessary in order to discover accurate mixed modules from complex chemical-gene heterogeneous networks.
Fig 1. An illustration of a chemical-gene heterogeneous network.The blue nodes are chemical constituents and the red nodes represent potential gene targets. This network is an instance of 2-class heterogeneous network [9], which is more than a simple chemical-gene bipartite graph by including additional interactions between chemicals and between genes. Obviously, there are three mixed modules (1, 2, and 3) in this heterogeneous network. Each mixed module is a highly-interconnected unit in which chemicals directly or indirectly regulate the expression of corresponding genes. Additionally, module A and B are also
considered as special cases of mixed module. Such modules may influence the final partition of module detection methods, but make little contribution to uncovering particular molecular mechanism.
mechanism. In vitro experiments were conducted to verify the predictions of our method. As a consequence, the computational predictions were found to agree with the findings of in vitro experiments.
Materials and Methods
Detect mixed module
We used 2-class heterogeneous network (2-HN) to model complex chemical-gene systems or other systems with two classes of nodes [9]. A 2-HN, as shown inFig 1, contains two classes of nodes and three kinds of links. Thus, a 2-HN can be denoted byG= (V,E), withV= {VA,VB}
andE= {EAA,EAB,EBB}, whereVAis the set of nodes of classA;VBis node set of classB;EAAis
the set of links connectingAnodes;EBBis the link set betweenBnodes;EABis the link set
be-tweenAnodes andBnodes. Obviously, it can be divided into three subnetworks in terms of link category.G=GA[GP[GB, whereGA= (VA,EAA) is the subnetwork of classA,GB=
(VB,EBB) is the subnetwork of classB, andGP= (VA,VB,EAB) is a bipartite graph connecting
nodes of classAand classB. In practice, three subnetworks are usually constructed in different ways and then integrated into a 2-HN. Namely, the connectiveness, density, and even range of link weights are not homogeneous in an integrated 2-HN, but particularly consistent in any of its three subnetworks. This is the primary difference of a 2-HN from classic networks. Al-though classic module detection algorithms are applicable to identify mixed modules from a 2-HN, it is still necessary to devise a novel method which takes into account the heterogeneity underlying a 2-HN.
Due to the heterogeneity of 2-HN, we proposed a novel measure to evaluate the“goodness” of a partition of a 2-HN. This measure is named mixed modularity, to distinguish from classic modularity. The idea underlying mixed modularity is that, similar to 2-HN, we virtually divide a mixed module into three submodules in terms of link category, then evaluate the significance of each submodule in corresponding subnetwork, and finally sum up degrees of significance of three submodules as a unified metric for the mixed module. The mixed modularity of a parti-tion is the summaparti-tion of metrics over all mixed modules in it. Note that a module comprised of single-group nodes (module A and B inFig 1) is also considered as a special case of mixed module, which influences the optimization of mixed modularity. In fact, mixed modularity is a linear combination of Newman-Girvan modularity for simple graph [18] and Barber modulari-ty for bipartite graph [22]. Therefore, the mixed modularitymQcan be expressed as follows.
mQ¼1
3
X
nc
c¼1 lAc mA
dAc
2m
A
2
" #
þ lPc
mP
kPcdPc m2
P
þ lBc
mB dBc
2m
B
2
" #
( )
ð1Þ
wherencis the number of modules in a given partition; modulecis virtually divided into three submodules,c= (Ac)[(Pc)[(Bc), Acis the submodule with links fromEAA,Pcis fromEAB
and Bcis fromEBB;lAcis the number of links in submodule Ac,mAis the size of subnetwork GA,dAcis the sum of degrees of all Acnodes inGA;kPcis the sum of degrees ofAnodes ofPc in subnetworkGP,dPcis the sum of degrees ofBnodes ofPcinGPc. According to (Eq 1), mixed modularity takes into account the significance of mixed modules in three subnetworks respectively. In this way, it can partly avoid the cross-impact of different links. For example, the degree of a given node is computed separately by counting the number of links connecting nodes of same class or different classes. Besides, mixed modularity can be easily extended to a weighted version.
convenience. The process of MixMod consists of two main phases, elaborated inS1 File. Due to Louvain strategy, this method can fast detect mixed modules from a complex 2-HN.
Computer-generated 2-HN
Our method was compared with other four methods, including Markov Cluster algorithm (MCL) [16], Clauset-Newman-Moore algorithm (CNM) [23], Infomap [21] and Louvain method [20]. We generated 2-HNs with known module label as benchmarks to evaluate the performance of five methods. Since conventional benchmark methods like Girvan-Newman benchmark and LFR benchmark only generate simple network whose nodes belong to single class [17,24], we hence proposed a novel method to construct benchmark 2-HNs. The proce-dure of 2-HN benchmark generator is presented as follows.
1. According to LFR benchmark [24], generate subnetworkGAwith preset parameters
includ-ing number of nodesNA, average degreekA, maximum degree maxkAand mixing parameter μA. The output network hasnAmodules;
2. Generate subnetworkGBas step (1), the parameters ofGBareNB,kB, maxkB,μB. The
num-ber of modules isnB;
3. Set the number of mixed modulesnc= min{nA,nB}, then randomly assignAmodules andB
modules intoncclusters and make sure each cluster, namely mixed module, contains mod-ules from both subnetworks;
4. Following the procedure of bipartite benchmark [25], place links betweenAnodes andB
nodes in same mixed modules with probabilitypand place links between arbitraryAnodes andBnodes with probability 1−p. The resulting bipartiteGPhasncmodules;
5. Output the 2-HN by integratingGA,GBandGP, in which each node is assigned a mixed module label;
According to the procedure above, benchmark 2-HNs can be generated for testing the capa-bility of different module detection methods. In addition, two acknowledged measures are adopted to evaluate the accuracies of modules detected by five methods, which are normalized mutual information (NMI) [26] and classification accuracy (CA) [19,27]. Based on informa-tion theory, NMI estimates the similarity between“real”partition and“found”partition. Large NMI indicates a good partition similar to the“real”one (S1 File). Different from NMI, CA firstly determines a module matching by finding the largest overlap between pairs of modules from“real”and“found”partitions and then outputs the fraction of common nodes according to the best matching (S1 File). Large CA implies a“good”partition comprised of modules simi-lar to the“real”one.
Real drug-target system
dataset, numbers of diseases were excluded which share too many associated drugs with other diseases. As a consequence, drugs and genes for 88 diseases were curated. These drugs and genes were labeled by their associated diseases. Additional drug targets were collected from DrugBank database [29]. Each target was assigned to the disease cluster that its associated drugs belong to. The similarities between drugs were calculated using the Tanimoto coefficient of fingerprints of any two drugs through OpenBabel toolkit [30]. The Tanimoto coefficient of two fingerprints is defined as the number of common bits divided by the number of nonzero bits in either fingerprint [9,30]. Only drug pairs with similarities equal to or larger than 0.7 were selected [31]. The interactions between all genes including drug targets and disease genes were extracted from HPRD [32], BioGRID [33], and IntAct database [34]. Each gene interac-tion is weighted by the number of databases including it. Finally, the benchmark 2-HN was constructed by integrating drug pairs, drug-target interactions and gene interactions, which has 88 mixed modules for diverse diseases. The measures to evaluate the performance of differ-ent methods are NMI and CA.
Application on Buchang naoxintong capsule
We employed our method to investigate the molecular mechanism of Buchang naoxintong capsule (BNC) and then verified the predicted results via in vitro experiments. The primary task was to construct a 2-HN representing the molecular system of BNC. The chemical constit-uents within BNC herbs were retrieved from Chemistry Database of Chinese Academy of Sci-ences (http://www.organchem.csdb.cn/). Then potential targets of curated herbal constituents were extracted from CTD database [35]. The interactions between gene targets were extracted from HPRD [32], BioGrid [33], and IntAct database [34]. Similar pairs of chemical constitu-ents were selected by calculating the Tanimoto coefficient of chemical fingerprints. The thresh-old for Tanimoto similarity was set to 0.7. When the 2-HN of BNC was constructed, our method was applied to the network and then essential mixed modules were detected. These identified mixed modules were further investigated through enrichment analysis using genes of each module. That is, in a given mixed module, chemical constituents function synergistically to regulate biological pathways enriched in its gene set.
In vitro experiment and Ethics statement
We created a in vitro model to uncover the mode of action of BNC on H9c2 rat cardiomyo-blasts. Adult male Sprague-Dawley rats weighing 250–270g were obtained from the Experi-mental Animal Center of Peking University Health Science Center, Beijing, China (Certificate NO. SCXK (Jing) 2009-0017). All animals were housed individually at 22±2°Cwith a relative humidity of 50±10% and a 12-h light/12-h dark cycle. The animals had free access to food and water. The experimental procedures were approved by the China Academy of Chinese Medical Science’s Administrative Panel on Laboratory Animal Care. All animal experiments were per-formed in accordance with institutional guidelines and ethics. The experiment was approved by Experimental Animal Ethics/Administration Committee of Beijing. We firstly prepared BNC intestinal absorption liquid and identify primary bioactive constituents through liquid chromatography. Then the in vitro model of hydrogen peroxide (H2O2)-induced H9c2 rat
Results
Computer-generated benchmark
According to the procedure of benchmark 2-HN, we generated many heterogeneous networks to test the capability of our method in detecting mixed modules. For comparison, four classic methods, MCL, CNM, Infomap and Louvain, were also employed to identify mixed modules from 2-HNs. Different from conventional networks, three subnetworks of a 2-HN usually had diverse topological properties, including number of nodes, number of links, scale of link weights, network density, average degree, clustering coefficient and so on. Namely, heterogene-ity could be clearly observed in 2-HNs. As a consequence, the parameters of subnetworkGA
andGBwere specified quite differently when generating benchmark 2-HNs. We primarily set NA= 400,kA= 4, maxkA= 16 andNB= 600,kB= 12, maxkB= 48. Other parameters including
μA,μBandpwere carefully studied, which determined the module structure of benchmark
2-HNs. In brief, benchmark generator with smallμA, smallμBand largepwould result in
2-HNs with clear module structure; otherwise, the modules would not be topologically signifi-cant in the output 2-HNs.
With predefined parameters, we tested five methods on benchmark 2-HNs with variousμA,
μBandp. To avoid contingency, the performance of five module detection methods were
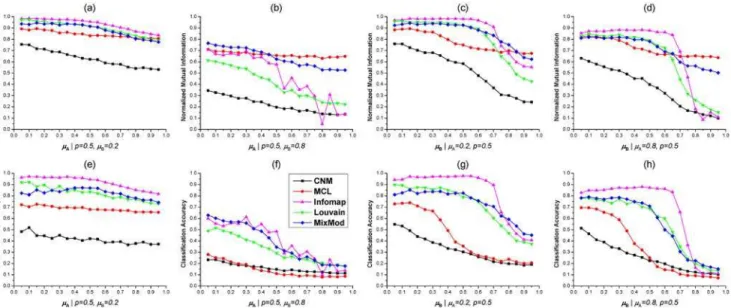
evalu-ated on 10 2-HNs with a set of same parameters. Namely, each point in Figs2and3 repre-sented the average of normalized mutual informations (NMIs) or classification accuracies (CAs) on 10 benchmark 2-HNs of sameμA,μBandp. We firstly studied the performance of
five methods in detecting modules from 2-HNs with varying parameterμA. Whenp= 0.5 and
μB= 0.2, Infomap outperformed other methods in terms of NMI and CA (Fig2aand2e), and
our method MixMod and Louvain method had comparable performance with NMIs around 0.9 and CAs around 0.8 for differentμA, MCL and CNM were the worst (Fig2aand2e). If the
module stucture of subnetworkGBwas not clear (i.e.,μB= 0.8), MixMod was the best method
Fig 2. Tests of five methods on benchmark 2-HNs with varyingμAandμB.(a). Normalized Mutual Informations (NMIs) of five methods on benchmarks withp= 0.5 andμB= 0.2. (b). NMIs whenp= 0.5 andμB= 0.8. (c). NMIs whenμA= 0.2 andp= 0.5. (d). NMIs whenμA= 0.8 andp= 0.5. (e)(f)(g)(h). CAs of five methods on 2-HNs with different parameters. In these figures, the variation curve of each method is marked by a unique color as shown in (f).
to identify mixed modules underlying complex 2-HNs (Fig2band2f). Although MCL had larger NMIs than MixMod forμA0.45, the CAs of MCL were remarkably lower than
Mix-Mod for allμA. The abnormal phenomenon that MCL had fairly large NMIs and greatly small
CAs was also observed in other situations (Fig 2). The potential reason was that MCL detected many small-sized modules and these small-sized modules resulted in a relatively large NMI (S1 Table). Besides, the NMI and CA curves of Infomap did not descend smoothly whenμA,μBare
large andpis small (Figs2and3). This was probably due to two reasons: first, it is not enough to perform Infomap on just 10 2-HNs with a set of fixed parameters; second, Infomap was sen-sitive to the network structure and not consistent when the 2-HNs had“bad”module structure (S2 Table).
We next investigated the capability of five methods in detecting mixed modules with respect toμB. WhenμB0.7, Infomap was superior to other methods according to both NMI and CA
(Fig2c,2d,2gand2h). However, Infomap was not good as MixMod ifμBexceeded 0.8.
Mix-Mod and Louvain method had similar NMIs or CAs whenμB0.6, but MixMod
outper-formed Louvain method forμB0.7 according to NMI (Fig2cand2d). MCL and CNM were
the worst in all situations in terms of CA. In addition, as shown in Fig2dand2h, the NMIs and CAs of Infomap descreased dramatically aroundμB= 0.75 and both curves reached local
maxi-mum whenμB= 0.9. Similar phenomenon was also observed in Fig2band2fwhenμB= 0.8.
Moreover, all five methods achieved relatively larger NMIs or CAs whenμA= 0.8 than when
μB= 0.8, comparing Fig2band2d,2fand2h. It indicated that mixed modules were difficult to
detect if subnetworkGBhad insignificant module structure. The underlying reason may be the
larger number of nodes in subnetworkGBthanGA(NB= 600,NA= 400).
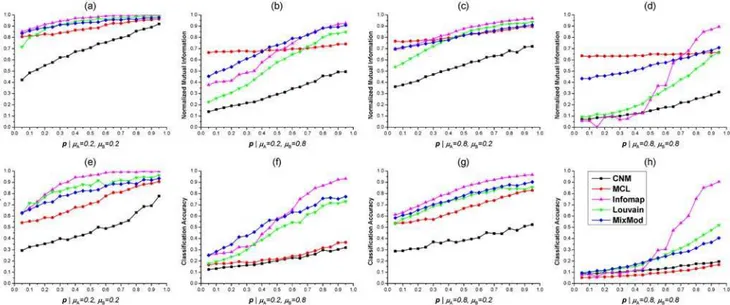
All five methods were also tested on benchmark 2-HNs with differentp. UnlikeμAandμB,
the NMIs and CAs were generally growing withpincreased (Fig 3). Whenpfor bipartite sub-networkGPwas fairly large, Infomap was the best method to identify accurate mixed modules (Fig 3). CNM was the worst in most situations with variousp(Fig 3). The NMIs for MCL were
Fig 3. Tests of five methods on benchmark 2-HNs with fixedμA,μBand varyingp.(a). Normalized Mutual Informations (NMIs) of five methods on benchmarks withμA= 0.2 andμB= 0.2. (b). NMIs whenμA= 0.2 andμB= 0.8. (c). NMIs whenμA= 0.8 andμB= 0.2. (d). NMIs whenμA= 0.8 andμB= 0.8. (e) (f)(g)(h). CAs of five methods on 2-HNs with different parameters. In these figures, the variation curve of each method is marked by a unique color as shown in (h).
relatively large and constant, but the CAs were surprisingly small whenμB= 0.8 (Fig3b,3d,3f,
and3h). Such abnormal phenomenon had been observed and discussed above. MixMod and Louvain method had comparable performance ifμB= 0.2 andpwas large. Whenpwas small,
MixMod was slightly better than Louvain method (Fig3a,3c,3e, and3g). IfμA,μBwere both
set to 0.8 andpwas small, MixMod exhibited the best performance among five methods (Fig 3dand3h). Additionally, the NMI and CA curves of Infomap achieved the local minimum at
p= 0.15 according to Fig3dand3h. Such unusual phenomenon was also observed when the benchmark 2-HNs had largeμAandμB(Fig 2).
By testing five module detection methods on undirected, unweighted benchmark 2-HNs, we could draw several conclusions based on the comparing results. Infomap outperformed other methods whenμA,μBwere small andpwas large. However, the NMI or CA curves of
Infomap were not smoothly changing whenμA,μBwere large andpwas small (Figs2and3).
CNM was the worst in most situations. MCL usually achieved relatively large NMIs and small CAs. MixMod and Louvain method exhibited similar performance whenμA,μBwere small and pwas large. According to NMI and CA, MixMod was the best method to detect mixed modules from 2-HNs with complex module structure (i.e., largeμA,μBand smallp).
We also conducted test on undirected, weighted benchmarks using five methods. Since three subnetworks of a 2-HN were usually not constructed in a same or similar manner, we weighted one subnetwork each time to generate weighted 2-HNs. The weighting scheme used in the benchmark generator was the same as the weighted LFR benchmark [37]. Two parame-tersβandμwshould be determined in the first place. Thus,βwas set to 2 andμwequaled toμA,
1−porμBfor different weighted 2-HNs. Since the implementation of CNM was unable to deal
with link weights, we excluded CNM in this test. Similarly, we averaged the NMIs and CAs of each method on 10 2-HNs with a set of same parameters. As shown inFig 4, MixMod was su-perior to other methods in most cases, especially whenμAandμBwere large, andpwas small.
In the case ofμA= 0.8,p= 0.8,μB= 0.8 forGPweighting benchmarks, MixMod was surprising-ly worse than the other three methods (Fig4band4e). Same results were also observed onGB
weighting 2-HNs withμB= 0.2. The situation was partly in accord with that of unweighted
tests (Fig3aand3e). Louvain method was basicaly the worst whenμB= 0.8 ofGAweighting, p= 0.2 ofGPweighting, andμB= 0.8 ofGBweighting benchmarks. MCL exhibited bad
perfor-mance inGAweighting 2-HNs withμB= 0.2, but outperformed other methods inGBweighting
benchmarks withμB= 0.2. In general, Infomap was a medium method in all cases. To sum up,
MixMod was a fairly good method to identify mixed modules from weighted 2-HNs.
Drug-target heterogeneous network
Besides the artificial networks, we then compared five methods on real drug-target heteroge-neous network. This network was actually a 2-HN, which consists of 277 drugs and 616 genes. There were also 82 similar drug pairs, 1234 drug-target interactions and 1253 gene interactions in the network. All drugs and genes were categorized into 88 clusters in terms of their associat-ed diseases. A minority of genes may have multiple module labels due to diverse associations with different diseases. From the drug-target 2-HN, we selected 277 drugs and their targets to perform correlation test (S1 File). Statistical analysis indicated that there were more interac-tions between targets of two drugs if they had more similar structures (Spearmanρ= 0.117, p-value<2.2e-16). It demonstrated that chemicals with similar structures usually act on same group of genes, which highly interact with each other. According to this fact, we subsequently compared five module detection methods using the drug-target 2-HN.
presented inTable 1. MCL and MixMod detected far more modules than other methods; while the numbers of modules detected by CNM and Louvain were much smaller than the real num-ber of disease clusters. All methods identified modules comprised of nodes from single class (Table 1). Regardless of single-class modules, we found that MixMod detected 97 mixed mod-ules, which was close to the number of diseases. On the other hand, MixMod was also superior to other methods, with NMI of 0.62 and CA of 0.4524 (Table 1). The low NMIs or CAs of CNM and Louvain may be due to less numbers of detected modules than the real. Namely, CNM and Louvain tended to identify modules of large size, which was consistent with the fact Fig 4. Tests of four methods on weighted benchmarks.(a). Normalized Mutual Informations (NMIs) of four methods on 2-HNs with differentμA,μBandp. The subnetworkGAof each 2-HN is weighted according to the weighting scheme of LFR benchmark. (b). NMIs of four methods on 2-HNs with weighted subnetworkGΠ. (c). NMIs of four methods on 2-HNs with weightedGB.
doi:10.1371/journal.pone.0125585.g004
Table 1. Performance of five methods on real drug-target heterogeneous network.
all modules mixed modules NMI CA
CNM 35 29 0.4478 0.3852
MCL 158 111 0.6207 0.4267
Infomap 77 59 0.5337 0.4177
Louvain 25 23 0.4246 0.3516
MixMod 146 97 0.62 0.4524
All modules include mixed modules and modules of single-class nodes.
that Newman-Girvan modularity has resolution limit [38]. We additionally exhibited ten larg-est mixed modules detected by MixMod inS1 Fig. These modules were topolgically significant as shown inS1 Fig. and most of drugs and targets in same mixed module tended to associate with same disease. To sum up, MixMod was the best method to discover mixed modules from the drug-target 2-HN.
We also tested the assumption adopted in this test, which was that the disease clusters corre-late with module structure of the drug-target 2-HN. Random test was employed to evaluate the significance of this hypothesis (S1 File). Statistical results basically supported this hypothesis (S1 File). Thus, we could approximately consider disease clusters as the real modules of drug-target heterogeneous network.
Application on BNC molecular network
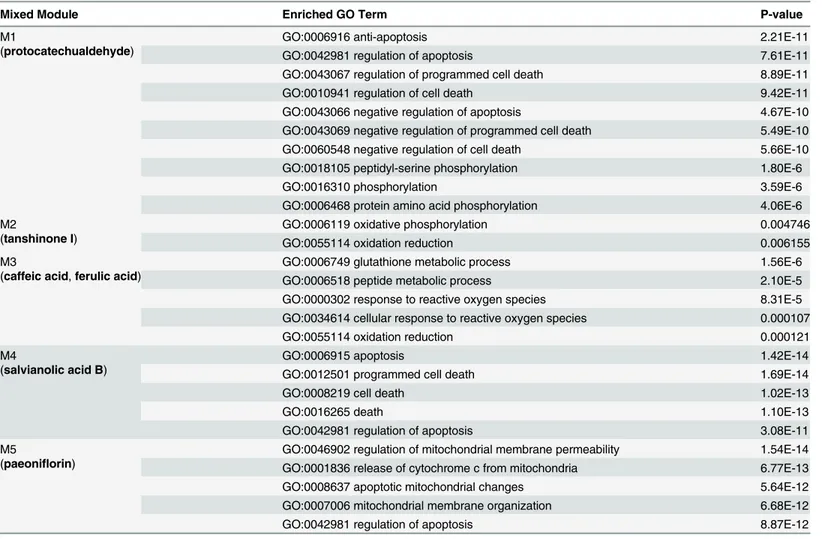
One great application of 2-HN and MixMod method was to study Traditional Chinese Medi-cine (TCM) pharmacology [4]. Here we used MixMod to identify mixed modules from the mo-lecular network of Buchang naoxintong capsule (BNC). We collected 289 non-redundant constituents for 16 herbs in BNC from Chemistry Database (S4 Table). Then potential targets for these herbal constituents were curated from CTD database. 981 gene targets associated with 95 constituents were extracted. Using OpenBabel toolkit, fingerprint-based structure similari-ties between 95 chemical constituents were calculated to select similar pairs of chemicals. Gene interactions were extracted from HPRD, BioGRID and IntAct database. Each gene interaction was weighted by the number of databases including it. Finally, a complete 2-HN was con-structed to model the molecular system of BNC. The BNC 2-HN contained 95 chemicals and 981 genes, with 53 chemical similarities, 1718 chemical-gene interactions and 3612 gene inter-actions connecting them. Before detecting mixed modules, we collected 95 chemicals and their gene targets from the 2-HN of BNC to perform correlation test (S1 File). According to statisti-cal analysis, we found that chemistatisti-cals with similar structures usually act on same group of genes (Spearmanρ= 0.136, p-value<2.2e-16). Based on this fact, MixMod was applied to the 2-HN and 55 modules were detected, including 6 class modules. After eliminating 6 single-class modules, we performed enrichment analysis for the remaining 49 mixed modules. Note that mixed modules with genes less than 10 would be omitted in enrichment analysis. There-fore, the pharmacological functions underlying BNC could be generally uncovered according to the analysis.
yellow A were also informative to uncover the pharmacological effect of BNC, but difficult to study using enrichment analysis due to small numbers of associated genes (S6 Table). On the other hand, in vitro experiments using BNC intestinal absorption liquid showed that BNC could protect H9c2 cardiomyocytes by enhancing antioxidative ability, activating ERK1/2 sig-naling pathways, inhibiting signal transduction pathways related to apoptosis and increasing mitochondrial membrane potential [36]. From the analysis above, we could conclude that our predictions by MixMod together with enrichment analysis highly accord with the experimental results. Moreover, bioactive constituents achieving specific functions were also found in mixed modules of BNC molecular network. Therefore, MixMod was an effective method to detect ac-curate mixed modules from chemical-gene heterogeneous networks and further uncover the molecular mechanism of TCM formulae.
Discussion
We propose a novel measure, named mixed modularity, specified for 2-class heterogeneous networks in order to detect accurate mixed modules. Combined with the search strategy as Table 2. Enrichment analysis on essential mixed modules from the 2-HN of BNC.
Mixed Module Enriched GO Term P-value
M1
(protocatechualdehyde)
GO:0006916 anti-apoptosis 2.21E-11
GO:0042981 regulation of apoptosis 7.61E-11
GO:0043067 regulation of programmed cell death 8.89E-11
GO:0010941 regulation of cell death 9.42E-11
GO:0043066 negative regulation of apoptosis 4.67E-10
GO:0043069 negative regulation of programmed cell death 5.49E-10
GO:0060548 negative regulation of cell death 5.66E-10
GO:0018105 peptidyl-serine phosphorylation 1.80E-6
GO:0016310 phosphorylation 3.59E-6
GO:0006468 protein amino acid phosphorylation 4.06E-6
M2
(tanshinone I)
GO:0006119 oxidative phosphorylation 0.004746
GO:0055114 oxidation reduction 0.006155
M3
(caffeic acid,ferulic acid)
GO:0006749 glutathione metabolic process 1.56E-6
GO:0006518 peptide metabolic process 2.10E-5
GO:0000302 response to reactive oxygen species 8.31E-5
GO:0034614 cellular response to reactive oxygen species 0.000107
GO:0055114 oxidation reduction 0.000121
M4
(salvianolic acid B)
GO:0006915 apoptosis 1.42E-14
GO:0012501 programmed cell death 1.69E-14
GO:0008219 cell death 1.02E-13
GO:0016265 death 1.10E-13
GO:0042981 regulation of apoptosis 3.08E-11
M5
(paeoniflorin)
GO:0046902 regulation of mitochondrial membrane permeability 1.54E-14 GO:0001836 release of cytochrome c from mitochondria 6.77E-13
GO:0008637 apoptotic mitochondrial changes 5.64E-12
GO:0007006 mitochondrial membrane organization 6.68E-12
GO:0042981 regulation of apoptosis 8.87E-12
The enrichment analysis was conducted using DAVID tool [39]. Enriched terms with p-values greater than 0.01 were discarded.
Louvain method, our method MixMod could fast identify mixed modules from chemical-gene system modeled by a 2-HN. We firstly compare MixMod with other four methods on bench-mark 2-HNs with known module structure. Results show that MixMod outperforms others when 2-HNs have promiscuous module structure (namely, largeμA,μBand smallp). Then
these methods are tested on a drug-target heterogeneous network with disease clusters as real modules. MixMod can identify the most accurate mixed modules from the drug-target hetero-geneous network (NMI 0.62 and CA 0.4524). In the end, MixMod is applied to the 2-HN of Buchang naoxintong capsule (BNC). By using enrichment analysis, we investigate five mixed modules that include primary constituents of BNC intestinal absorption liquid. In fact, the findings of in vitro experiments are found to highly accord with previous predictions. There-fore, MixMod is an effective method to detect accurate mixed modules from chemical-gene heterogeneous networks and further uncover the molecular mechanism of multicomponent therapies, especially TCM formulae.
Compared to conventional methods, MixMod has several advantages. First, MixMod con-siders a 2-HN as a united combination of three subnetworks and computes the mixed modu-larity independently from three subnetworks. That is, topological properties concerning chemicals or genes are separately calculated in MixMod and mixed modularity. Second, ac-cording to mixed modularity, MixMod is partially robust to the structure of 2-HNs. For exam-ple, if we double the link weights of any of the three subnetworks for a given 2-HN, MixMod will identify the same partition as the original. Although MixMod is a good method to detect mixed modules, there are some disadvantages that limit the application of MixMod. Obviously, MixMod can only be applied to complex systems modeled by 2-HN. Thus MixMod is unavail-able for common networks like PPI networks and drug-target bipartite networks. Even so, Mix-Mod is still helpful and insightful because it can deal with different interactions in an
integrated 2-HN. Since chemical similarities, chemical-target interactions and gene interac-tions are all included in an integrated network, mixed modules detected by MixMod may be quite accurate and informative to uncover molecular mechanism underlying TCM formulae.
Supporting Information
S1 File. MixMod method and additional test. (PDF)
S1 Fig. Ten largest mixed modules detected by MixMod from the drug-target 2-HN.The di-amond nodes are drugs and ellipse nodes are targets. Ten largest mixed modules are particular-ly marked by circles. Drugs and genes belonging to ten disease clusters are colored accordingparticular-ly. Other nodes are all grey if they are not related to those diseases.
(TIFF)
S2 Fig. Mixed modules detected by MixMod from the 2-HN of BNC.This figure presents a module network according to the final partition of the BNC 2-HN, as introduced inS1 File. A diamond node is a submodule of chemicals and an ellipse node is a submodule of genes. A mixed module is represented by two adjacent nodes (one diamond and one ellipse) of this net-work. A self-loop represents all interactions between nodes of a submodule. Intra-module links are colored by black and inter-module links are grey.
(TIFF)
S2 Table. The variation of NMIs and CAs by Infomap on benchmark 2-HNs. (XLS)
S3 Table. Topological properties of the drug-target heterogeneous network. (XLS)
S4 Table. Herbal composition of Buchang naoxintong capsule. (XLS)
S5 Table. Topological properties of the chemical-gene heterogeneous network of BNC. (XLS)
S6 Table. Mixed modules including 8 bioactive constituents of BNC intestinal absorption liquid.
(XLS)
S7 Table. Supplementary data of real drug-target heterogeneous network and molecular network of Buchang naoxintong capsule (BNC).(a). FDA-approved drugs of drug-target het-erogeneous network. (b). Drug targets of target network. (c). 88 disease clusters of drug-target network. (d). Molecular network of Buchang naoxintong capsule (BNC).
(XLS)
Acknowledgments
This work was supported by National Science Foundation of China (Grant No. 81303152, 81330086 and 81203005) and the Fundamental Research Funds for the Central public welfare research institutes of China (Grant No. ZZ070830).
Author Contributions
Conceived and designed the experiments: HY PL. Performed the experiments: JS ST. Analyzed the data: JS XL PL. Contributed reagents/materials/analysis tools: JS ST YG. Wrote the paper: JS ST.
References
1. Hopkins AL. Network pharmacology: the next paradigm in drug discovery. Nat Chem Biol. 2008 Nov; 4 (11):682–690. doi:10.1038/nchembio.118PMID:18936753
2. Keith CT, Borisy AA, Stockwell BR. Multicomponent therapeutics for networked systems. Nat Rev Drug Discov. 2005 Jan; 4(1):71–78. doi:10.1038/nrd1609PMID:15688074
3. Barabasi AL, Gulbahce N, Loscalzo J. Network medicine: a network-based approach to human dis-ease. Nat Rev Genet. 2011 Jan; 12(1):56–68. doi:10.1038/nrg2918PMID:21164525
4. Zhao J, Jiang P, Zhang W. Molecular networks for the study of TCM Pharmacology. Briefings in Bioin-formatics. 2010; 11(4):417–430. doi:10.1093/bib/bbp063PMID:20038567
5. Li J, Lu C, Jiang M, Niu X, Guo H, Li L, et al. Traditional Chinese Medicine-Based Network Pharmacolo-gy Could Lead to New Multicompound Drug Discovery. Evidence-Based Complementary and Alterna-tive Medicine. 2012; 2012:11.
6. Kitano H. A robustness-based approach to systems-oriented drug design. Nat Rev Drug Discov. 2007; 6(3):202–210. doi:10.1038/nrd2195PMID:17318209
7. Li S, Zhang B. Traditional Chinese medicine network pharmacology: theory, methodology and applica-tion. Chinese Journal of Natural Medicines. 2013; 11(2):110–120. doi:10.3724/SP.J.1009.2013.00110 PMID:23787177
9. Song J, Zhang F, Tang S, Liu X, Gao Y, Lu P, et al. A Module Analysis Approach to Investigate Molecu-lar Mechanism of TCM Formula: A Trial on Shu-feng-jie-du Formula. Evidence-Based Complementary and Alternative Medicine. 2013; 2013:14. doi:10.1155/2013/731370
10. Shi Z, Derow C, Zhang B. Co-expression module analysis reveals biological processes, genomic gain, and regulatory mechanisms associated with breast cancer progression. BMC Systems Biology. 2010; 4(1):74. doi:10.1186/1752-0509-4-74PMID:20507583
11. Li S, Zhang B, Jiang D, Wei Y, Zhang N. Herb network construction and co-module analysis for uncov-ering the combination rule of traditional Chinese herbal formulae. BMC Bioinformatics. 2010; 11(Suppl 11):S6. doi:10.1186/1471-2105-11-S11-S6PMID:21172056
12. Li H, Zhao L, Zhang B, Jiang Y, Wang X, Guo Y, et al. A Network Pharmacology Approach to Determine Active Compounds and Action Mechanisms of Ge-Gen-Qin-Lian Decoction for Treatment of Type 2 Di-abetes. Evidence-Based Complementary and Alternative Medicine. 2014; 2014:12. doi:10.1155/2014/ 495840
13. Ravasz E, Somera AL, Mongru DA, Oltvai ZN, Barabsi AL. Hierarchical Organization of Modularity in Metabolic Networks. Science. 2002 Aug; 297:1551–1555. doi:10.1126/science.1073374PMID: 12202830
14. Hartwell LH, Hopfield JJ, Leibler S, Murray AW. From molecular to modular cell biology. Nature. 1999; 402:C47C52. doi:10.1038/35011540
15. Barabasi AL, Oltvai ZN. Network biology: understanding the cell’s functional organization. Nat Rev Genet. 2004 Feb; 5(2):101–113. doi:10.1038/nrg1272PMID:14735121
16. van Dongen SM. Graph Clustering by Flow Simulation. University of Utrecht, The Netherlands; 2000.
17. Girvan M, Newman MEJ. Community structure in social and biological networks. Proceedings of the National Academy of Sciences. 2002; 99(12):7821–7826. doi:10.1073/pnas.122653799
18. Newman MEJ, Girvan M. Finding and evaluating community structure in networks. Phys Rev E. 2004; 69(2):026113. doi:10.1103/PhysRevE.69.026113
19. Fortunato S. Community detection in graphs. Physics Reports. 2010; 486(3–5):75–174. doi:10.1016/j. physrep.2009.11.002
20. Blondel VD, Guillaume JL, Lambiotte R, Lefebvre E. Fast unfolding of communities in large networks. Journal of Statistical Mechanics: Theory and Experiment. 2008; 2008(10):P10008. doi: 10.1088/1742-5468/2008/10/P10008
21. Rosvall M, Bergstrom CT. Maps of random walks on complex networks reveal community structure. Proceedings of the National Academy of Sciences. 2008; 105(4):1118–1123. doi:10.1073/pnas. 0706851105
22. Barber MJ. Modularity and community detection in bipartite networks. Phys Rev E. 2007; 76 (6):066102. doi:10.1103/PhysRevE.76.066102
23. Clauset A, Newman MEJ, Moore C. Finding community structure in very large networks. Phys Rev E. 2004 Dec; 70(6):066111. doi:10.1103/PhysRevE.70.066111
24. Lancichinetti A, Fortunato S, Radicchi F. Benchmark graphs for testing community detection algo-rithms. Phys Rev E. 2008; 78(4):046110. doi:10.1103/PhysRevE.78.046110
25. Guimer R, Sales-Pardo M, Amaral LAN. Module identification in bipartite and directed networks. Phys Rev E. 2007; 76(3):036102. doi:10.1103/PhysRevE.76.036102
26. Danon L, Diaz-Guilera A, Duch J, Arenas A. Comparing community structure identification. Journal of Statistical Mechanics: Theory and Experiment. 2005; 2005(09):P09008. doi:10.1088/1742-5468/2005/ 09/P09008
27. Meila M, Heckerman D. An Experimental Comparison of Model-Based Clustering Methods. Mach Learn. 2001 Jan; 42(1–2):9–29. doi:10.1023/A:1007648401407
28. Yildirim MA, Goh KI, Cusick ME, Barabasi AL, Vidal M. Drug-target network. Nat Biotech. 2007; 25 (10):1119–1126. doi:10.1038/nbt1338
29. Knox C, Law V, Jewison T, Liu P, Ly S, Frolkis A, et al. DrugBank 3.0: a comprehensive resource for ‘Omics’research on drugs. Nucleic Acids Research. 2011; 39(suppl 1):D1035–D1041. doi:10.1093/ nar/gkq1126PMID:21059682
30. O’Boyle N, Banck M, James C, Morley C, Vandermeersch T, Hutchison G. Open Babel: An open chem-ical toolbox. Journal of Cheminformatics. 2011; 3(1):33. doi:10.1186/1758-2946-3-33PMID:21982300
31. O’Boyle N, Morley C, Hutchison G. Pybel: a Python wrapper for the OpenBabel cheminformatics toolkit. Chemistry Central Journal. 2008; 2(1):5. doi:10.1186/1752-153X-2-5PMID:18328109
33. Chatr-aryamontri A, Breitkreutz BJ, Heinicke S, Boucher L, Winter A, Stark C, et al. The BioGRID inter-action database: 2013 update. Nucleic Acids Research. 2013; 41(D1):D816–D823. doi:10.1093/nar/ gks1158PMID:23203989
34. Kerrien S, Aranda B, Breuza L, Bridge A, Broackes-Carter F, Chen C, et al. The IntAct molecular inter-action database in 2012. Nucleic Acids Research. 2012; 40(D1):D841–D846. doi:10.1093/nar/gkr1088 PMID:22121220
35. Davis AP, Murphy CG, Johnson R, Lay JM, Lennon-Hopkins K, Saraceni-Richards C, et al. The Com-parative Toxicogenomics Database: update 2013. Nucleic Acids Research. 2013; 41(D1):D1104– D1114. doi:10.1093/nar/gks994PMID:23093600
36. Zhang F, Huang B, Zhao Y, Tang S, Xu H, Wang L, et al. BNC Protects H9c2 Cardiomyoblasts from H2O2-Induced Oxidative Injury through ERK1/2 Signaling Pathway. Evidence-Based Complementary and Alternative Medicine. 2013; 2013:12.
37. Lancichinetti A, Fortunato S. Benchmarks for testing community detection algorithms on directed and weighted graphs with overlapping communities. Phys Rev E. 2009 Jul; 80:016118. doi:10.1103/ PhysRevE.80.016118
38. Fortunato S, Barthlemy M. Resolution limit in community detection. Proceedings of the National Acade-my of Sciences. 2007; 104(1):36–41. doi:10.1073/pnas.0605965104