Brazilian Journal of Physics, vol. 29, no. 3, September, 1999 547
Low Temperature Photoluminescence
in Ultra-Thin Germanium Quantum Wells
P. A. M. Ro drigues,
Instituto de Fsica, Universidade de Braslia, Cx.Postal 04455, CEP 70910-900, Braslia, DF, Brazil
M. A. Ara ujo-Silva,
Departamento de Fsica, Universidade Federal do Ceara, Fortaleza CE, Brazil
G. A.Narvaez,F. Cerdeira,
Instituto de Fsica, Universidade Estadual de Campinas, Campinas SP, Brazil
and J.C. Bean
Department of Electrical Engineering,
University of Virginia. Charlottesville VA 22903-2442, USA
Received 01 June, 1999
We measured the photoluminescence (PL) spectra of a series of Gen quantum wells as a function of temperature, from 2K to 50K. The PL spectra at 2.1K are dominated by broad emission lines, which can be interpreted as recombination across the indirect gap of the Si/Ge microstructure and are strongly inuenced by the interface morphology of each sample. BeyondT &15K, all samples show identical spectra in which the broad structures are replaced by thin, strong lines. We interpret these changes as a quenching of the recpmbination across the gap PL of the microstructure and the appearance of defect-related peaks from the Si substrate.
I Introduction
During the last decade, there has been an increasing number of reports on the photoluminescence (PL) spec-tra of a variety of Si/Ge microstructures [1-10]. The low temperature PL spectra (T .4K) of a wide variety of
Si/Ge microstructures, ranging from SimGen
superlat-tices [2], Si/Gen quantum wells [3-5] to GexSi1,x/Si
quantum wells, superlattices and quantum dots [6,7], are remarkably similar. They consist of two relatively broad peaks (across the gap recombination and phonon replica, respectively), or a single very broad band at lower photon energy, which appears to be related to interface defects created by Ge segregation [6]. All Si/Ge microstructures grown by molecular beam epi-taxy (MBE) seem to have a common feature: a thin alloy layer (1-2 monolayers) produced by interdiusion during growth [1,5,11]. This layer could inuence the PL spectra of samples with dierent architectures, giv-ing them a characteristic signature, either by
disorder-induced exciton localization or by providing the con-duction band minimum for the microstructure. As the temperature increases, the reported PL spectra show two dierent characteristics. While some maintaintheir general lineshape at higher temperatures [3,4,8], others exhibit qualitatively dierent shapes [9,10,12]. Again, the same behavior is exhibited by samples of dierent architectures within each type of behavior.
We measured the photoluminescence (PL) spectra of a series of Gen multiple quantum wells (MQWs) in
the temperature range between 2K and 50K. The PL spectra at 2.1K are dominated by broad emission lines in the photon energy range between 0.80 and 0.97 eV. These lines can be interpreted as recombination across the indirect gap of the Si/Ge microstructure and are strongly inuenced by the interface morphology of each sample [5]. BeyondT 15K, all samples show
548 P. A.M.Ro drigueset.al.
(substrate) end of one of our samples, we conclude that these thin lines originate in recombination at deep im-purity complexes in the Si substrates and are unrelated to the microstructures deposited on them. We believe that this is also the explanation for similar high tem-perature PL lines reported by other authors in samples with dierent architecture [9,10].
II Experimental Details
Our samples were grown by molecular beam epitaxy (MBE) at T = 500C on Si (001) substrates. They
consist of a thick (800 nm) Si buer layer followed by 25 repetitions of Genlayers (
n= 3, 4, 5 and 6
monolayers, ML), separated from one another by 70MLs -thick Si spacer-layers. Photoluminescence (PL) mea-surements were performed with the sample immersed in superuid liquid He (2.1K) or gas (T &5K), using
approximately 30 Watts/cm2of the 488 nm line of an
Argon-ion laser as exciting radiation. Emitted light was ltered by a 0.5m SPEX monochromator and detected with a cooled Ge detector.
III Results and Discussion
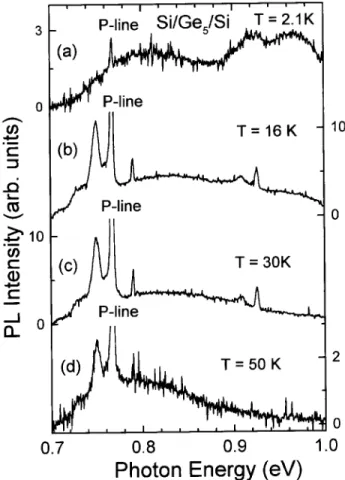
Figure 1(a) displays low-temperature (2.1K) PL spec-tra of our Si/Ge5/Si MQW, in the photon energy range
below 1eV. This spectrum shows a broadband emission (BB-PL) centered at~! 0:8eV and a narrower-band
doublet (NB-PL) at slightly higher photon- energy. The BB-PL is more or less identical in position and inten-sity in all MQW samples, while the NB-PL exhibits connement shifts going fromn= 5 ton= 6 [5].
Sim-ilar bands appear in the spectra of Si/GexSi1,x QWs
and SLs, where BB or NB PL-lines are observed de-pending on the density of defects present in the alloy layer [6]. The NB-PL doublet is produced by no-phonon recombination across the indirect gap of the alloy and its phonon replica, respectively [6]. The resemblance between the PL spectra of alloy and pure Ge QWs be-comes more marked when we notice that the energy separation between the no-phonon emission line and its phonon-assisted replica in the NB-PL of all these sam-ples is 49 meV [3-5], the frequency of the Si-Ge vibra-tion of the alloy. The GenQWs also contain alloy
lay-ers, whether intentionally grown [4] or appearing spon-taneously during growth at the Si/Ge interface [3,5]. In
the rst case, the conduction band minimum of the mi-crostructure is located in the alloy layers sandwiching the Ge QWs [4]. In the second case [3,5], this inter-facial alloy layer probably mediates the recombination by disorder- induced exciton localization [11]. In both cases the valence band maximum is located in the Ge QWs [4]. Hence, the PL lines would exhibit the signa-ture of alloy PL (general shape and peak separation), while photon energy positions shift as quantum well width varies due to the dierent connement energies of the holes in the Ge layers.
Figure 1. Photoluminescence (PL) spectra of the Si/Ge5/Si sample at dierent temperatures.
At higher temperatures two types of behaviors are reported. Some [3,4,8] show spectra which resemble closely those taken at T . 4K, while others report
spectra which suer qualitative changes as the temper-ature increases [9,10]. Our samples exhibit the second type of behavior, as exemplied in Figs 1(b) through (d), where spectra for our sample with n = 5 are
dis-played at dierent temperatures. Beyond T 15K
all our Si/Gen/Si samples show identical spectra, in
lo-Brazilian Journal of Physics, vol. 29, no. 3, September, 1999 549 cated at 0.767eV, with a full width at half maximum
of less than 2.3 meV, dominates the spectra [13]. Sim-ilar spectra have been reported in self-assembled Ge quantum dots [9] and in a rather large variety of Si/Ge microstructures, grown by MBE on Si substrates, with very dierent architecture [10]. The spectral lines are usually interpreted as recombination across the gap of the microstructure and conclusions about the sample structure and morphology (size uniformity of the quan-tum dots, width of the quanquan-tum wells, etc.) are drawn from the photon energy position and widths of the PL lines [9]. However, the ubiquity of these PL lines led De Padova et al. to suggest that they may not originate in the microstructures themselves, but rather are the product of recombination in some feature commonto all these samples, such as the Si/Ge interface [10]. In this case, the dierence between the results just discussed and those of Gail et al [4] would reside in the interface quality of the samples. In the latter, the PL of the mi-crostructure persists even at high temperatures, while in the other cases, this PL is rapidly quenched and the spectrum is dominated by defect related luminescence. In an eort to clarify this issue, we polished and etched the back (substrate) end of one of our samples (n= 5)
and proceeded to study the PL spectra of both front and back ends of the same sample as a function of tem-perature [12]. We found that, for T & 15K, the
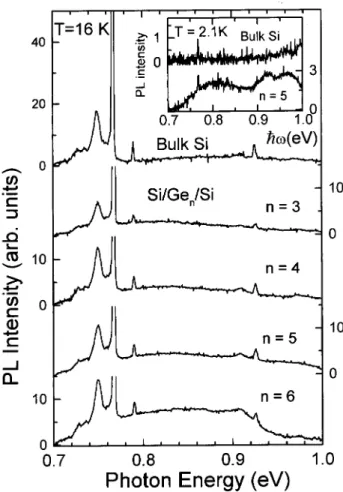
spec-tra from the Si subsspec-trate are identical to those of the front end of all our samples. This is illustrated in Fig. 2, where the spectra (at 16K) of the back (substrate) end of the sample n= 5 and those of the front (lm)
end of our Si/Gen/Si samples are displayed. The fact
that these thin, strong lines appear in exactly the same manner in all spectra unequivocally identies them as the product of recombination taking place at the samples substrates, i.e., they are bulk Si lines. The inset in Fig. 2 shows the PL spectra at T = 2:1K of the substrate
(back end) and the lm (front end) of the samplen= 5:
Here both spectra are quite dierent. Although the P-line (~! = 0:767eV) is already present in the
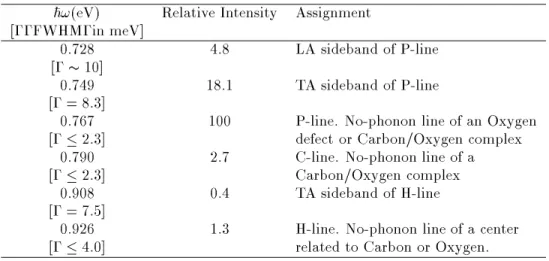
spec-trum of the QW, the NB- and BB-PL dominates this spectrum. In Table I we list the photon energy posi-tion (~!), full width at half maximum (,), and relative
intensities (arbitrarily attributing an intensity of 100 units to the P-line at 0.767 eV) of the most prominent lines in the PL spectra at T = 16K shown on Fig. 2
[13]. The various lines arising from recombination cen-ters in bulk Si have been reported by several authors [14] and collected in the review of Davies [15]. The last
column in Table I list the assignment given to PL lines of bulk Si appearing at the same photon energies (and with similar linewidth and relative intensities) as those in Fig. 2 [13]. This conrms our conclusion that the observed PL lines in the higher temperature spectra of our samples, and probably also those of several other authors [9,10], originate in recombination taking place at deep impurity centers in the Si substrate and are unrelated to the microstructure deposited on them.
Figure 2. Photoluminescence (PL) spectra of the back (sub-strate) end of the sample with n = 5 (top) and those of the front ends of all the Si/Gen/Si MQWs at 16K. Inset shows the spectra of the back (top) and front ends of the n = 5 sample at 2.1K.
In summary, we have measured the PL spectra of a series of Si/Gen/Si samples (
n = 3, 4, 5, and 6) in
the temperature range 2K<T <50K. The spectra for T & 15K are dominated by thin, strong lines, which
550 P. A.M.Ro drigueset.al.
Table I. Photon energies (~!), linewidths (,) and relative intensities (with that of the line at 0.767 eV taken
arbitrarily at 100) of the PL lines appearing in theT = 16K spectra of the front and back ends of the Si/Ge 5/Si
sample. The relative intensities have been corrected by the response of the experimental set up [13]. The last column gives the assignment of similar lines appearing in the PL spectra of bulk Si as listed in ref. [15].
~!(eV) Relative Intensity Assignment
[,, FWHM, in meV]
0.728 4.8 LA sideband of P-line
[,10]
0.749 18.1 TA sideband of P-line
[, = 8:3]
0.767 100 P-line. No-phonon line of an Oxygen
[,2:3] defect or Carbon/Oxygen complex
0.790 2.7 C-line. No-phonon line of a
[,2:3] Carbon/Oxygen complex
0.908 0.4 TA sideband of H-line
[, = 7:5]
0.926 1.3 H-line. No-phonon line of a center
[,4:0] related to Carbon or Oxygen.
Acknowledgments
We acknowledge nancial help, in the form of re-search grants and fellowships, from FAPESP, FAPDF and CNPq.
References
[1] The subject has been recently reviewed by F. Cerdeira in chapter 5 ofGermanium silicon: Physics and Mate-rials,edited by R. Hull and J.C. Bean,Semiconductors and Semimetals,Series editors R. K. Willardson and E. R. Weber Academic Press, New York, 1999) vol.56, p. 277-288.
[2] U. Meczingar, G. Abstreiter, G. Olajos, J. Grimmeis, H. Kibbel, H. Prestig and E. Kasper, Phys. Rev. B47, 4099 (1993), and references therein.
[3] J. Engvall, J. Olajos, H.Grimeiss, H. Kibbel and H. Prestig, Phys. Rev. B51, 2001(1995).
[4] M. Gail, G. Abstreiter, J. Olajos, J. Engvall, H. Grimeiss, H.Kibbel and H. Prestig, Appl. Phys. Lett. 66, 2978 (1995).
[5] G. Narvaez, M. A. Araujo-Silva, F. Cerdeira and J. C.Bean, Solid State Commun.107, 359 (1998). [6] J. C. Sturm, A. St. Amour, Y. Lacroix and M. L. W.
Thewalt, Appl. Phys. Lett.64, 2291 (1994), and refer-ences therein.
[7] Y. S.Tang, S. Cai, G. Jin, J. Duan, K. L. Wang, H. M. Soyez and B.S. Dunn, Appl. Phys. Lett.71, 2448 (1997).
[8] H. Sunamura, N.H.Usami and Y. Shiraki, Appl. Phys. Lett.66, 3024 (1995).
[9] Xun Wang, Zui-min Jiang, Hai-jun Zhu, Fang Lu, Daming Huang, Xiaohan Liu, Chang-wu Hu, Yifan Chen and Takafumi Yao, Appl. Phys. Lett. 71, 3543 (1997).
[10] P. De Padova, P. Perfetti, R. Pizzoferrato and M. Casalboni, Appl. Phys. Lett.73, 2378 (1998).
[11] R. Turton and M. Jaros, Appl. Phys. Lett. 69, 2891 (1996).
[12] P. A. M. Rodrigues, F. Cerdeira, J. C. Bean, Appl. Phys. Lett.75, 145 (1999).
[13] The spectra shown on Figures 1 and 2 have not been corrected by the response of the detection system. On the other hand, the relative intensities listed in Table I were corrected for this experimental factor.