Annales
Geophysicae
50 MHz continuous wave interferometer observations of the
unstable mid-latitude E-region ionosphere
C. Haldoupis1, A. Bourdillon2, A. Kamburelis1, G. C. Hussey3, and J. A. Koehler3
1Physics Department, University of Crete, Iraklion, Crete, Greece
2Institut d’Electronique et de T´el´ecommunications de Rennes, Univerit´e de Rennes 1,Rennes, France
3Institute of Space and Atmospheric Studies,Department of Physics and Engineering Physics, University of Saskatchewan, Saskatoon, Canada
Received: 1 November 2002 – Revised: 25 January 2003 – Accepted: 15 February 2003
Abstract. In this paper we describe the conversion of SESCAT (Sporadic-E SCATter experiment), a bistatic 50 MHz continuous wave (CW) Doppler radar located on the island of Crete, Greece, to a single (east-west) baseline interferometer. The first results show that SESCAT, which provides high quality Doppler spectra and excellent tempo-ral resolution, has its measurement capabilities enhanced sig-nificantly when operated as an interferometer, as it can also study short-term dynamics of localized scattering regions within mid-latitude sporadic E-layers. The interferometric observations reveal that the aspect sensitive area viewed by the radar often contains a few zonally located backscatter re-gions, presumably blobs or patches of unstable metallic ion plasma, which drift across the radar field-of-view with the neutral wind. On average, these active regions of backscatter have mean zonal scales ranging from a few kilometers to sev-eral tens of kilometers and drift with westward speeds from ∼20 m/s to 100 m/s, and occasionally up to 150 m/s. The cross-spectral analysis shows that mid-latitude type 1 echoes occur much more frequently than has been previously as-sumed and they originate in single and rather localized areas of elevated electric fields. On the other hand, typical bursts of type 2 echoes are often found to result from two adja-cent regions in azimuth undergoing the same bulk motion westwards but producing scatter of opposite Doppler polar-ity, a fact that contradicts the notion of isotropic turbulence to which type 2 echoes are attributed. Finally, quasi-periodic (QP) echoes are observed simply to be due to sequential unstable plasma patches or blobs which traverse across the radar field-of-view, sometimes in a wave-like fashion.
Key words. Ionosphere (ionospheric irregularities; mid-latitude ionosphere; plasma waves and instabilities)
Correspondence to:C. Haldoupis ([email protected])
1 Introduction
Ionospheric radio interferometry was first introduced by Woodman (1971) in equatorial electrojet studies, in order to determine the magnetic field inclination over Jicamarca, Peru. It was based on cross-correlation interferometry used in radio astronomy to determine the angular position and size of radio noise sources. Ionospheric interferometry was fur-ther developed by Farley et al. (1981) and applied to stud-ies of equatorial electrojet and spread-F irregularitstud-ies. They showed that for the simplest configuration of a single-line in-terferometer of two spaced antennas and two phase-coherent receivers, the complex cross spectrum of the received signals can be expressed as
SAB(ω)=exp(−k2d2σω2/2)·exp(j kdh8ωi).
Here, k is the radar wave number, d is the separation be-tween the phasing centers of the antennasAandB, whileσω
andh8ωiare the angular spread and mean angular position
of the source, which is marked in a spectrum by its mean Doppler shiftω. This expression was derived on the assump-tion that the signals backscattered from a source result from the superposition of wavelets originating from a random as-sembly of source elements having their phases8ωinormally
distributed about a mean value. The source mean size and angular position can be estimated by computing the normal-ized spectral amplitude, or coherency, and the cross-spectral phase, respectively. Note that radar backscatter in-terferometry works well if the viewing volume is dominated by a few localized regions of instability rather than when it is filled with a large number of randomly distributed and chaot-ically moving scattering sources, that is, for conditions of volume scattering.
1590 C. Haldoupis et al.: 50 MHz interferometer observations of unstable sporadic E-layers
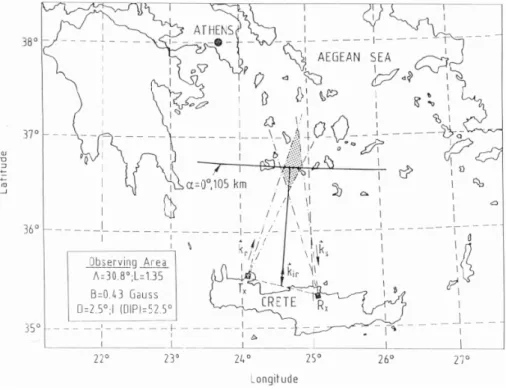
Fig. 1.Observing geometry of the Sporadic-E SCATter experiment (SESCAT) and its locations along the northern coastline of Crete, Greece. A single (east-west) baseline interferometer was set up by using a dual phase-coherent receiver and by dividing the SESCAT receiving array of four Yagis into two sub-arrays, east and west, which formed a baseline of 16 m.
in studies of the auroral zone (e.g. Providakes et al., 1983; Fejer et al., 1986; Haldoupis et al., 1988; Ierkic et al., 1992). At mid-latitude, where coherent backscatter of radio waves comes from unstable sporadic E-layers, the technique was applied first by Riggin et al. (1986) using the Cornell Univer-sity Portable Radar Interferometer (CUPRI). Recently, multi-line interferometry and in-beam radar imaging techniques have been used by Hysell and Chau (2002) for studying fine structures inside large-scale plasma waves in the nighttime equatorial electrojet, and by Hysell et al. (2002a) to investi-gate the nature of quasi-periodic (QP) echoes at mid-latitude, which were first reported by Yamamoto et al. (1991).
The present paper describes the upgrade of SESCAT, the 50 MHz CW Sporadic-E SCATter experiment located in the island of Crete, into a single-line azimuthal interferometer and discusses some characteristic observations. This work is a continuation of research carried out with SESCAT over the last decade which has led to a number of findings, the most important being the detection at mid-latitude of the Farley-Buneman instability (e.g. see Schlegel and Haldoupis, 1994) and the introduction of a new polarization mechanism for its explanation (e.g. see Haldoupis et al., 1997). Note that SESCAT is not a pulsed radar, but a continuous wave bistatic Doppler system that observes a fixed scattering volume with both excellent temporal and Doppler spectral resolution. As will be shown, SESCAT has its observing capacity consid-erably enhanced when operated as an interferometer. It be-comes very useful for the study of microstructure and short-term dynamics in localized and strongly unstable scattering
regions located within sporadic-E layers.
In the following, we first describe the SESCAT interfer-ometer and then present some observations and discuss their implications within the framework of our present physical understanding. Note that although the results to be shown typify our data base, they are by no means exhaustive. More results and detailed interpretations will be given in subse-quent publications.
2 SESCAT interferometry
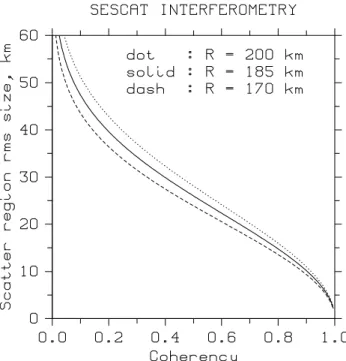
Fig. 2.Dependence of the zonal scattering region mean size on the measured coherencies for the SESCAT interferometer experiment. Note that the errors due to range uncertainties are up to about 10%.
in the first SESCAT paper by Haldoupis and Schlegel (1993), where the experiment is described in detail, the system ob-serves a fixed volume confined to ranges from about 170 to 210 km, with the most probable range for optimal echo reception near and about 185 km. Because of its bistatic geometry, SESCAT is sensitive to backscatter from plasma waves that have wavelengths slightly higher than half the radio wavelength and which propagate along the bisector formed by the transmitting and receiving antenna beams. The observing direction is oriented ∼5.5◦ east of geomagnetic north, thus SESCAT observes nearly along the geomagnetic meridian.
An interferometer requires at least two receivers and two receiving antennas. To upgrade SESCAT into an interferom-eter a new receiver system was built that consisted of two identical superheterodyne receiver units. In order for the re-ceivers to be phase-coherent, both were driven by a single, ultra stable oven-controlled crystal oscillator operating at ex-actly 1 kHz below the transmitted frequency. This shift rela-tive to the transmitted frequency is necessary for CW radars, in order for both positive and negative Doppler shifts to be measured and, as such, for the full Doppler spectrum to be determined.
In the experiment under description, the two antennas re-quired for interferometry were simply provided by splitting the receiving array of four Yagis into two sub-arrays, each sub-array made up from two adjacent single Yagi antennas. This resulted in an approximately east-west antenna baseline of 16 m, which turned SESCAT into an azimuthal interfer-ometer. In this configuration, the beamwidth for each
re-ceiving array now becomes∼12◦, from the 8◦it was for the 4-Yagi array, which, in turn, increases the 3-dB zonal extent of the scattering region to∼40 km at a range of 185 km. It should be mentioned that the Yagis in the receiver array are aligned at∼15◦ south of east, that is, the observing direc-tion of the array is pointing ∼15◦ east of north; therefore, the term azimuthal, or zonal, used throughout the paper is approximate.
The interferometer baseline d is the key parameter that defines the interferometer lobe φI L and thus, the
sensitiv-ity of the experiment. φI L is defined as the angular extent
for which there is a continuous 2π phase difference change between the signals reaching the two antennas as the target (scattering source) traverses across the antenna beam pattern. Since the phase difference between the signals at the two an-tennas is18=(2π 1r)/λ, where1ris the range (or path) difference from the target to the two antennas andλ is the radio wavelength, one obtains
φI L=sin−1(λ/d). (1)
In the present caseφI L≃22◦and this in turn provides a lobe
cross-beam length ofLI L =2rtan(φI L/2)≃ 72 km at the
most probable backscatter range ofr =185 km. LI L
repre-sents the distance a scattering source has to travel across the antenna beam just before the phase difference wraps around. Accurate knowledge ofLI L is of importance for the
esti-mation of the source traversing speeds. Note thatLI L here
is larger than the 3-dB zonal extent (or beamwidth) of the scattering region; thus, one should not expect to see sig-nificant wrap-around uncertainties in the measured cross-spectral phases. This, however, should not be taken for granted because of the large dynamic range of the received echoes.
For the SESCAT interferometer, the output audio fre-quency signals of both receivers were digitized and pro-cessed on site by using two identical DSP (digital signal processor) units, housed in a Pentium-class personal com-puter. Highly efficient software, partly written in assembly language and partly in C++, allowed for fast Fourier trans-formations and subsequent power spectrum and cross spec-trum calculations to be performed in real time. Given that the useful Doppler spectral band is between 800 Hz and 1200 Hz with the zero Doppler shift being exactly at 1 kHz, a digiti-zation rate of 2.5 kHz was used giving a sampling interval of 1t =0.40 ms and a Nyquist frequency offN =1.25 kHz.
The realR1,2(f )and imaginaryI1,2(f )Fourier coefficients were computed for each receiver output signal by fast Fourier transforming 2048-point time series of 0.8192 s. This yielded a frequency resolution of1f =1.22 Hz or a Doppler veloc-ity resolution of 3.80 m/s.
1592 C. Haldoupis et al.: 50 MHz interferometer observations of unstable sporadic E-layers
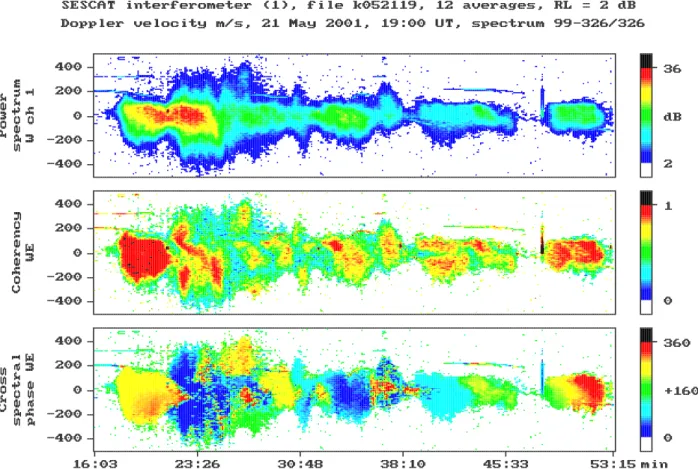
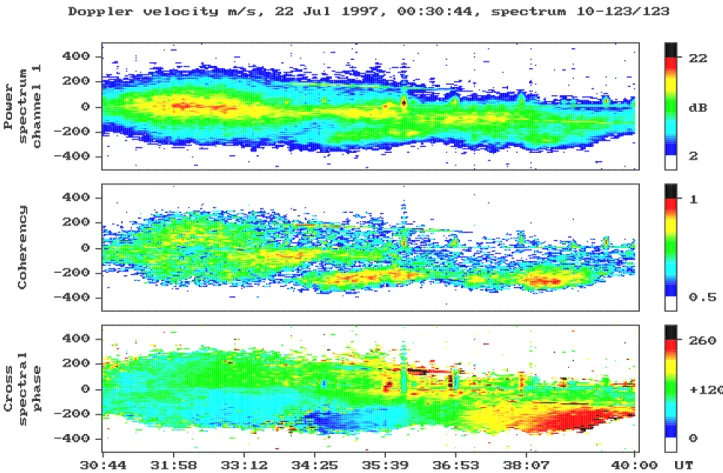
Fig. 3.An example of SESCAT Interferometer measurements during an active period of mid-latitude scatter. Shown are color-coded Doppler spectrograms of the logarithmic power spectra (top panel) and cross-spectral coherency and phase (lower two panels). The cross-spectral estimates reveal the presence of various echoing sub-volumes inside the radar viewing volume and provide information about the sizes, azimuthal location and zonal motion of these unstable regions.
and cross-spectral coefficients were finally stored on disk as averages of six sequential time series and, as such, aver-aged cross-spectral estimates of 4.9152 s were available for subsequent analysis. These averages were used to compute the normalized cross-power amplitude spectrum, or the co-herencyγ12(f ),
γ12=
s
hC12(f )i2+ hQ12(f )i2 hS1(f )ihS2(f )i
(2) and the cross-phase spectrum812(f )
812(f )=arctan
hQ
12(f )i hC12(f )i
. (3)
Note that in the above notation, subscripts 1 and 2 corre-spond to the west and east interferometer antennas, respec-tively. Also, the ensemble averaging notation here denotes time averaging over six successive 2048-point fast Fourier transforms in time.
Figure 2 shows the scattering source mean sizes, which were inferred from the measured coherencies and computed from the equation
¯ Ls(f )=
2r krd
p
ln(1/γ12(f ), (4)
given by Farley et al. (1981). The source mean size was com-puted in Fig. 2 for three radar ranges, in order to also esti-mate the anticipated errors due to range uncertainties, which are inherent in a CW bistatic radar. The solid line curve is for the most likely range of 185 km that corresponds to exact per-pendicularity at E-region altitudes near 105 km, the altitude usually assumed to be optimal for plasma instability excita-tion. In addition, also shown in Fig. 2 are the corresponding curves for the ranges of 170 km (dashed curve) and 210 km (dotted curve), which represent the lower and upper range limit, respectively. As seen, the maximum errors anticipated for L¯s, because of uncertainties in range for this
interfero-metric configuration, are not much larger than∼10%. Finally, since no effort was made to calibrate the cross-phase measurements, only relative cross-cross-phase values are of importance here. Variations in the relative cross-phase with time can be measured accurately and subsequently used to compute the source traverse speeds. In the present configu-ration of azimuthal (zonal) interferometry, the traverse speed of a localized source can be estimated from sequential cross-phase spectra by using the expression
Vx(f )= r krd
1812(f )
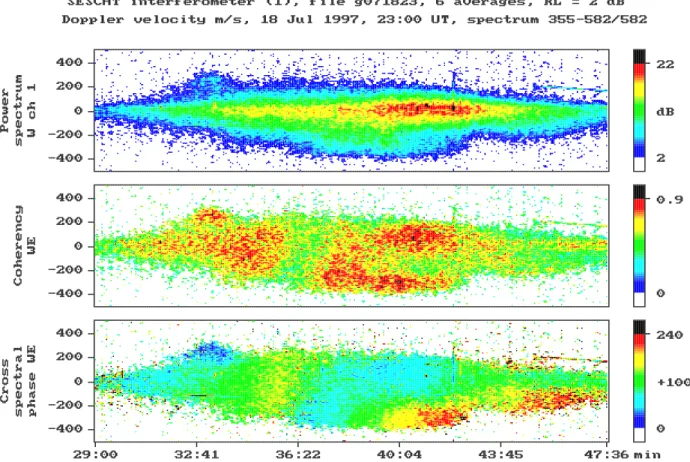
Fig. 4. Same presentation as in Fig. 3 but for a backscatter burst which is commonly associated with mid-latitude type 2 echoes. The coherency and cross-phase spectrograms reveal additional structure and the presence of a region which is weakly, or marginally, unstable to the Farley-Buneman instability.
and taking the range r equal to the most likely range of 185 km. Again, the maximum errors due to range uncer-tainties are expected to be less than about 10 to 12%. As for the polarity of the motion, it is to the west (east) when 1812(f )increases (decreases). The polarity was confirmed by moving a test transmitter unit across the receiver beams.
3 Observations and discussion
In this section we present and discuss selected interferomet-ric observations from different periods of SESCAT opera-tion. Although these examples tend to typify our data base, they are by no means exhaustive. The interferometry records are characterized by a great variety of “signatures” reflecting the complexity and dynamics in the scattering medium, and provide information which is unobservable in the Doppler spectra.
The complexity in the scattering volume and the turbu-lent nature of the unstable plasma can be appreciated in Fig. 3 which refers to an active period of SESCAT 50 MHz backscatter. The Doppler power spectrogram (Doppler velocity-time-power) seen in the upper panel is shown only for the west receiver, since the east receiver one is basi-cally identical. They-axis presents the Doppler velocity
ex-pressed in m/s (with the negative sign corresponding to mo-tions away), whereas the spectral power intensity is color-coded as the signal-to-noise power ratio in dB. This figure shows a typical sequence of backscatter bursts having broad spectra, peaking at small Doppler shifts.
1594 C. Haldoupis et al.: 50 MHz interferometer observations of unstable sporadic E-layers
Fig. 5.It refers to the event of Fig. 4, but now the cross-spectral coefficients (coherency and phase) are averaged inside three selected Doppler bands (marked in the upper panel) and plotted in time, using characteristic band symbols, only if the coherencies are large. The positive (negative) phase slopes with time in the bottom panel refer to westward (eastward) bulk motions of the corresponding localized scattering regions depicted by the high coherencies in the middle panel.
at the same azimuth which means that these regions must come from different altitudes. Some backscatter bursts ex-hibit a progressive phase change with time, clearly suggest-ing a westward bulk motion, e.g. see the gradual change in color from green to yellow and then red in the last burst of scatter from about 19:47 to 19:53 UT, which translates into a westward speed of∼100 m/s. The complicated situation illustrated in Fig. 3 is seen often during active periods of in-stability.
3.1 Type 2 and Type 1 echoes
Figure 4 refers to a typical event which is spectrally identified with type 2 echoes and, as in Fig. 3, it summarizes both the power spectral and cross-spectral information. Note that type 2 echoes are attributed to short-scale isotropic turbulence, consisting of short-lived, low phase velocity plasma wave in-homogeneities propagating in every direction in the aspect sensitive plane perpendicular to the magnetic field. Our un-derstanding of type 2 echoes relies on the theory of Sudan (1983), which models a nonlinear process of wave-wave in-teraction resulting in a turbulent cascade of wave energy from larger scale plasma waves, directly generated by the gradi-ent drift instability, to meter scale plasma irregularities which
are capable of scattering the incident VHF radio waves. As shown by Haldoupis et al. (1997) and, contrary to the equa-torial and auroral electrojets, the mid-latitude type 2 echoes represent the overwhelming majority of radar backscatter.
Fig. 6.Same as Fig. 4 but for a case when both type 2 and type 1 echoes are seen simultaneously. The cross-spectral information shows that the two echo types come from different scattering regions located at different azimuths and that they both move westward but with different speeds.
A more quantitative view can be gained if we focus on averaged coherency and cross-phase values inside the spec-tral band where a distinct region of backscatter is located. Our analysis software allows for the selection of either two or three adjacent bands of variable width across the Doppler spectrum and computes the mean coherencies and cross-phases inside those bands, which are then plotted as a func-tion of time. This form of presentafunc-tion is shown in Fig. 5 for the event presented in Fig. 4. The upper panel shows the Doppler power spectrogram (same as in Fig. 4 but hav-ing a lower color-coded resolution), where also the 3 spectral band boundaries are marked by solid lines and identified on the right by the colored symbols. Here, the central band is identified by open circles and is set to±150 m/s, the lower band of negative Doppler shifts has its limits between−150 and−320 m/s and is marked by red triangles, while the blue triangles refer to the positive Doppler shift band which is set between +150 m/s and +320 m/s.
The mean cross-spectral values for the three bands just de-scribed are plotted, using their band symbols, in the lower two panels of Fig. 5 ifγ12 >0.6. This coherency level was set arbitrarily in order to de-crowd the plots and thus focus on the dominant cross-spectral trends which are statistically the most stable. Note that, besides using standard labelling
for the coherency and cross-phase, which are labelled along the right-handy-axis, we also use distance which is labelled in km on the left-handy-axis of the figures. These distances represent the root mean square azimuthal extent of the scatter source (for coherency) and the zonal distance travelled by the source across the interferometer lobe (for cross-phase). Their scaling is in line with the ionospheric interferometry theory that was outlined in the previous section and corresponds to the optimal range of 185 km.
az-1596 C. Haldoupis et al.: 50 MHz interferometer observations of unstable sporadic E-layers
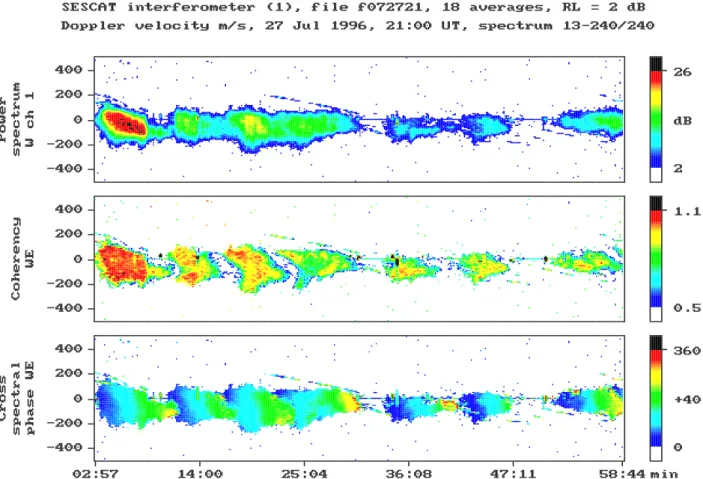
Fig. 7. Power spectra and cross-spectral Doppler spectrograms for a typical example of quasi-periodic (QP) echoes having, on average, a period of∼8 min. As seen, the QP echoes are basically a sequence of individual plasma structures which are unstable as they move across the radar beam.
imuth but move zonally in opposite directions with the low Doppler shift region traversing eastward at about−20 m/s, whereas the high velocity region moves westward at 89 m/s. Assuming that the individual backscatter regions move with the neutral wind, the last observation is suggestive of a verti-cal zonal wind shear with the simultaneous type 1 and type 2 echoes coming from different altitudes and thus having dif-ferent zonal speeds.
Figure 6 shows another example of type 2 and type 1 echoes. The Doppler spectrogram in the upper panel starts with a burst of strong scatter having broad Doppler spectra that identify with the familiar spectral signature of type 2 echoes. This is followed by some weaker bursts with nar-row spectra near zero Doppler shift, accompanied also by a narrow spectral band of faint backscatter at large negative Doppler velocities, presumably of type 1 (e.g. see Haldoupis et al., 1997). The latter is depicted more clearly in the co-herency plot which shows that the weak type 1 echoes origi-nate from rather localized regions of backscatter that occupy different azimuths relative to the simultaneous low veloc-ity echoes. The cross-phase changes with time in the lower panel show that all regions undergo a bulk motion to the west. A detailed analysis (similar to that in Fig. 5) of the data in Fig. 6 reveals the following: (1) The type 2 echoes are
structured in Doppler velocity (or Doppler shift), with the positive and negative Doppler bands coming from zonally adjacent echoing regions separated by a few kilometers. Both Doppler bands move as an entity across the radar beam with a speed near 50 m/s which means they associate with one and the same unstable plasma region. This situation, which is observed regularly in our data, is in contradiction with the notion of isotropic plasma turbulence characterizing type 2 echoes, a fact that has been pointed out before in a paper by Hussey et al. (1999). This option, of course, does not exclude the possibility that the gradient drift instability does operate in each region to generate irregularities that move in opposite directions under the action of oppositely directed zonal electric fields and favorable plasma density gradients. (2) The type 1 echoes show no structure across their Doppler band and all they come from the same localized region. The localized regions of type 1 echoes in Fig. 6 have mean zonal scales of less than 8 km and traverse across the beam to the west with speeds near 120 m/s.
3.2 Quasi-periodic echoes
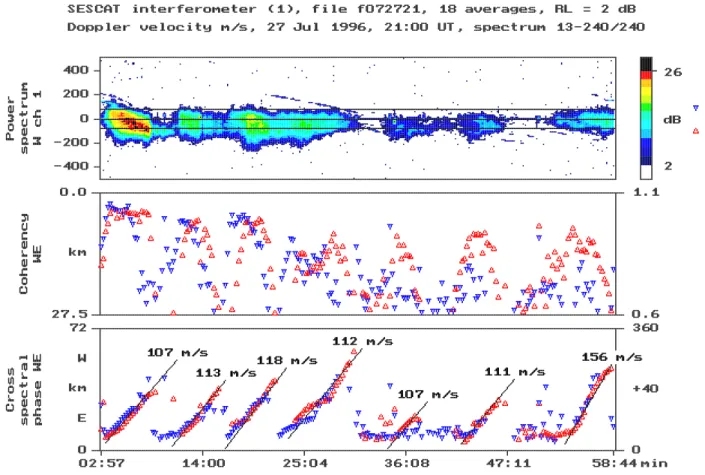
Fig. 8. Same presentation as in Fig. 5, but for the QP event shown in Fig. 7. The cross-phase time slopes in the bottom panel indicate westward speeds near 110 m/s for most of the sequential backscatter regions as they traverse across the radar field-of-view with the neutral wind.
Kyoto (e.g. see Yamamoto et al., 1991), refers to periodic sloping striations in RTI (range-time-intensity) radar plots, having periods from a few minutes to a few tens of minutes. These spectacular RTI signatures attracted considerable at-tention and a great deal of research has been done since the first QP measurements (e.g. see Hysell and Burcham, 2000 and references therein). Recently, Hysell et al. (2002a) used sophisticated in-beam radar imaging observations, and ap-plied both refraction and finite magnetic aspect angle effects to prove that the RTI striations of QP echoes are simply the signatures of migration of spatially localized and strongly unstable plasma structures, inside a sparsely-filled radar vol-ume. However, what is striking with some QP echoes, which is not yet well understood, is their pronounced periodicity.
Figure 7 shows an example of a QP echo observed by the SESCAT interferometer. The power Doppler spectrogram in the top panel shows a series of 7 successive scatter bursts of variable intensity that occur within a period of about 7 to 9 min. The periodic character of this echo is accentuated greatly in the coherency (middle panel) and the cross-phase (bottom panel) spectrograms. Clearly detected here are a se-ries of 7 discrete regions of instability that traverse in time sequence across the aspect sensitive area viewed by the radar, suggesting also some degree of space coherence.
The cross-phase changes with time (d8/dt) in the lower
panel of Fig. 7 are very similar in all scatter bursts, display-ing a repeated pattern of zonal bulk motion havdisplay-ing a west-ward velocity component near 100 m/s. Also inferred is a southward velocity component of bulk motion, because the cross-phase changes in all structures span only part of the 360◦ interferometer lobe, that is, most colors change from dark blue to green, which is equal to an∼230◦phase span. This means that all sequential regions must enter the aspect sensitive field-of-view from the northeast and move out in the southwest. This sequence of scatter could have appeared in an RTI plot of a radar like MU, as seven negatively sloping periodic striations, that is, a “QP classic” signature. Finally, it is interesting to note that despite the likely presence of a sizable southward component of bulk motion, the observed mean Doppler shift remains on average negative. This sug-gests that the negative mean phase velocities of the scattering irregularities are most likely higher than those observed.
cross-1598 C. Haldoupis et al.: 50 MHz interferometer observations of unstable sporadic E-layers phases show nearly parallel positive slopes for each
travers-ing backscatter burst, which amounts to westward speeds be-tween about 100 and 110 m/s (except for the last burst where this speed is near 150 m/s). We attribute these speeds to a strong westward wind, in line also with a recent study of QP echoes by Haldoupis et al. (2001) and many other radar stud-ies (e.g. see Tsunoda et al., 1994). Finally, the phase velocity span covered in succession by each drifting region suggests a zonal scale length of about 30 to 40 km on average, that is, this is the mean spatial separation between successive insta-bility regions.
A new model developed for QP echoes in a series of two recent papers by Hysell et al. (2002a, b) may account for most of the observations. It is based on the notion of dense plasma blobs, or clouds, which drift southwestward with the background wind. Also in line with the polarization mech-anism proposed by Haldoupis et al. (1996) and modelled by Shalimov et al. (1998), the numerical simulations of Hysell et al. (2002b) predict that a plasma blob, under the action of an ambient southward electric field and/or a strong west-ward zonal wind, is subject to strong zonal polarization fields which set up inside the blob and locally drive Hall currents that can destabilize the plasma via the gradient drift and/or the Farley-Buneman instabilities. According to Hysell et al. (2002b), the polarization fields are sustained through a complicated current closure system in the inner and outer edges of the blob and along the magnetic field lines in the F-region. In this model, the electrons undergo rapid north-ward drifts inside the plasma structure and slower southnorth-ward drifts at the edges, which suggests different Doppler polar-ity echoes between both the leading and trailing blob edges (small positive shifts) and the blob central region (larger neg-ative shifts). This pattern is supported only partially by our interferometer data showing that in some bursts of scatter their positive Doppler shifts (blue triangles) lead in azimuth the negative shifts (red triangles); this trend, however, pre-vails across the entire plasma structure and there is no change in Doppler polarity at its trailing edge.
Finally, the Hysell et al. (2002a) interpretation for QP echoes does not deal with, and thus provides no explana-tion for, the source of the observed periodicity, that is, the mechanism that forces these unstable regions to form some-times in a well-defined wave-like sequence. The fact that QP echoes are due to unstable plasma blobs drifting with the neu-tral wind made Hysell et al. (2002a) speculate that they may originate from neutral wind shear instabilities and are simply Kelvin-Helmholtz billows, in accordance with the QP gener-ation mechanism proposed by Larsen (2000) and modelled recently by Bernhardt (2002). Bernhardt’s model predicts typical time scales of less than 10 minutes and spatial scale lengths of less than about 10 km, which seems to agree, at least for the QP echoes under consideration.
4 Summary and concluding points
In this paper we introduce the conversion of SESCAT (a 50 MHz continuous wave (CW) Doppler radar located in Crete) into a single baseline interferometer. This was im-plemented in order to utilize the advantages of a CW radar, that is, its excellent time and Doppler frequency resolutions, in order to study short-term dynamics and traverse motions of localized regions of instability. In this experiment, the in-terferometer baseline was oriented approximately along the east-west direction; thus, the system was capable of monitor-ing the scattermonitor-ing region in the zonal (azimuthal) direction. As can be inferred from the observations so far, the conver-sion of SESCAT from a single CW Doppler radar into an in-terferometer did improve its potential for studying E-region backscatter.
Since this is the first paper on SESCAT interferometry, we provide here all necessary details about the interferometer characteristics and its capabilities. Although we made an ef-fort also to select and discuss typical observations, we feel there is a lot more left in our data that needs to be studied, a task already under way. The findings and conclusions of the present analysis are summarized as follows:
1. The broader ionospheric region viewed by the radar during an active period of backscatter is not a con-tinuum but rather a strongly structured and inhomoge-neous medium. Usually, it is filled with a few spatially confined regions of plasma instability that drift, pre-sumably with the neutral wind, through the radar beam. These unstable plasma structures, which can be iden-tified as plasma “blobs”, “clouds”, or “patches”, must relate to spatially inhomogeneous (patchy) sporadic E-layers. This picture, and the need for a better physi-cal understanding, perhaps points to a new generalized nonlinear approach for the unstable E-region, developed by St.-Maurice and Hamza (2001), which describes the essential physics of the plasma instabilities in terms of non-periodic polarized plasma structures.
Larsen et al., 1998; Haldoupis et al., 2001, among sev-eral others). We suspect that these westward motions of the mid-latitude E-region backscatter is an inherent property of the phenomenon, which might be of impor-tance not only in creating theEs layering, but also in
the destabilizing process as well, for example, along the lines of the wind-driven instability mechanism of Ka-gan and Kelley (1998), and in setting up strong east-ward polarization electric fields (e.g. Haldoupis et al., 1997) which then can excite the gradient drift and/or the Farley-Buneman instabilities.
3. The spectral estimates (coherency and cross-phase) provide additional information to that inferred only by the commonly measured Doppler power spec-tra, which is especially useful in the identification and study of the various irregularity types, for example, those relating to type 1 and type 2 echoes. In particu-lar, and thanks to the measured cross-spectral estimates, we conclude that weak type 1 echoes are much more common in mid-latitude VHF backscatter than it was assumed so far from the Doppler spectra measurements alone (e.g. see Haldoupis et al., 1997). This implies that inside patches of mid-latitude sporadic E-region plasma the electric field can often reach values nearing 10 to 15 mV/m or even higher.
4. The measured cross-spectral estimates show that the echoes identified by their Doppler spectra as type 2 are often in contradiction with the notion of strong (Sudan-type) isotropic turbulence (e.g. see Fejer and Kelley, 1980). Often, typical backscatter bursts of type 2 echoes, which are characterized by broad spectra cen-tered near zero Doppler shift, are the result of signal su-perposition from two separate, non-collocated regions of instability which are adjacent in azimuth but produce scatter of opposite Doppler polarity. We believe these observations are of importance in better understanding the nature of type 2 echoes and will be taken up in a future detailed study. On the other hand, whenever ob-served, type 1 echoes relate only with one region of in-stability, producing either negative or positive Doppler shifts.
5. Because of their patchy appearance, and since they are associated with discrete blobs of plasma travers-ing across the radar beam, all mid-latitude echoes seem to inherently bear a degree of quasi-periodic charac-ter. However, there are cases in which this periodic-ity is well defined and strongly pronounced, suggest-ing the involvement of a wave-like process. Appar-ently, these echoes identify with the QP (quasi-periodic) echoes seen as striations in RTI plots of pulsed radars, as, for example, the large MU radar in Japan which was the first to observe them (Yamamoto et al., 1991). The SESCAT interferometer observations show that QP echoes are simply individual scattering (unstable) re-gions moving in a time sequence across the radar beam.
This is in agreement with the interpretation produced recently by Hysell et al. (2002a), who used detailed in-beam MU radar imaging observations. In our opinion, there is nothing exceptional in QP echoes with respect to the operating instability mechanism which makes them different from the rest of mid-latitude backscat-ter; the only question that remains to be clarified relates to the physics of the process(es) that makes those drift-ing unstable patches of plasma traverse across the radar beam in a wave-like sequence.
Acknowledgements. Support for the completion of this experiment was provided by the European Office of Aerospace Research and Development (EOARD), Air Force Office of Scientific Research, Air Force Research Laboratory, under contract F61775-01-WE004 to C. Haldoupis. We are grateful to Dr. Martial Oger of the Univer-sity of Rennes, and Dimitris Zouridis of the UniverUniver-sity of Crete, for valuable technical support and advice.
Topical Editor M. Lester thanks J. L. Chau and C. Hanuise for their help in evaluating this paper.
References
Bernhardt, P. A.: The modulation of sporadic-E layers by Kelvin-Helmholtz billows in the neutral atmosphere, J. Atmos. Sol-Terr. Phys., 64, 1487, 2002.
Bourdillon, A., Haldoupis, C., and Delloue, J.: High frequency Doppler radar observations of magnetic aspect sensitive irregu-larities in the mid-latitude E-region ionosphere, J. Geophys. Res., 100, 21 503, 1995.
Farley, D. T., Ierkic, H. M., and Fejer, B. G.: Radar interferome-try: A new technique for studying plasma turbulence in the iono-sphere, J. Geophys. Res., 86, 1467, 1981.
Fejer, B. G. and Kelley, M. C.: Ionospheric irregularities, Rev. Geo-phys., 18, 401, 1980.
Fejer, B. G., Providakes, J. F., Farley, D. T., and Swartz, W. E.: Au-roral E-region plasma waves and elevated electron temperatures, J. Geophys. Res., 91, 13 583, 1986.
Haldoupis, C., Sofko, G. J., Koehler, J. A., Prikryl, P., and McK-ibben, M. J.: High-resolution CW interferometry for auroral ionospheric studies, Preliminary results, J. Geophys. Res., 93, 5777, 1988.
Haldoupis, C. and Schlegel, K.: A 50 MHz radio Doppler experi-ment for mid-latitude E-region coherent backscatter studies. Sys-tem description and first results, Radio Science, 28, 959, 1993. Haldoupis, C. and Schlegel, K.: Characteristics of mid-latitude
co-herent backscatter from the ionospheric E region obtained with SESCAT, J. Geophys. Res., 101, 13 387, 1996.
Haldoupis, C., Schlegel, K., and Farley, D. T.: An explanation for type 1 radar echoes from the mid-latitude E-region ionosphere, Geophys. Res. Lett., 23, 97, 1996.
Haldoupis, C., Farley, D. T., and Schlegel, K.: Type 1 radar echoes from the mid-latitude E-region, Ann. Geophysicae, 15, 7, 908, 1997.
Haldoupis, C., Hussey, G. C., Bourdillon, A., and Delloue, J.: Azimuth-Time-Intensity striations of quasiperiodic radar echoes from the mid-latitude E-region ionosphere, Geophys. Res. Lett., 28, 1933, 2001.
1600 C. Haldoupis et al.: 50 MHz interferometer observations of unstable sporadic E-layers Vincent, R. A.: Empirical wind model for upper, middle, and
lower atmosphere, J. Atmos. Terr. Phys., 58, 1421, 1996. Hussey, G. C., Haldoupis, C., Bourdillon, A., and Andr´e, D.:
Spa-tial occurrence of decameter mid-latitude E-region backscater, J. Geophys. Res., 104, 10 071, 1999.
Hysell, D. L. and Burcham, J. D.: The 30-MHz radar interferometer studies of mid-latitude E-region irregularities, J. Geophys. Res., 105, 12 797, 2000.
Hysell, D. L. and Chau, J. L.: Imaging radar observations and non-local theory of large-scale plasma waves in the equatorial elec-trojet, Ann. Geophysicae, 20, 1167, 2002.
Hysell, D. L., Yamamoto, M., and Fukao, S.: Imaging radar obser-vations and theory of type I and type II quasiperiodic echoes, J. Geophys. Res., 107, ido10.1029/2002JA009292, 2002a. Hysell, D. L., Yamamoto, M., and Fukao, S.: Simulations of plasma
clouds in the mid-latitude E-region ionosphere with implications for type I and type II quasiperiodic echoes, J. Geophys. Res., 107, ido10.1029/2002JA009291, 2002b.
Ierkic, H. M., Haldoupis, C., Moorcroft, D. R., and Nielsen, E.: Coherent radar interferometry of vertical irregularity structures in the auroral E-region, Radio Sci., 27, 743, 1992.
Kagan, L. M. and Kelley, M. C.: A wind-driven gradient drift mech-anism for mid-latitude E-region ionospheric irregularities, Geo-phys. Res. Lett., 25, 4141, 1998.
Kudeki, E., Farley, D. T., and Fejer, B. G.: Long wavelength irreg-ularities in the equatorial electrojet, Geophys. Res. Lett., 9, 684, 1982.
Kudeki, E. and Farley, D. T.: Aspect sensitivity of equatorial irreg-ularities and theoretical implications, J. Geophys. Res., 94, 426, 1989.
Larsen, M. F.: A shear instability seeding mechanism for quasi-periodic radar echoes, J. Geophys. Res., 105, 2931, 2000. Larsen, M. F., Fukao, S., Yamamoto, M., Tsunoda, R. T., Igarashi,
K., and Ono, T.: The SEEK chemical release experiment: Ob-served neutral wind profile in a region of sporadic-E, Geophys. Res. Lett., 25, 1789, 1998.
Providakes, J. F., Swartz, W. E., Farley, D. T., and Fejer, B. G.: First VHF auroral radar interferometer observations, Geophys. Res. Lett., 10, 401, 1983.
Riggin, D., Swartz, W. E., Providakes, J., and Farley, D. T.: Radar studies of long-wavelength waves associated with mid-latitude sporadic-E layers, J. Geophys. Res., 91, 8011, 1986.
Roble, R. G. and Ridley, E. C.: A thermosphere – ionosphere – mesosphere electrodynamics general circulation model (time-GCM): Equinox solar cycle minimum simulations (30–500 km), Geophys. Res. Lett., 21, 417, 1994.
Schlegel, K. and Haldoupis, C.: Observation of the modified two-stream plasma instability in the mid-latitude E-region iono-sphere, J. Geophys. Res., 99, 6219, 1994.
Shalimov, S., Haldoupis, C., and Schlegel, K.: Large polarization electric fields associated with mid-latitude sporadic-E, J. Geo-phys. Res., 103, 11 617, 1998.
St.-Maurice, J.-P. and Hamza, A. M.: A new linear approach to the theory of E-region irregularities, J. Geophys. Res., 106, 1751, 2001.
Sudan, N.: Unified theory of type 1 and type 2 irregularities in the equatorial electrojet, J. Geophys. Res., 88, 4853, 1983.
Tanaka, T. and Venkateswaran, S. V.: Characteristics of field-aligned E-region irregularities over Ioka (36◦), Japan, I., J. At-mos. Terr. Phys., 44, 395, 1982.
Tsunoda, R. T., Fukao, S., and Yamamoto, M.: On the origin of quasiperiodic backscatter from sporadic-E, Radio Sci., 29, 349, 1994.
Woodman, R. F.: Inclination of the geomagnetic field measured by incoherent scatter, J. Geophys. Res., 76, 178, 1971.