Article
J. Braz. Chem. Soc., Vol. 22, No. 5, 867-874, 2011. Printed in Brazil - ©2011 Sociedade Brasileira de Química
0103 - 5053 $6.00+0.00
A
*e-mail: [email protected]
Ethambutol Analysis by Copper Complexation in Pharmaceutical Formulations:
Spectrophotometry and Crystal Structure
Adriana F. Faria,a Luiza F. Marcellos,a Juliana P. Vasconcelos,a Marcus V. N. de Souza,b Antônio L. S. Júnior,a Weberton R. do Carmo,a Renata Diniza and Marcone A. L. de Oliveira*,a
aDepartamento de Química, Instituto de Ciências Exatas, Universidade Federal de Juiz de Fora,
36036-330 Juiz de Fora-MG, Brazil
bInstituto de Tecnologia em Fármacos-Far Manguinhos, Fundação Oswaldo Cruz,
21041-250 Rio de Janeiro-RJ, Brazil
Um método alternativo para determinação de etambutol (ETB) por espectrofotometria UV em formulações farmacêuticas por complexação com Cu(II) foi otimizado usando um planejamento fatorial completo 32, tendo como variáveis Cu(II) e tampão aquoso de acetato de sódio em pH 4,6.
A estequiometria predominante do complexo em solução aquosa tamponada nesse pH e a constante de formação do complexo foram obtidas usando o método de Job e o diagrama de Scatchard, respectivamente. A estrutura cristalina do complexo de monocristal foi obtida por difração de raios X. O método espectrofotométrico foi aplicado na análise de formulação farmacêutica sendo encontrado: 408,0 ± 11,9 mg de ETB•2HCl, faixa de recuperação de 100,9-104,0% e limites de
detecção e quantiicação de 0,8 e 2,8 mg L-1, respectivamente. O método espectrofotométrico ao ser
comparado com o método por eletroforese capilar de zona não evidenciou diferenças signiicativas no intervalo de 95% de coniança.
An alternative method for ethambutol (ETB) determination by UV spectrophotometry in pharmaceutical formulations using ETB complexation with Cu(II) was optimized employing a 32
full experimental design having Cu(II) and aqueous acetic acid/sodium acetate buffer at pH 4.6 as variables. The predominant complex stoichiometry in aqueous buffer solution at this pH and formation constant were obtained by using Job’s method and Scatchard diagram, respectively. The complex crystalline structure of monocrystal was obtained by X-ray diffraction. The developed method was applied to the pharmaceutical formulation analysis being found: 408.0 ± 11.9 mg of ETB•2HCl, recovery range of 100.9-104.0% and detection and quantiication limits of 0.8
and 2.8 mg L-1, respectively. The spectrophotometric method was compared to zone capillary
electrophoresis and no signiicant difference was found within the 95% conidence interval.
Keywords: ethambutol, complexation, spectrophotometry, crystal structure
Introduction
Nowadays, tuberculosis (TB) is becoming a worldwide problem. This contagious disease is transmitted through the air and it is caused by the bacterium Mycobacterium tuberculosis, which can attack different organs of the human body. However, it most commonly affects the lungs, accounting for more than 75% of the cases.1 According to the World Health Organization (WHO), more than two billion people are infected with TB bacilli and a total of 1.77 million people died from TB in 2007.2 Nowadays,
the arabinofuranosyl transferases important enzymes that promote the polymerization of arabinose into the arabinan domain of arabiongalactan which together with peptidoglycan are essential components in the cell wall of the Mycobacterium tuberculosis.
Due to the importance of ETB in TB treatment, different analytical methods such as UV-Visible spectrophotometry,5 atomic absorption spectrometry,5 potentiometry,5 high performance liquid chromatography (HPLC)6,7 and capillary electrophoresis (CE)8-11 have been reported. As for spectrophotometric analysis, direct ETB determination in UV range is not feasible due to low molar absorptivity, thus requiring derivatization. Hassan and Shalaby5 proposed ETB spectrophotometric analysis by means of complexation reaction between copper phosphate and ETB in medium of borate buffer pH 9.2 and read the absorbance of the inal solution at 640 nm. This method involves steps such as heating, cooling and iltration before absorbance reading, making sample preparation procedure long and arduous. Within this context, the present work studies the development and optimization of a fast and simple alternative spectrophotometric method for ETB determination in pharmaceutical formulations at 262 nm using fast complexation with Cu(II) in pH 4.6.
Experimental
Chemicals and solutions
All chemicals were of analytical grade. Acetic acid, sodium hydroxide, copper(II) sulphate pentahydrate and copper(II) nitrate were purchased from Vetec (Duque de Caxias-RJ, Brazil), ethambutol dihydrochloride (ETB•2HCl) from Genix Indústria Farmacêutica (Anápolis-GO, Brazil).
Aqueous acetic acid/sodium acetate buffer (HAc/NaAc) (pH 4.6), stock solution containing a concentration of 50.0 and 100.0 mmol L-1 and aqueous copper(II) sulphate pentahydrate (CuSO4•5H2O) stock solution containing 5.0 and 50.0 mmol L-1 were used in the preparation of solutions for the spectrophotometric study and for the capillary zone electrophoresis (CZE), respectively.
Aqueous ETB•2HCl stock solution containing 2.5 mol L-1 was used for method optimization and sample quantification, after adequate dilution in appropriate concentration of buffer and Cu(II).
Aqueous ETB•2HCl stock solution and aqueous CuSO 4 stock solution containing 1.0 mol L-1 were used during procedures for Job’s method and Scatchard diagram.
CuETB crystallization
The compound CuETB was prepared as follows: 0.0560 g of ETB•2HCl was dissolved in ethanol and 3.0 mol L-1 of HAc/NaAc buffer solution. The pH of inal solution was 5.0. It was added to this solution an ethanolic solution of Cu(NO3)2 containing 0.1326 g by diffusion. After 4 months (under rest at room temperature), suitable blue single crystals were obtained. The elemental analyses for C, H and N were carried out in a Perkin-Elmer 2400 analyzer (Waltham, Massachusetts, USA), and the results for the obtained CuETB were as follows: calculated: C, 33.24%; H, 5.58%; N, 11.63; found: C, 33.51%; H, 6.87%; N, 12.79%.
Sample preparation
Twenty ETB•2HCl tablets were individually weighed and ground to homogeneously ine powders. The powder corresponding to 7.0 mg of active ingredient for each tablet was weighed and dissolved in 10.00 mL of water in a volumetric lask. After 10 min of sonication, the suspensions were iltered through a 0.45 µm Millipore filter (São Paulo-SP, Brazil) in order to obtain clear solutions. The samples were diluted to 44.2 mg L-1 of ETB•2HCl in 0.5 mmol L-1 of CuSO4 and 5.0 mmol L-1 of HAc/NaAc buffer before spectrophotometric and CE analysis.
Instrumentation
The measurements of absorption spectra were made in a double-beam in time UV-Vis spectrophotometer system (model UV-1601PC, Shimadzu, Kyoto, Japan) using quartz regular cells of optical path equal to 1.0 cm.
Single crystal X-ray data were collected using a Bruker Kappa CCD diffratometer with Mo-Kα radiation
(λ = 0.71073 Å) at room temperature (298 K). Data collection, reduction and cell reinement were performed by COLLECT. EVALCCD and DIRAX programs.12-14 The structures were solved and reined using SHELXL-97.15 An empirical isotropic extinction parameter x was reined, according to the method described by Larson.16 H3C
H N N H OH HO CH3
pKa: 9.59 and 14.43
A multiscan absorption correction was applied.17 The structures were drawn by ORTEP-3 for Windows18 and Mercury19 programs. The C
10H24O5N3ClCu crystal data: M = 365.31 g mol-1, orthorhombic, a = 6.7029(5) Å, b = 13.929(1) Å, c = 18.094(1) Å, V = 1689.4(2) Å3, T = 298 K, space group P212121, Z = 4, µ(Mo-Kα)
1.470 mm-1, d
calc = 1.436 g cm-3, 9232 relections measured, 3643 unique (Rint = 0.052) which 2986 were used to reine 181 parameters, inal R(F), wR(F2) and S 0.043, 0.094 and 1.067, respectively. CCDC 769526 contains the supplementary crystallographic data for CuETBb compounds. These data can be obtained free of charge as informed in reference.20
The experiments involving separation were carried out in a CE system (HP3d CE, Agilent Technologies, Palo Alto, CA, USA) equipped with a DAD set at 262 nm, a temperature control device, maintained at 25 ºC, and data acquisition and treatment software (HP ChemStation, rev A.06.01). Samples were injected hydrodynamically (30 mbar, 5 s) and the electrophoretic system was operated under normal polarity and constant voltage conditions of (+25 kV). For all experiments, a fused-silica capillary (Polymicro Technologies, Phoenix, AZ, USA) 48.5 cm (40.0 cm effective length) × 75 µm ID × 375 µm OD was used.
The dissolution of samples and standards were carried out in a Unique ultrasonic cleaner, USC (2850) model, power of 120 W (São Paulo-SP, Brazil) - ultrasom.
Analytical procedures
Spectrophotometric measurement was performed by using aqueous solution of HAc/NaAc buffer and Cu(II) as reference in the same concentrations used to standards and sample dilution.
As for CE, when a new capillary was used, it was conditioned by a pressure lush of 1.0 mol L−1 NaOH solution (30 min), deionized water (5 min) and electrolyte solution (60.0 mmol L-1 of HAc/NaAc and Cu(II) of 5.0 mmol L-1) (10 min). Between runs, the capillary was replenished with 0.2 mol L−1 NaOH solutions (2 min), deionized water (2 min) and fresh electrolyte solution (3 min, pressure lush).
Software
Microsoft Excel 2007 was used to calculate matrices and to make a response surface graphic. A normality test (Shapiro–Wilk test), a homogeneity of variance test (Levene statistic) and an independent sample t-test were performed using SPSS 8.0 for windows.
Results and Discussion
Absorbance signal optimization
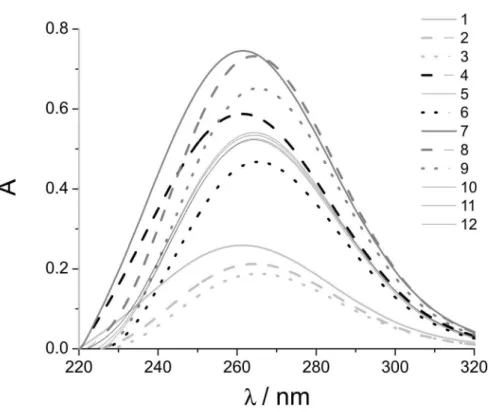
After conirming the formation of complex CuETB,7,10 a spectrophotometric study was made to maximize the absorbance signal. A 32 experimental design involving HAc/NaAc (pH 4.6) buffer and Cu(II) with triplicate in central point as factors was performed. The factors were evaluated in three concentration levels: 60.0, 32.5 and 5.0 mmol L-1 for HAc/NaAc buffer and 0.5, 0.3 and 0.1 mmol L-1 for Cu(II). Table 1 shows the experimental design matrix with responses and Figure S1 (supplementary information S1) the electronic spectra obtained.
By analyzing the results of 32 experimental design the CuETB complexation at levels (-1) of HAc/NaAc buffer and (+1) of Cu(II) was found to lead to the highest absorbance signal. Thus, the optimum condition found was 5.0 mmol L-1 of buffer HAc/NaAc and 0.5 mmol L-1 of Cu(II).
The response data obtained for absorbance are given in Table 1. By using a itted full quadratic model equation 1, a response surface regression analysis for each response factor was performed using coded units. Table 2 shows the values calculated for the coeficients and p-values (p-value is the probability of the null hypothesis). Using a 5% signiicance level, a factor is considered to affect the response if the coeficients differ signiicantly from zero and the p-value < 0.050.8
(1)
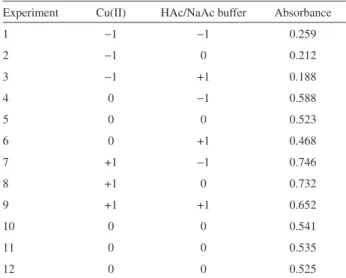
Table 1. Experimental design 32 and responses
Experiment Cu(II) HAc/NaAc buffer Absorbance
1 −1 −1 0.259
2 −1 0 0.212
3 −1 +1 0.188
4 0 −1 0.588
5 0 0 0.523
6 0 +1 0.468
7 +1 −1 0.746
8 +1 0 0.732
9 +1 +1 0.652
10 0 0 0.541
11 0 0 0.535
12 0 0 0.525
Cu(II) (mmol L-1): (−1) 0.1; (0) 0.3; (+1) 0.5.
The results show that only the terms [HAc/NaAc] × [HAc/NaAc] and [Cu(II)] × [HAc/NaAc] were not significant for absorbance, in other words the buffer quadratic parameter and the Cu(II) with buffer interaction were not significant. The fit models were evaluated (ANOVA) and the results found indicated that no evidence of lack of it was observed in the 95% conidence interval, because Fcal = 2.97is lower than Ftab(3;3;0.05) = 9.28. Thus, the representative surface response for the model is presented in Figure 2.
CuETB spectrophotometric study
Continuous variation method
The continuous variation method or Job’s method was used in order to establish the stoichiometry of the predominant complex:21
a Cu2+
(aq) + b ETB(aq) CubETBa(aq)
The procedure consisted of a mixture of equimolar quantities of Cu(II) and ETB as shown in Table 3. The HAc/NaAc buffer concentration was kept constant at 5.0 mmol L-1 (according to optimization by 32 experimental design) and absorbances were monitored at 262 nm. The corrected absorbance (equation 2) versus Cu(II) molar fraction was plotted.
Acorrected = Ameasured – εETB b cETB – εCu(II) b cCu(II) (2)
Figure 3 shows UV-Vis spectra for the 11 experiments and Job’s diagram. Job’s diagram analysis shows that the maximum absorbance reached in Cu(II) molar fraction was equal to 0.5 corresponding to the stoichiometry 1:1 of the predominant complex.
CuETB formation constant
Rigorously, to obtain the constant CuETB complex formation (Kf) it must be considered the activities of the species involved in the chemical equilibrium. However, for diluted solutions the coeficient of activity is close to the unity and the activity is close to the species concentration in the chemical system. Thus, Kf can be determined according to equation 3.21
(3)
Table 2. Model estimators for absorbance
Term Coeficient Error p-value
Constant 0.532 ± 0.004 0.000
[Cu(II)] 0.245 ± 0.003 0.000
[HAc/NaAc] −0.0475 ± 0.003 0.001
[Cu(II)] × [Cu(II)] −0.0629 ± 0.005 0.001 [HAc/NaAc] × [HAc/NaAc] −0.00690 ± 0.005 0.277
[Cu(II)] × [HAc/NaAc] −0.00575 ± 0.004 0.268
Figure 2. Surface response for itted model.
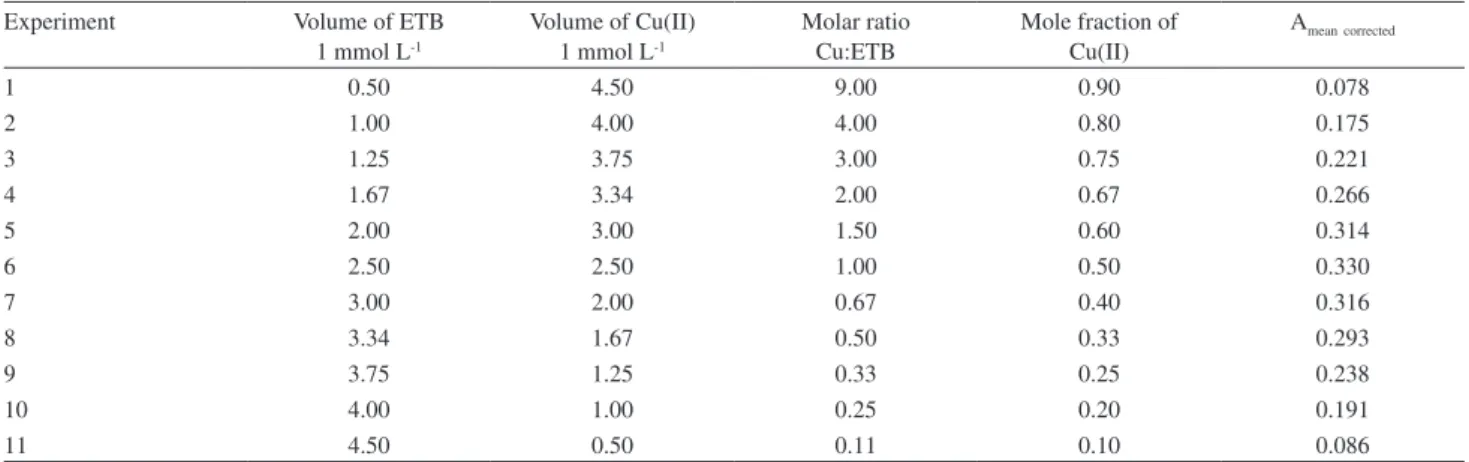
Table 3. Experiments for the continuous variation method
Experiment Volume of ETB
1 mmol L-1
Volume of Cu(II) 1 mmol L-1
Molar ratio Cu:ETB
Mole fraction of Cu(II)
Ameancorrected
1 0.50 4.50 9.00 0.90 0.078
2 1.00 4.00 4.00 0.80 0.175
3 1.25 3.75 3.00 0.75 0.221
4 1.67 3.34 2.00 0.67 0.266
5 2.00 3.00 1.50 0.60 0.314
6 2.50 2.50 1.00 0.50 0.330
7 3.00 2.00 0.67 0.40 0.316
8 3.34 1.67 0.50 0.33 0.293
9 3.75 1.25 0.33 0.25 0.238
10 4.00 1.00 0.25 0.20 0.191
11 4.50 0.50 0.11 0.10 0.086
A set of solutions containing constant ETB concentration and Cu(II) increments diluted in 5.0 mmol L-1 of HAc/ NaAc buffer (Table 4) was performed. The total ETB concentration is equal to:
(4)
Replacing equation 4 in equation 3:
(5)
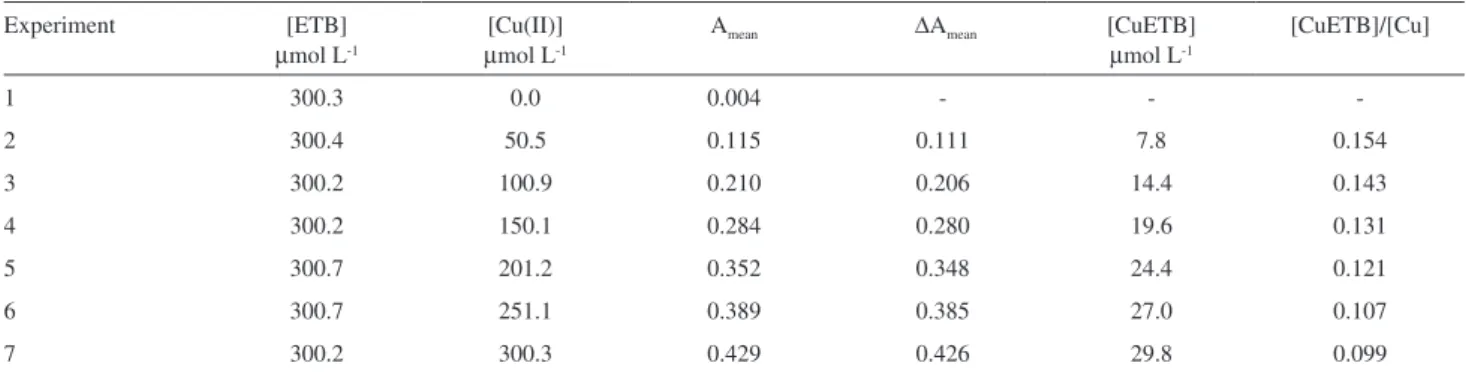
The complex concentration formed was calculated by Scatchard approach (equation 6). The molar absorptivities of ETB and complex (εETB and εCuETB) were determined by experiments 1 and 7, respectively (Table 4):
(6)
A plot of [CuETB]/[Cu] vs. [Cu] known as Scatchard diagram was itted (Figure 4) by linear regression model, obtaining a negative slope which corresponds to the Kf.
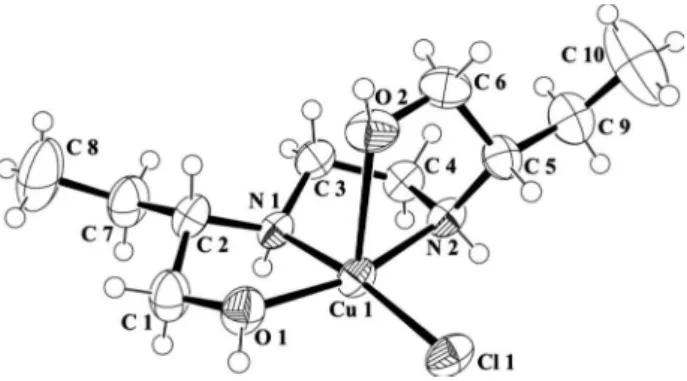
CuETB X-ray diffraction
Parallel to the CuETB complexation study, a study involving X-ray diffraction method on a single crystal of CuETB complex was performed. The crystal data are listed in Table S1 in supplementary material. It may be inferred from the crystal structure that the complex CuETB is cationic, similar to the crystal obtained and analyzed by liquid chromatography–mass spectrometry (LC–MS) after dissolution in methanol and water solution (1:1, v/v),10 although the species observed in the crystal is mono-cationic. This complex is mono-cationic and the neutrality is obtained by a nitrate anion present in the lattice. The
Figure 3. (A) UV-Vis spectra obtained for the continuous variation
method; (B) Job’s diagram.
Table 4. Experiments and results for the Scatchard diagram
Experiment [ETB]
µmol L-1
[Cu(II)]
µmol L-1
Amean ∆Amean [CuETB]
µmol L-1
[CuETB]/[Cu]
1 300.3 0.0 0.004 - -
-2 300.4 50.5 0.115 0.111 7.8 0.154
3 300.2 100.9 0.210 0.206 14.4 0.143
4 300.2 150.1 0.284 0.280 19.6 0.131
5 300.7 201.2 0.352 0.348 24.4 0.121
6 300.7 251.1 0.389 0.385 27.0 0.107
7 300.2 300.3 0.429 0.426 29.8 0.099
n = 2; ∆εCuETB = 14284.4 L mol-1 cm-1.
/
copper is coordinated to ive atoms giving rise to a square-pyramidal geometry (the trigonality index τ = 0.01), where the ETB acts as a tetradentate ligand (NH and OH groups) in a cis conformation and the geometry is completed with a chloride ion. The basal plane is formed by two N atoms, one O atom and the chloride ion, although the apical position is occupied by the OH group of the ETB molecule (Figure 5). The Cu-O bond distance of apical position is larger than the other copper bond distances of basal plane, indicating the Jahn-Teller distortion in this complex (Table S2). The Cl atom of cationic unit interacts with Cu of another cationic unit with Cl-Cu distance of 2.963(1) Å. This interaction form a one-dimensional network with a wave design which presents two different orientations in the crystal that are parallel to (011) and (001) directions. The Cu-Cu distance and the Cu-Cu-Cu angle in the same 1D chain are 4.968(1) Å and 84.8(1)°, respectively. The 1D chains are involved in hydrogen bonds to nitrate ions which form a three-dimensional arrangement.
Compounds formed by reaction of Cu(II) and ETB are described in the literature. Annapurna et al.22 synthesized the bivalent species [Cu(ETB)2]2+ by reaction of ETB•2HCl and CuCl2 using spectroscopic techniques to propose a structure where the Cu(II) is coordinated to two ETB molecules by NH groups only. Hassan and Shalaby5 also used spectroscopic information for suggesting the formation of cationic complex with ETB and Cu(II) in 1:1 ratio and that the ETB acts as a tetradentate ligand, similar to the crystal structure here obtained. Some cationic species of ETB unit are described in the literature.23-26 In these compounds the positive charge is obtained by protonation of NH groups of ETB. In solid state two conformations for quiral ETB cationic molecule (SS and RS) with some counter-ion were observed: nitrate,23,25 oxalate24 and sulfate.26 These species are stabilized by O-H…O and N-H…O hydrogen bond forming two23,25 and three-dimensional network.26 The observation of compound (I) in solid state indicates that the
ETB residue is in SS conformation. The Flack parameter27 for this compound is [0.04(2)] indicating that the absolute conformation is correct. This conformation is also observed in therapeutic active form of ethambutol dihydrochloride.28
The CuETB and ETB forms I and II crystallize in the same crystal system (orthorhombic) and the most relevant difference among of CuETB and ETB (forms I and II) is in N-C-C-O torsion angles. In ETB, which present a 2-fold axis in the middle of the molecule, this torsion angle is 58.6(6) and 54.2(10)° for forms I and II, respectively.28 In CuETB, N-C-C-O torsion angles are smaller than that observed to ETB (51.0(4) and 48.5(4)°) due to the fact that the OH groups are coordinated to metal site in the complex. Despite this, the coordination does not change the ETB residue conformation.
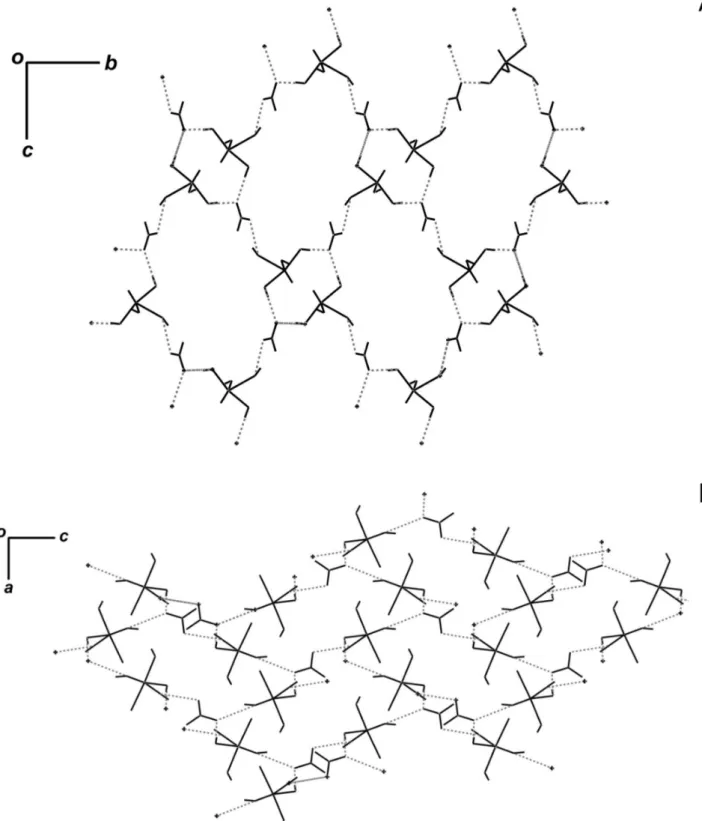
The CuETB crystal is stabilized by O-H…O and N-H…O hydrogen bonds where the O-O and N-O distances are around 2.740 and 3.035 Å, respectively. These interactions form a complex three-dimensional arrangement with three distinct graph-set29 N1 = C(8), N2 = C(17) R9
10(38), N3 = C(6). The O…O interactions give rise to a one-dimensional arrangement with wave design parallel to b axis formed by CuCl(NH)2(OH)2 unit and NO32–. The distance Cu-Cu in this wave design is 10.586(1) Å and the angle Cu-Cu-Cu is 82.3(1)°. On the other hand, the N…O interaction does not form a chain and these interactions are associated to another O-H…O hydrogen bond forming a wave design one-dimensional chain parallel to c axis. These two hydrogen bond wave designs form a two-dimensional net whose graph-set is C(17)R10(38), as it can be seen in Figure S6. The details of the hydrogen-bonding geometry are listed in Table S1. Two weak interactions are also observed in compound (I): N-H…Cl and C-H…O, where the N-Cl distances are 3.333(3) and 3.459(3) Å and C-O distances are 3.253(6) and 3.690(7) Å. These interactions give rise to a bi-dimensional network parallel to (110) direction.
Pharmaceutical formulation analysis
After method optimization, it was applied to the analysis of tablets. The quantification was performed by external calibration under eight concentration levels: 0.08, 0.12, 0.16, 0.20, 0.24, 0.28, 0.32 and 0.36 mmol L-1 of ETB•2HCl in genuine triplicate. Once the analysis of regression study using least squares method for linear model presented lack of it, a polynomial model was itted:
Ŷ = 0.009 (±0.013) + 2.725 X (±0.136) – 2.298 X2 (±0.305).
The itted model was evaluated using an a priori linearity hypothesis test30 (equation 7) and the results found indicated that no evidence of lack of it was observed in the 95%
Figure 5. Crystal structure of CuETB complex. Thermal ellipsoids are
confidence interval, because Fcal = 2.66is lower than Ftab.(6;16;0.05) = 2.74.
(7)
Where: mi is the number of measurement; p is the calibration points; m is the product between p and mi.
Table 5 shows the results obtained to ETB•2HCl determination in pharmaceutical formulations by spectrophotometry in comparison with CZE.10 Statistical tests such as normality test (Shapiro-Wilk), homogeneity of variance (Levene) and independent sample t test have shown that no signiicant difference between methods was evidenced (p-value > 0.05).31
Recoveries were evaluated by standard additions method, according to equation 8. The results found are within interval of 100.9 to 104.0%, being considered satisfactory.
(8)
Where: Cx is the sample concentration; Cx+s is the sample plus standard concentration; Cs is the standard concentration.
Limit of detection (LOD) and limit of quantiication (LOQ) were calculated from UV-Vis spectra obtained for pharmaceutical analysis taking into account signal-noise ratio equal to 3 and 10 respectively.32,33 The values found were 0.8 and 2.8 mg L-1 of ETB•2HCl for LOD and LOQ, respectively.
Conclusions
An alternative method for ETB•2HCl determination by UV spectrophotometry using the ETB complexation with Cu(II) was proposed. It is important to stress that the main contributions of the spectrophotometric method here optimized are: low cost for instrumental acquisition
and by analysis, lack of necessity of analyst expertise to perform analysis and possibility to perform quality control in remote locals without sophisticated analytical conditions. On the other hand, the crystal structure revealed that the complex CuETB is cationic, similar to that observed in solution where the ETB act as a tetradentate ligand (NH and OH groups) in a cis conformation. Finally, the optimized method can be useful to quality control of the active ingredient in pharmaceutical formulations.
Supplementary Information
Supplementary data are available free of charge at http://jbcs.sbq.org.br as PDF ile.
Acknowledgements
The authors wish to acknowledge Conselho Nacional de Desenvolvimento Cientíico e Tecnológico (CNPq - 476386/2007-1 and 300593/2008-2), Fundação de Amparo à Pesquisa do Estado de Minas Gerais of Brazil (FAPEMIG – CEX-APQ 1906-502/07, CEX APQ 01837/08, CEX APQ 00617/09, CEX-PPM 00326/09) and Coordenação de Aperfeiçoamento de Pessoal de Nível Superior (CAPES) for fellowships and inancial support. Special thanks to Nurse Mércia Guadalupe Ramos from the Department of Vigilance Epidemiology and Environment from Juiz de Fora-MG for purchasing ETB•2HCl samples and LDRX (IF-UFF) for X-ray diffraction facilities.
References
1. http://www.who.int/tb/challenges/xdr/en/index.html accessed on December 14, 2009.
2. De Souza, M. V. N.; Recent Pat. Antiinfect. Drug Discov.2006,
1, 33.
3. De Souza, M. V. N.; Curr. Opin. Pulm. Med.2006, 12, 167. 4. De Souza, M. V. N.; Ferreira, M. L.; Pinheiro, A. C.; Saraiva, M.
F.; Almeida, M. V.; Valle, M. S.; TheScientiicWorldJOURNAL
2008, 8, 720.
5. Hassan, S. S. M.; Shalaby, A.; Mikrochim. Acta1992, 109, 193. 6. Chenevier, P.; Massias, L.; Gueylard, D.; Farinotti, R.;
J. Chromatogr. Sci.2002, 40, 113.
Table 5. Statistical analysis for comparison between methods
Genuine replicates 1 2 3 4 5 mean s
*Spectrophotometry (mg) 413.8 395.4 421.5 413.8 395.4 408.0 11.9
**CZE (mg) 392.8 382.7 397.6 404.9 400.1 395.6 8.4
7. Jiang, Z.; Wang, H.; Locke, D. C.; Anal. Chim. Acta2002, 456, 189. 8. Ragonese, R.; Macka, M.; Hughes, J.; Petoez, P.; J. Pharm.
Biomed. Anal.2002, 27, 995.
9. Hsieh, Y.; Whang, C.; J. Chromatogr. A2006, 1122, 279.
10. Faria, A. F.; De Souza, M. V. N.; Bruns, R. E.; De Oliveira, M. A. L.; J. Chromatogr. A2008, 1202, 224.
11. Da Silva, J. A. F.; De Castro, N. V.; De Jesus, D. P.; Faria, A. F.; De Souza, M. V. N.; De Oliveira, M. A. L.; Electrophoresis
2010, 31, 570.
12. Enraf-Nonius, COLLECT; Enraf-Nonius BV: Delft, The
Netherlands, 1997-2000.
13. Duisenberg, A. J. M.; J. Appl. Crystallogr.1992, 25, 92.
14. Duisenberg, A. J. M.; Kroon-Batenburg L. M. J.; Schreurs, A. M. M.; J. Appl. Crystallogr.2003, 36, 220.
15. Sheldrick, G.M.; SHELXL97. Program for Crystal Structure
Reinement, University of Goettingen, 1997, Germany.
16. Larson, A. C.; Crystallographic Computing, Ahmed, F. R., ed.; Munksgaard: Copenhagen, 1970, pp. 291-294.
17. Blessing, R. H.; Acta Crystallogr. A1995, 51, 33. 18. Farrugia, L. J.; J. Appl. Crystallogr.1997, 30, 565.
19. Macrae, C. F.; Edgington, P.R.; Cabe, P. McC.; Pidcock, E.; Shields, G. P.; Taylor, R.; Towler, M.; van de Streek, J.; J. Appl. Crystallogr. 2006, 39, 453.
20. Cambridge Crystallographic Data Centre, Union Road, Cambridge CB2 IEZ; available: www.ccdc.cam.ac.uk. 21. Harris, D. C., Análise Química Quantitativa, 7a. ed., LTC: Rio
de Janeiro, Brasil, 2008, pp. 447-449.
22. Annapurna, M. M. M.; Rao, M. E. B.; Kumar, B. V. V. R.; E-J.
Chem.2006, 3, 274.
23. Bai, G.-Y.; Ning, H.-S.; Zhang, Y.-C.; Zeng, T.; Li, J.-S.; Acta
Cryst.2006, E62, o3364.
24. Bai, G.-Y.; Ning, H.-S.; Simpson, J.; Qin, X.-Y.; Li, N.; Acta
Cryst.2006, E62, o4567.
25. Bai, G.-Y.; Zhang, C.-F.; Simpson, J.; Ning, H.-S.; Peng, H.-W.;
Acta Cryst.2006, E62, o5580.
26. Bai, G.-Y.; Zhang, C.-F.; Simpson, J.; Chen, Y.; Peng, H.-W.;
Acta Cryst.2007, E63, o1095.
27. Flack, H. D.; Acta Cryst.1983, A39, 876.
28. Rubin-Preminger, J. M.; Bernstein, J.; Harris, R. K.; Evans, I. R.; Ghi, P. Y.; Cryst. Grow. Des.2004, 4, 431.
29. Etter, M. C.; MacDonald, J. C.; Bernstein, J.; Acta Cryst.1990,
B46, 256.
30. Danzer, K.; Currie, L. A.; Pure Appl. Chem.1998, 70, 993.
31. Montgomery, D. C.; Design and Analysis of Experiments, 6th
ed., Wiley: England, 2005, pp. 23-48.
32. Faria, A. F.; De Souza, M. V. N.; De Oliveira, M. A. L.; J. Braz.
Chem. Soc.2008, 19, 389.
33. Faria, A. F.; De Souza, M. V. N.; Bruns, R. E.; De Oliveira, M. A. L.; Talanta2010, 82, 333.
Submitted: June 11, 2010
Supplementary Information
S
I
J. Braz. Chem. Soc., Vol. 22, No. 5, S1-S3, 2011.
Printed in Brazil - ©2011 Sociedade Brasileira de Química 0103 - 5053 $6.00+0.00
*e-mail: [email protected]
Ethambutol Analysis by Copper Complexation in Pharmaceutical Formulations:
Spectrophotometry and Crystal Structure
Adriana F. Faria,a Luiza F. Marcellos,a Juliana P. Vasconcelos,a Marcus V. N. de Souza,b Antônio L. S. Júnior,a Weberton R. do Carmo,a Renata Diniza and Marcone A. L. de Oliveira*,a
aDepartamento de Química, Instituto de Ciências Exatas, Universidade Federal de Juiz de Fora,
36036-330 Juiz de Fora-MG, Brazil
bInstituto de Tecnologia em Fármacos-Far Manguinhos, Fundação Oswaldo Cruz,
21041-250 Rio de Janeiro-RJ, Brazil
Table S1. Crystal data of CuETB
Compound CuETB
Formula C10H24ClCuN3O5
Formula weight (g mol-1) 365.31
Crystal System Orthorhombic
Space Group P212121
a / Å 6.7029(5)
b / Å 13.929(1)
c / Å 18.094(1)
V / Å3 1689.4(2)
Z 4
Crystal size (mm) 0.20 × 0.07 × 0.05
Crystal color blue
Dcalc (g cm-3) 1.436
µ(Mo-Kα) (cm
-1) 1.470
Transmission factors (min / max) 0.805 / 0.929
Relections measured / unique 9232 / 3643
Rint / Rσ 0.0522 / 0.0645
Observed relections[Fo2 > 2σ(F
o2)] 2986
No. of reined parameters 181
R [Fo > 2σ(Fo)] 0.0427
wR [Fo2 > 2σ(Fo)2] 0.0940
S 1.067
Density difference max / min 0.713 / −0.547
RMS peak (e Å-3) 0.071
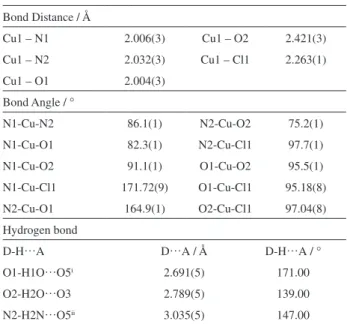
Table S2. Select bond distance and bond angles for CuETB
Bond Distance / Å
Cu1 – N1 2.006(3) Cu1 – O2 2.421(3)
Cu1 – N2 2.032(3) Cu1 – Cl1 2.263(1)
Cu1 – O1 2.004(3)
Bond Angle / °
N1-Cu-N2 86.1(1) N2-Cu-O2 75.2(1)
N1-Cu-O1 82.3(1) N2-Cu-Cl1 97.7(1)
N1-Cu-O2 91.1(1) O1-Cu-O2 95.5(1)
N1-Cu-Cl1 171.72(9) O1-Cu-Cl1 95.18(8)
N2-Cu-O1 164.9(1) O2-Cu-Cl1 97.04(8)
Hydrogen bond
D-H…A D…A / Å D-H…A / °
O1-H1O…O5i 2.691(5) 171.00
O2-H2O…O3 2.789(5) 139.00
N2-H2N…O5ii 3.035(5) 147.00