Article
J. Braz. Chem. Soc., Vol. 22, No. 5, 857-866, 2011. Printed in Brazil - ©2011 Sociedade Brasileira de Química
0103 - 5053 $6.00+0.00
A
*e-mail: [email protected]
Protolytic Properties of Dyes Embedded in Gelatin Films
Nataliya A. Nikitina,* Elena A. Reshetnyak, Nataliya V. Svetlova and Nikolay O. Mchedlov-Petrossyan
Kharkov V. N. Karazin National University, Kharkov, 61077, Ukraine
O ilme de gelatina endurecida ixo em uma base transparente de triacetilcelulose pode ser utilizado como um suporte conveniente para indicadores ácido-base. Azul de bromofenol, verde de bromocresol, eosina, etil-eosina, n-decil-eosina, n-decil-luoresceína, vermelho neutro e verde de malaquita foram incorporados nos ilmes de gelatina por extração em meio aquoso sob condições apropriadas. A absorção de luz dos ilmes dopados com corante exibe uma resposta ao pH de soluções tampão aquosas nas quais foram imersos. Valores reprodutíveis das constantes aparentes de dissociação dos indicadores, pKa
app, foram calculados pelo tratamento convencional dos valores de pH do tampão aquoso e também para a água absorvida nos ilmes de gelatina. Os experimentos com pH abaixo e acima do ponto isoelétrico da gelatina (em torno de pH 5) resultaram em valores de pKa
app semelhantes àqueles em meios micelares de tensoativos catiônicos e aniônicos, respectivamente. Os ilmes de gelatina modiicados por corantes podem ser recomendados para uso em sensores óticos e dispositivos similares.
The hardened gelatin ilm ixed on the transparent triacetylcellulose support can be utilized as a convenient carrier for acid-base indicator dyes. Bromophenol blue, bromocresol green, eosin, ethyleosin, n-decyleosin, n-decylluorescein, neutral red, and malachite green were embedded into the gelatin ilms by extracting from aqueous media under appropriate conditions. The light absorption of dye-doped ilms exhibits a response to the pH values of aqueous buffer solutions, where they were soaked in. The well-reproducible indices of the apparent ionization constants, pKa
app, of the indicators were calculated by conventional equating the pH values of the bulk aqueous buffer and those of the ‘internal’ water into the gelatin ilms. The experiments with pH below and above the isoelectric point of gelatin (around pH 5) result in pKa
app values, which resemble those in micellar media of cationic and anionic surfactants, respectively. The dye-modiied gelatin ilms can be recommended for use in optical sensors and related devices.
Keywords: dye-modiied gelatin ilm, indicators, apparent ionization constants, medium effects
Introduction
This paper is devoted to the inluence of hardened gelatin media on the spectral and acid-base properties of immobilized xanthene, sulfonephthalein, and some other dyes.
The immobilization of reagents in solid matrix (cellulose, ion-exchangers, polymers, silica, xerogels, etc.)1-7 or using organized solutions, e.g., surfactant-based ones,8-12 modiies the properties of guest molecules owing to the change of the microenvironment.
Such modiications, or medium effects, are most studied and well documented for acid-base indicators.8,9 In this case, the inluence of the microenvironment results in the shift
of the indicator equilibrium as compared to that in aqueous media. The main reasons are the local polarity and the local electrical charge. The latter often (but not always) manifests itself in the decrease or increase in the ‘apparent’ pKa value, pKa
app, in the case of positive and negative local charges,
respectively.8,9 In addition, the penetration of indicator dyes into micro-aggregates, both charged and uncharged, leads to the displacements of the absorption bands of the conjugate species of the acid-base pair.
(reactive violet 5, acid blue 74, direct red 28),6 in gelatin layer of photographic Agfa plates (Agfa Gevaert graphic gelatin ilm, 61101508; eosin, ethyleosin, methyleosin, uranin),7 protein molecules (coomassie brill blue,13 eosin Y,14 rose bengal15), methylcellulose and gelatinous ilms (acid blue 1, acid green 9, acid blue 15, acid violet 17),16 cotton iber (acid violet 17, direct red 80).17 the behavior of some indicators (p-nitrophenol, bromocresol purple, chlorophenol red, bromophenol blue, bromocresol green), solubilized in micelles of an ampholytic surfactant18 is also of interest.
The protolytic and spectral effects observed in the above systems were explained by preferable ixation of the neutral forms of indicators on the surface and in the body of the uncharged polymer,5,6,19 by electrostatic interaction of ionic indicator species with the net charge of the gel,6,7 by conformations of dye molecules,3 aggregation,16 and also in terms of hydrophobic interactions20 and hydrogen bond formation.6
Gelatin layers of photographic ilms were used as a medium for carrying out reactions of different types.16,21-26 Gelatin is actually a polydisperse mixture of low-molecular polypeptides;22 the molecules are pronouncedly anisotropic and asymmetric. In fact, the polymer contains a voluminous net of charges and some amount of free ions. Gelatin is a typical ampholyte; the averaged isoelectric point, pHip, of the so-called alkaline gelatin is within the pH range of 4.8 to 5.1.27
Owing to the long-chained molecules, cohered by a limited number of cross-linkages, the elasticity of gelatin ilms resembles that of rubber. Based on such polymeric arrays, it becomes possible to create matrix systems with rather uniform distribution of sterically available trapped molecules. This provides favorable conditions for promoting various chemical processes with participation of immobilized reactants.22
The aim of this study was to consider the behavior of dyes embedded in hardened gelatin ilms, wetted by water. For more objective examination, a set of indicator dyes with various charge types and different hydrophobicity was selected.
As probes for monitoring the local electrostatic potentials of the microenvironments, xanthenes and structurally similar compounds are often used.10,28-33 The dyes of such type are also utilized in sensor devices31,34,35 and for holographic record.32
We studied visible-spectroscopically the protolytic properties of four xanthene dyes: eosin, ethyl eosin, n-decyleosin, and n-decylluorescein, two sulfonephthaleins: bromophenol blue and bromocresol green, a triphenylmethane dye malachite green, and an azine dye neutral red in the ilms,
by measuring their transmittance after immersing them into aqueous buffer solutions of different pH.
Attempts were made to sense the alterations of the electrostatic properties of gelatin in the above ilms along with variation of bulk water acidity. Also, the possibility of utilization of such dyed ilms in creating non-expandable test-materials for pH monitoring of aquatic media was estimated.
Experimental
Chemicals
Photographic ilms for offset printing manufactured by AGFA, with thickness of gelatin layer around 20 µm, ixed on the transparent triacetylcellulose support36 were used in this work. The samples used were colorless and transparent. Previously, the silver halides have been completely removed from the ilms using the solution of the developer G 101c, containing hydroquinone CAS # 123-31-9, and rapid ixer G 333c from Agfa Graphics NV (Belgium). Also, gelatin of technical quality was used for preparation of gelatin solutions. Bromophenol blue, bromocresol green, malachite green, and neutral red were from Shostka Chemical Plant, Ukraine, eosin and ethyleosin were from the collection of the Department of Physical Chemistry of Kharkov V. N. Karazin National University, the samples of n-decylluorescein and n-decyleosin were kindly put at our disposal by Dr. V. I. Alekseeva, Research Institute of Organic Intermediates and Dyes, Moscow, Russia. Sodium n-dodecyl sulfate (SDS, 99% purity) was used as commercially obtained. Photographic gelatin was used for preparing its aqueous solutions.
Stock solutions of indicators with concentrations 10-3 to 10-2 mol L-1 (except n-decyleosin, which initial concentration was one or two orders of magnitude lower) were prepared by dissolution of exactly weighed amounts of sulfonephthaleins, malachite green, and neutral red in water; in the case of xanthene dyes, ethanol with mass fraction 95.6% was used as solvent. All working solutions were prepared by dilution of stock solutions using distilled water.
by phosphate buffers, and from 8.5 to 10.5 by (glycine + NaOH) mixtures. Alkaline media (pH > 11) was made using NaOH stock solution diluted by CO2-free water.
Apparatus
Absorption spectra of dye solutions and dye-containing gelatin films were measured using KFK-3 (Russia) apparatus against reference solutions or ilm, containing all components except the indicator. The pH values of working solutions were determined using the glass electrode ESL-63-07 (Russia) in a cell with liquid junction (aqueous saturated KCl solution) with the Ag/AgCl reference electrode EVL-1 M3 (Russia). The measurements were performed with the potentiometer P 307 (Russia) at 25.0 °C ± 0.1 according to the compensation scheme; the pH meter-millivoltmeter pH-121 was used as a nil-instrument. The repeatability did not exceed ± 0.3 mV.
Techniques
Modiication of gelatin ilms
A volume of25 mL of indicator solution placed into the Petri dish and ilms with size 2.5×3.5 cm were dipped in the solution at room temperature, without stirring; reagents concentration and pH values in solutions are shown in Table 1. The ilms were pulled out of solution with tweezers; washed with distilled water, acidiied with HCl to the necessary pH value and dried at air for 1 h. Thus prepared ilms were stored at room temperature in the dark; the dye concentrations in the ilms were 1-2 orders of magnitude higher as compared with those in the initial aquatic phases.
The determination of the apparent ionization constants in the two-phase system: water/gelatin ilm
Films with an immobilized indicator were dipped into the solution with a given pH value for 1 min and dried at air for 1 h at 18-22 oC before spectrophotometric measurements.
The acid-base equilibrium in the two-phase system can be described as follows:
—
H—B —B + H+, K a
app (1)
Here the —H—B and —B denote the species located in the gelatin ilm (the charges are omitted for simplicity). The indices of the apparent constants were determined by the below formula:9-12
(2)
The pH value refers to the bulk (aqueous) phase, AB and AHB are absorbances of the ilm at the given wavelength after complete conversion into the corresponding form, and A is absorbance at the current pH. The ionic strength of the bulk phase (Ι) was as a rule 0.01 to 0.05 mol L-1.
For calculation of the pKa
app values, the results of
3-5 independent series were used; the experiments were repeated beginning from the preparation of the ilms and immobilization of the dyes. Finally, 20-30 pKaapp values were utilized to obtain the averaged constant. The results obtained using different wavelengths (λmax ± 10 nm) coincide. The changes of the pH values of the bulk solutions, resulting from the dipping procedure, are negligible.
During the dipping process, the aqueous phase stayed colorless within the working range of pH. The latter is limited by the conditions of dye extraction (Table 1). The color changes were reversible; for instance, the properties of bromophenol blue-containing ilms did not change after 30 to 50 soakings with solutions with different pH within the working acidity range. The air-dried ilms maintain their color during 1 year.
Results and Discussion
The binding of dyes by the gelatin ilms
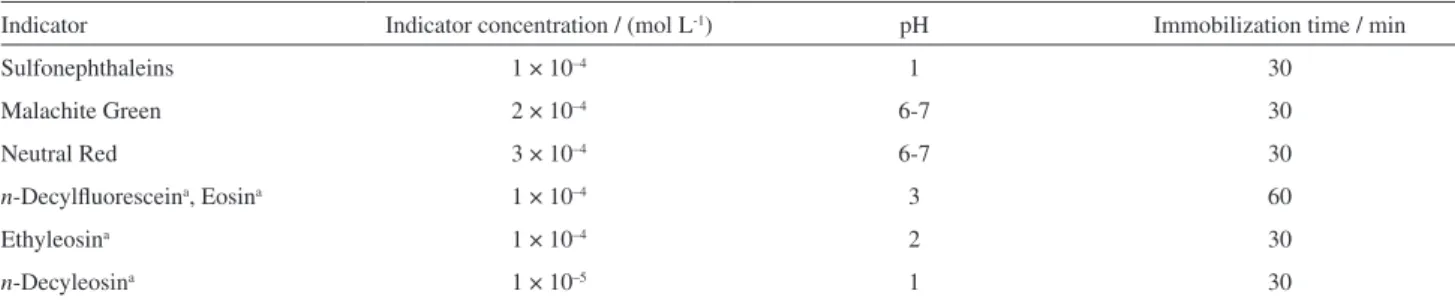
The contact time of colorless films with indicator solutions, necessary for dye immobilization (Table 1),
Table 1. Conditions of dye immobilization into the gelatin ilms
Indicator Indicator concentration / (mol L-1) pH Immobilization time / min
Sulfonephthaleins 1 × 10⁻⁴ 1 30
Malachite Green 2 × 10⁻⁴ 6-7 30
Neutral Red 3 × 10⁻⁴ 6-7 30
n-Decylluoresceina, Eosina 1 × 10⁻⁴ 3 60
Ethyleosina 1 × 10⁻⁴ 2 30
n-Decyleosina 1 × 10⁻⁵ 1 30
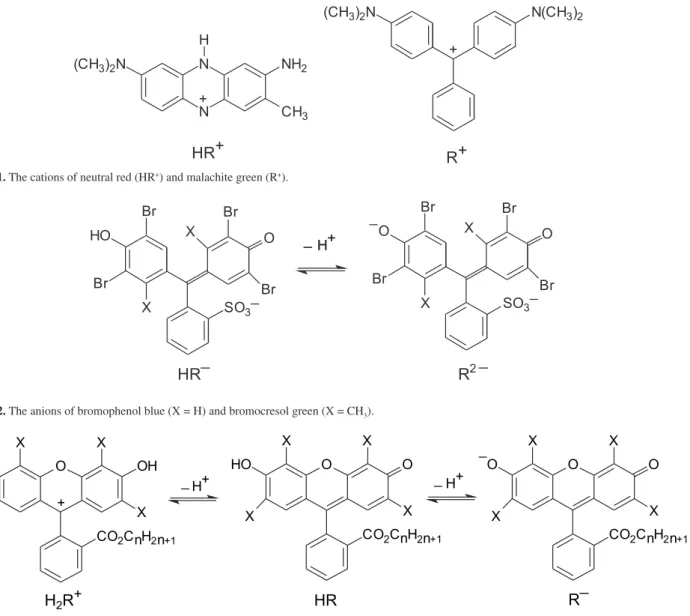
Figure 1. The cations of neutral red (HR+) and malachite green (R+).
Figure 2. The anions of bromophenol blue (X = H) and bromocresol green (X = CH3).
Figure 3. Ethyleosin (X = Br, n = 2), n-decyleosin (X = Br, n = 10), and n-decylluorescein (X = H, n = 10). For ethyleosin and n-decyleosin, the cationic species H2R+ appear only in strongly acidic media,11 not studied here.
was determined using the saturation curves. The latter were obtained by plotting the absorbance vs. dipping time. Under proper conditions, both acid and basic forms of indicator dyes studied can be extracted into the ilms. Owing to their hydrophobicity, the long-chained lipophilic dyes n-decylluorescein and n-decyleosin always tend to be embedded into the ilms. The indicators neutral red and malachite green are preferably extracted within the pH range above the isoelectric point of gelatin (pH > 5) in the form of cations HR+ and R+, respectively (Figure 1), while anionic species HR– and R2– of bromophenol blue, bromophenol green (Figure 2), and eosin as well as R– ions of ethyleosin (Figure 3) are readily bound at pH < 5.
Similar regularities were observed by binding of eosin Y with bovine serum albumin.14 The dye does not bind with protein in alkaline medium (pH 9), because the macromolecule has mainly negative charge due to ionization
of amino acid residues, while the dye is in the form of dianion R2–. On the contrary, the positively charged surface of protein is able to bind the anionic form of the indicator rose bengal.15 Anions of p-nitrophenol, bromocresol purple, chlorophenol red, bromophenol blue, and bromocresol green can be bound both by neutral or positively charged surface of n-dodecyldimethylamineoxide micelles.18
Interestingly, analogous effect was observed by studying the sorption and desorption of anionic dyes reactive purple 5, acid blue 74 and direct red 28 on the chitin gel.38 Under the conditions favorable for sorption (pH 5.8) strong retention of indicators was provided by electrostatic interaction of sulfonate groups of the dyes with protonated amides of the gel (pKa,monomer = 7.6). However, no desorption of indicator direct red was observed in alkaline medium at pH 10, where the grid charge of the gel is negative.38
The positions of the absorption maxima of the air-dried ilms in the visible region prove the non-aqueous microenvironment of the dye species, bound by the gelatin macromolecules.
Spectral characteristics of indicators immobilized in the gelatin gel
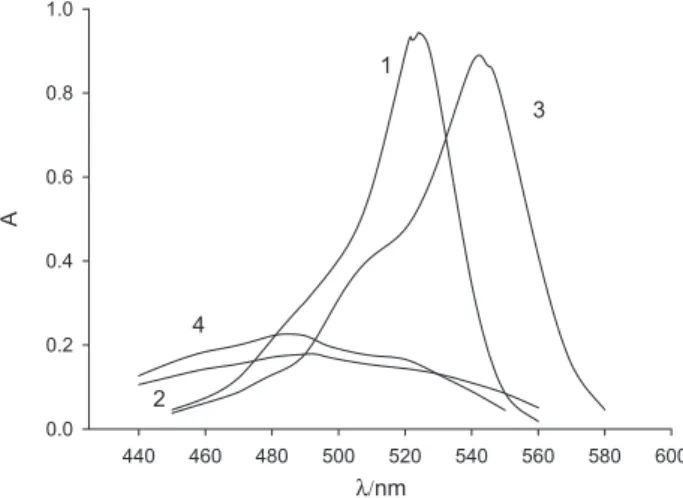
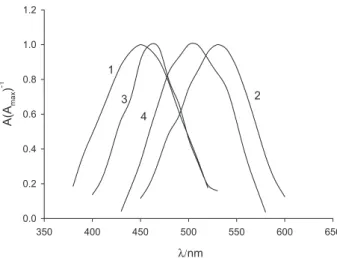
The absorption bands of acid and basic forms of all the indicators under study, immobilized in gelatin ilm, are shifted as compared with those in aqueous solutions. The electronic absorption spectra of the conjugated forms of indicators in ilms and in solutions are exempliied in Figures 4 and 5.
Hypsochromic shifts of absorption maxima were observed for HR– species of bromophenol blue and bromocresol green, HR form of ethyleosin and HR+ ion of neutral red, while the batochromic shifts were registered for basic forms of all indicators and acid form of malachite green (R+) and molecular species of n-decylluorescein (HR) (Table 2).
For the above anionic dyes analogous effects were observed in micellar solutions of cationic surfactants, e.g., N-cetylpyridinium chloride and in microemulsions
based on these surfactants.9,11,39,40 In turn, for neutral red and malachite green similar spectral shifts were registered in micellar solutions and microemulsions of an anionic surfactant SDS, in aqueous solutions of anionic calixarens, in suspensions of liposomes.9-12 Batochromic shift of 10 nm was observed for basic forms of eosin, ethyleosin, methyleosin, and uranin (disodium salt of luorescein), captured in gelatin layer of photographic plates manufactured by Agfa (Agfa Gevaert graphic gelatin ilm, 61101508).7 The alterations of λ
max give evidence for interaction of dyes with the gelatin gel.14,15 The closeness of the λmax values in gelatin ilms and in micellar solutions of ionic surfactants allows to expect that the microenvironment of dyes in two media is similar.33,35 The maxima of the spectra of neutral molecular forms of ethyleosin and n-decyleosin are expressed less distinctly (Figure 4). The neutral form of eosin (H2R), captured in the ilms, is not colored. This indicates the shift of tautomeric equilibrium of this neutral form from the quinonoid, which is colored like that of ethyleosin (Figure 4, curves 2, 4) toward the colorless lactone (Figure 6).39,40
It is worth to point out that disappearance of luorescence was observed for xanthenes during injection of it in gelatin ilm. It can be caused both by concentration quenching and dimerization of the dyes in the gelatin matrix.33 However, we have not registered alterations of the absorption spectra typical for dimer formation.
Apparent ionization constants of indicators in two-phase system: water /gelatin ilm
In order to determine the pKa
app values, the absorbance
of the dye-doped ilms was plotted against the pH values of aqueous solutions, where ilms were dipped into. The
Figure 4. Absorption spectra of the form R–, pH = 3.0-5.0 (1, 3), and
HR, pH = 0.50-0.55 (2, 4) of ethyleosin in aqueous solution with ethanol mass fraction 8%, dye concentration 1.00 × 10⁻⁵ mol L-1 (1, 2) and in the
gelatin ilm (3, 4).
Figure 5. Normalized absorption spectra of n-decyfluorescein in aqueous solution with ethanol mass fraction 8%, dye concentration 1.00 × 10⁻⁵ mol L-1 (1,2) and in the gelatin ilm (3,4); pH = 12.0 (1),
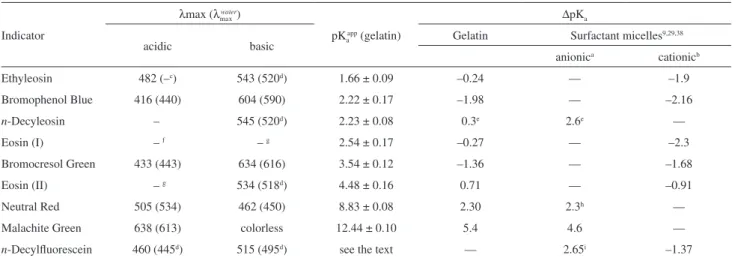
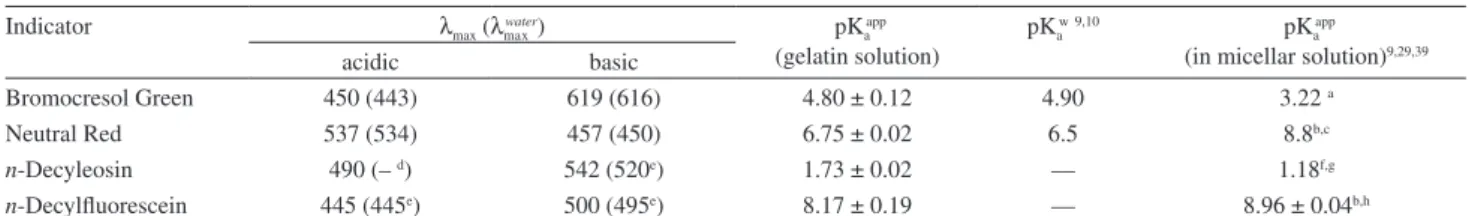
Table 2. The λmax/nm and pKaapp values of indicators and medium effects (∆pKa = pKaapp – pKaw).
Indicator
λmax (λmw
a
a
x
ter)
pKaapp (gelatin)
∆pKa
acidic basic Gelatin Surfactant micelles
9,29,38
anionica cationicb
Ethyleosin 482 (–c) 543 (520d) 1.66 ± 0.09 –0.24 — –1.9
Bromophenol Blue 416 (440) 604 (590) 2.22 ± 0.17 –1.98 — –2.16
n-Decyleosin – 545 (520d) 2.23 ± 0.08 0.3e 2.6e —
Eosin (I) – f – g 2.54 ± 0.17 –0.27 — –2.3
Bromocresol Green 433 (443) 634 (616) 3.54 ± 0.12 –1.36 — –1.68
Eosin (II) – g 534 (518d) 4.48 ± 0.16 0.71 — –0.91
Neutral Red 505 (534) 462 (450) 8.83 ± 0.08 2.30 2.3h —
Malachite Green 638 (613) colorless 12.44 ± 0.10 5.4 4.6 —
n-Decylluorescein 460 (445d) 515 (495d) see the text — 2.65i –1.37
aIn SDS micellar solutions, I= 0.05 mol L-1 (NaCl). bIn N-cetylpyridinium chloride micellar solutions, I = 0.05 mol L-1 (KCl).39cThe neutral species HR
of ethyleosin is poorly soluble in water; at 8% mass ethanol, at pH around 0.5, the spectrum with λmax = 492 nm may relect the appearance of the traces
of R– anions. d 8% mass ethanol. eThe pK
aw is equated to that of ethyleosin, pKaw = 1.9. f In gelatin ilms the H2R species is practically colorless, in aquatic
media λmax = 480-485 nm.38 gThe complete HR– spectrum was not singled out. h In the literature10 the ∆pKa varies from 2.7 to 2.4 in 2 to 10 mass fraction %
of SDS solutions, without supporting electrolyte. iThe pK
aw is equated to that of ethylluorescein, pKaw = 6.31.9
Figure 6. Protolytic equilibrium of eosin.
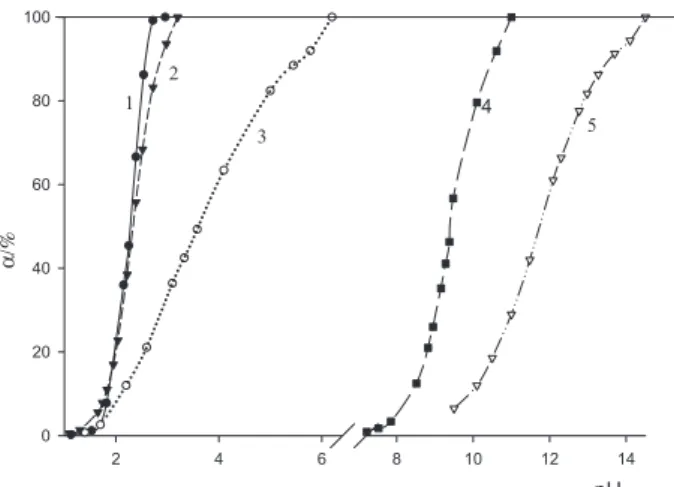
dependences of the fraction of deprotonated form vs. pH are represented in Figure 7.
According to recent data, the content of water in hardened gelatin, also manufactured using the photographic ilms, is around 40 moles per kg; after heating up to 90 oC for 1 h near 80% H
2O was removed.41 It is reasonable to consider this fraction of water as forming an internal aqueous medium within the gelatin ilm, while the rest H2O molecules are strongly bound by the macromolecules. Our experimental data, given below, are
gird charge of the macromolecules owing to acid-base interactions of amino acid residues; the counterions are located in the internal water.
The numerical data are compiled in Table 2. In such systems (see Introduction), the following expression should be used for the pKaapp value:9
(3)
Here pKa
w is the thermodynamic pK
a in water, Ψ is the local electrostatic potential, γB and γHB are activity coeficients of transfer of corresponding species from water to the gelatin phase, R is the gas constant and T is absolute temperature. The index of the so-called intrinsic constant, pKai, equals to the sum pKaw + log(γB/γHB). Equation 3 allows to explain the medium effects, ∆pKa, i.e., the deviations of pKaapp from pKaw. Indeed, if the γB/γHB quantity is close to unity and, hence, pKa
i→ pK a
w, then the Ψ value
governs the medium effect. However, in the interfacial layers of surfactant micelles, phospholipid liposomes, microemulsion, etc., the pKai value as a rule differs from pKa
w, thus indicating the ‘non-aqueous’ character of the
microenvironments.9
The net charge of gelatin films, and hence, the electrostatic potential value, is changing along with variation of pH due to the ampholytic nature of gelatin. Therefore, according to equation 3, the pKaapp should vary depending on the working pH region.
The pKaapp and ∆pKa of the dyes determined at pH values below the isoelectric point (pHipca. 5) resemble to more or less extent those determined in micellar solutions of cationic surfactants,9,40 cationic surfactant-based microemulsions,11 and cationic calixarenes.43
For the dye neutral red, the color transition occurs at pH values well above the pHip. Hence, the pKa
app value
(Table 2) is close to that determined in aqueous SDS micellar solutions.10 The binding of this indicator to an anionic polyelectrolyte also results in a substantial increase in pKa
app: in poly(sodium styrene sulphonate) aqueous
solutions, the ∆pKa = 1.7 value was registered.43
The results obtained with malachite green are of especial interest. At high and medium pH in aqueous media, this cationic indicator slowly converts into the colorless carbinol (R+ ROH + H+).43,44 The equilibrium pK
aw value equals to 6.92-7.10,44-48 while the non-equilibrium color transition corresponds to pH 11.5-14.0.49 Indeed, we determined the ‘observed’ value pKa
w = 11.94 ± 0.11
in aqueous diluted NaOH solutions by registering the absorbance within 1 min after mixing.50 Contrary to aqueous systems, in the gelatin ilms no color change in time was observed. The pKa
app = 12.44 should be considered as a true
value, and the ∆pKa = 5.4 value for malachite green, together with the ∆pKa = 2.3 value for neutral red, proves the negative net charge of the gelatin structures bearing the indicator dyes. In aqueous SDS micellar solutions, in accordance with the report of Dutta and associates,51 practically no changes in malachite green absorbance in time were registered. The pKaapp value 11.62 ± 0.09 was determined at dye concentration 1.00 × 10⁻⁵ mol L-1 in 0.01 mol L-1 SDS solutions; I = 0.05 mol L-1 (phosphate buffer solution + NaCl), 2 h after preparation of working solutions. In (0.75-6) × 10–5 mol L-1 aqueous solutions of poly(sodium styrene sulphonate), Basahl et al.52 reported somewhat lower pKa values, 10.40-11.15, as determined at dye concentration 1.5 × 10⁻⁵ mol L-1.
The case of eosin is more complicated due to dibasic character of this acid, with two overlapping ionization steps. Indeed, in the pH-dependences of absorbance at proper wavelengths, this is clearly seen due to existence of two inlection points (see Supplementary Information). For calculation of the pKa1 and pKa2 values, the program CLINP53 was used. The data of three separate experimental series were processed, using independently prepared gelatin ilms with the immobilized dye.
The increase in the pKa2 value of eosin, as compared with the value in aqueous solutions, gives evidence for the decrease in the positive net charge of gelatin along with approaching to the pHip value. Here, the contribution of the last item in equation 3 is small, and pKa
app→ pK a
i. In turn,
the latter is always higher than pKaw for the second ionization step of eosin on going from water to micelles of non-ionic surfactants54 and solutions of non-ionic polymers.55
In another paper,56 the character of the dependence of absorbance at 552 nm (eosin concentration of
Figure 7. Dependence of deprotonation degree of dyes, immobilized in the gelatin ilm, on pH of external buffer solutions; 1 - bromophenol blue, 2 - ethyleosin (I = 0.05 mol L-1 at pH ≥ 1.3), 3 - bromocresol green,
1.5 × 10⁻⁴ mol L-1) on pH in water with gelatine mass fraction 0.05% addition indicates that pKa2 > 4.
The pH-induced color changes of the ilms can be easily observed by the naked eye (Table 3).
Note, that these dyes, except the most hydrophobic ones (neutral red, n-decyleosin, and n-decylluorescein), release from the ilms dipped into aquatic systems with “unfavorable” pH (see above). Hence, their species are unable to hold in the internal water if not ixed at the gelatin macromolecules.
For more precise monitoring of the acidity of solutions, for example, in sensor devices, the spectroscopic measurements can be used. The change of the gird charge of gelatin along with pH variation manifests itself most distinctly in the case of n-decylluorescein (Figure 8).
The corresponding color transition varies from pH 2 to 10. Actually, this is in accordance with the pKa
app values
(4.9-5.5) and (7.9-9.0) in cationic and anionic surfactant micelles respectively, depending on the bulk ionic strength.9 Also, the interfering of the irst step, i.e., the dissociation of the cation H2R
+, cannot be excluded; the corresponding
pKaapp values in two types of ionic micelles are (0.8-1.3) and (4.0-5.2) respectively.9 Interestingly, such behavior of n-decylluorescein was also observed in the Langmuir-Blodgett carboxylic acid-based ilms.33,35 In contrast, for a similar dye, 2,7-n-dihexyl-n-octadecylluorescein embedded
into a polyurethane-based ilm, the transition from HR to R– occurs within a normal pH range; pK
aapp = 8.5.57 These results are in agreement with some other works, where the change of the interfacial charge and Ψ values, caused by acid-base interactions of interfacial functional groups, manifests itself in the alteration of the pKaapp values of the bound indicator dyes.12,18,28
With some other indicators, the pKaapp drift was also registered, however, within a narrow pH region and not so distinct. Probably, the long hydrophobic hydrocarbon chain, ixing the dye in a deinite constant position in the gelatin microenvironment, causes the peculiar behavior of n-decylluorescein (in the case of n-decyleosin, such expressed pKaapp alteration was not observed, because the complete ionization of this indicator occurs already in the acidic pH region, much lower than pHip).
The increase in the ionic strength of the aqueous buffer solutions, where the ilms were dipped in, from 0.05 to 0.50 mol L-1 (NaCl) displayed no distinct inluence on the pKaapp values of n-decylluorescein.
The pKaapp values of indicators in aqueous solutions of gelatin
Unusual behavior of n-decylluorescein in the gelatin ilm impelled us to examine the acid-base equilibrium of the dye in gelatin solutions. Solutions with gelatin mass fraction 1% were used; further increase in the concentration resulted in high turbidity, which hinders the spectrophotometric measurements. The “titration curve” of n-decylluorescein in gelatin solutions is of common type and thus differs essentially from that in gelatin ilms (Figure 8). The pKa
app = 8.17 value (Table 4) is close to that
in micelles of anionic surfactants. This value is markedly
Table 3. The color transitions of gelatin ilms with various embedded dyes Immobilized
indicator
The pH values of the bulk aqueous phase
The color of the gelatin ilm Bromophenol Blue < 1.5
2.5 3.0-5.0
yellow green blue Bromocresol Green < 2.5
3.5 4.5-5.0
yellow green blue Neutral Red < 8.0
9.0 >10
red orange yellow Malachite Green 5.0-11.0
12.0 >13
bluish-green light-blue
colorless
Eosin < 1.5
2.0 3.0-5.0
colorless light-pink rose Ethyleosin < 0.5
1.0 2.0-5.0
yellow–orange orange
rose
n-Decyleosin < 0.5 1.0 2.0-5.0
yellow–orange orange
rose
n-Decylluorescein < 2.0 2.0-10.0
> 10.0
yellow from yellow to crimson
light-rose
higher than that in water (pKa
w = 6.3), as equated to the
pKaw value of the water-soluble analogue, ethylluorescein.9 The binding of the species of n-decylluorescein, as well as of n-decyleosin, by the gelatin macromolecules is ensured by their insolubility in pure water. However, contrary to the spectra in gelatin ilms, the absorption band positions in gelatin solutions are closer to those of their analogues (ethylluorescein and ethyleosin) in water. Hence, the microenvironments in gelatin solutions are probably more hydrated than in the gelatin ilms. The
λmax = 500 nm value of n-decylfluorescein anion, R –,
coincides with that in SDS micelles, while in the case of n-decyleosin the band position (542 nm) is closer to those in nonionic and cationic micelles (540-544 nm), than in anionic ones (535 nm).29 The pK
a
app value of n-decyleosin,
determined within the pH 0.5-3.0 (Table 3), is with 1.73 lower than the value 2.61 in micellar solutions of nonionic Tween-80, and even more so than pKaapp = 4.53 in SDS micellar media at an ionic strength of 0.05 mol L-1 (NaCl).29
In fact, the behavior of the lipophilic dyes in gelatin solutions is in agreement with the re-charging of the gelatin macromolecule on going from pH < 5 to pH > 5 in the aquatic medium.
We also determined the pKaapp values of bromocresol green and neutral red in gelatin solution (Table 4). Contrary to the lipophilic xanthenes, the binding of the dyes species seems to be not complete, judging from the positions of their absorption maxima, and hence the discussion of the pKa
app values is not appropriate here.
Conclusions
Cationic indicators neutral red and malachite green are readily extracted into the gelatin ilms at pH over the pHip value of gelatin, while anionic ones, bromophenol blue, bromophenol green, eosin, and ethyleosin correspondingly at pH < 5. This is in agreement with the net charge of the macromolecules. The long-chained lipophilic dyes n-decylluorescein and n-decyleosin always tend to be embedded into the ilms.
The shifts of the absorption bands of the indicators and the change of their pKaapp values as compared with the corresponding data in aqueous media prove the ixation of the dye species by the macromolecules. The apparent pKa
app values can be obtained by conventional equating of
the internal pH of the water within the ilms to those in the bulk buffer solutions where the ilms were dipped in.
Contrary to the aqueous solutions at high pH values, and in agreement with the micellar solutions of SDS, no changes in malachite green spectra along time were registered with the dye-doped ilms.
Somewhat unusual behavior exhibits the lipophilic indicator dye n-decylluorescein. Its color transition varies from pH 3 to 10, which relects the re-charging of the gelatin matrix. The increase in the ionic strength of the bulk aqueous phase from 0.05 to 0.50 mol L-1 did not seriously change the pKa
app value at the given pH.
The pH-induced color changes of the ilms can be easily observed by the naked eye. For more precise monitoring of the acidity of solutions, for example, in sensor devices, spectrophotometric measurements can be used.
Supplementary Information
Supplementary data are available free of charge at http://jbcs.sbq.org.br as PDF ile.
Acknowledgments
The authors are grateful to Dr. Vera I. Alekseeva (Research Institute of Organic Intermediates and Dyes, Moscow, Russia.) for her gift of the samples of n-decylluorescein and n-decyleosin.
References
1. Munkholm, Ch.; Walt, D. R.; Milanovich, F. P.; Klainer, S. M.;
Anal. Chem. 1986,58, 1427.
2. Peterson, J. I.; Goldestein, S. R.; Fitzerald, R. V.; Buckhold, D. K.;
Anal. Chem. 1980,52, 864.
Table 4. The λmax/nm and pKaapp values of indicators in water and in gelatin solution (ω = 1%), I = 0.05 mol L-1 (NaCl + buffer components)
Indicator λmax (λm
w
a
a
x
ter) pK
aapp
(gelatin solution)
pKaw9,10 pK aapp
(in micellar solution)9,29,39
acidic basic
Bromocresol Green 450 (443) 619 (616) 4.80 ± 0.12 4.90 3.22 a
Neutral Red 537 (534) 457 (450) 6.75 ± 0.02 6.5 8.8b,c
n-Decyleosin 490 (– d) 542 (520e) 1.73 ± 0.02 –– 1.18f,g
n-Decylluorescein 445 (445e) 500 (495e) 8.17 ± 0.19 –– 8.96 ± 0.04b,h
a In micellar solutions of N-cetylpyridinium chloride, I = 0.05 mol L-1 (KCl). bin SDS micellar solutions, I = 0.05 mol L-1 (NaCl). cIn the literature10 the ∆pKa varies from 2.7 to 2.4 in 2 to 10 mass % SDS solutions, without supporting electrolyte. dSee Table 2. e8 mass % ethanol. fIn micellar solutions
of cetyltrimethylammonium chloride, I = 4.0 mol L-1 (KCl). gFor ethyleosin in N-cetylpyridinium chloride micellar solutions, I = 0.05 mol L-1 (KCl),
3. Nakashima, K.; Duhamel, J.; Winnik, M. A.; J. Phys. Chem.
1993, 97, 10702.
4. Bacci, M.; Baldini, F.; Scheggi, A. M.; Anal. Chim. Acta1988,
207, 343.
5. Narayanaswamy, R.; Sevilla, F.; Anal. Chim. Acta1986,189, 365.
6. Vachoud, L.; Zidowicz, N.; Domard, A.; Int. J. Biol. Macromol.
2001, 28, 93.
7. Birkedal-Hansen, H.; Histochemie1973,36, 73.
8. Savvin, S. B.; Shtykov, S. N.; Mikhailova, A. V.; Russ. Chem. Rev.2006,75, 341.
9. Mchedlov-Petrossyan, N. O.; Pure Appl. Chem.2008,80, 1459. 10. Drummond,C. J.; Grieser, F.; Healy, T. W.; J. Chem. Soc.,
Faraday Trans.1989,85, 551.
11. Mchedlov-Petrossyan, N. O; Isaenko, Yu. V.; Salamanova, N. V.; Alekseeva, V. I.; Savvina, L. P.; J. Anal. Chem.2003,58, 1018. 12. Gorbenko, G. P.; Mchedlov-Petrosyan, N. O.; Chernaya, T. A.;
J. Chem. Soc., Faraday Trans.1998,94, 2117.
13. Hong-Wen, Gao; Jun Jiang; Lin-Qian, Yu; J. Anal. Chem.2002,
57, 694.
14. Gao, D.; Tian, Y.; Liang, F.; Jin, D.; Chen, Y.; Zhang, H.; Ya, A.; J. Lumin.2007, 127, 515.
15. Galat, A.; Spectrochim. Acta1986, 42A, 199. 16. Duxbury, D. F.; Dyes Pigm. 1994, 25, 131.
17. Saleem, M.; Tahira, P.; Qadeer, R.; Colloids Surf., A 2007,292, 246.
18. Funasaki, N.; J. Colloid Interface Sci. 1977,60, 54. 19. Choi, M. M. F.; J. Photochem. Photobiol., A1998, 114, 235. 20. Nakamaru, Y.; Sugii, Y.; J. Biochem.1974, 75 , 1331. 21. Mikhailov, O. V.; Polovnyak, V. K.; Zavodsk. Laboratoriya
1989, 55, 34.
22. Mikhailov, O. V.; Rossiiskiy Khim. Zhurn.2000, 3, 70. 23. Mikhailov, O. V.; Russ. J. Coord. Chem.2000, 26, 750. 24. Sheremet’ev, S. V.; Kuznetsov, V. V.; J. Anal. Chem.2007, 62,
319.
25. Loginova, L. P.; Konovalova, O. Yu.; Talanta2008,77, 915. 26. Loginova, L. P.; Nesterenko, O. Yu.; Kharkov University Bulletin
2006, 14, 112.
27. Ward, A. G.; Inst, P.; Br. J. Appl. Phys.1954, 5, 85.
28. Moller, J. V.; Kragh-Hansen, U.; Biochemistry 1975, 11, 2317. 29. Loginova, L. P.; Samokhina, L. V.; Mchedlov-Petrossyan, N. O.; Alekseeva, V. I.; Savvina, L. P.; Colloids Surf., A 2001, 193, 207. 30. Hartland, G. V.; Grieser, F.; White, L. R.; J. Chem. Soc. Faraday
Trans.11987, 83, 591.
31. Drummond, C. J.; Grieser, F.; J. Photochem. Photobiol.1987,
45, 19.
32. Mangaiyarkarasi, D.; Palanisamy, P. K.; Sirohi, R. S.; Optical Engineering2000, 39, 2138.
33. Bezkrovnaya, O. N.; Mchedlov-Petrossyan, N. O.; Vodolazkaya, N. A.; Alekseeva, V. I.; Savvina, L. P.; Yakyubovskaya, A. G.;
Russ. J. Appl. Chem. 2008, 81, 659.
34. Choi, M. F.; Shaomin Shuang; Analyst2000, 125, 301. 35. Bezkrovnaya, O. N.; Mchedlov-Petrossyan, N. O.; Vodolazkaya,
N. A.; Litvin, P. M.; Reports of the National Academy of Science of Ukraine2008, 7, 130.
36. Mees, C. E.; James ,T. H.; Theory of the Photographic Process, 4th ed, Macmillan: New York, 1977.
37. Kolthoff, I.; Die Massanalyse, 2nd ed.; Springer: Berlin, 1931. 38. Vachoud, L.; Zidowicz, N.; Domard, A.; Int. J. Biol. Macromol.
2001, 28, 93.
39. Mchedlov-Petrossyan, N. O.; Kleschevnikova, V. N.; Zhurn. Obshch. Khim.1990, 60, 900.
40. Mchedlov-Petrossyan, N. O.; Kleshchevnikova, V. N.; J. Chem. Soc., Faraday Trans.1994, 90, 629.
41. Kuznetsov, V. V.; Sheremet’ev, S. V.; J. Anal. Chem.2009, 64,
886.
42. Mchedlov-Petrossyan, N. O.; Vodolazkaya, N. A.; Vilkova, L. N.; Soboleva, O. Yu.; Kutuzova, L. V.;Rodik, R. V.; Miroshnichenko, S. I.; Drapaylo, A. B.; J. Mol. Liq. 2009, 145, 197.
43. Baumgartner, E.; Fernandez-Prini, R.; Turyn, D.; J. Chem. Soc., Faraday Trans.1974, 70, 1518.
44. Goldacre, R. J.; Phillips, J. N.; J. Chem. Soc.1949, 1724. 45. Ginzburg, O. F.; Zavlin, P. M.; Zh. Obshch. Khim.1960, 30,
1479.
46. Ginzburg, O. F.; Zavlin, P. M.; Zh. Obshch. Khim.1961, 31, 75. 47. Ginzburg, O. F.; Zavlin, P. M.; Zh. Obshch. Khim.1962, 32,
3359.
48. Frolova, A. M.; Boichenko, A. P.; Konovalova, O. Yu.; Loginova, L. P.; Kharkov University Bulletin 2009, 17, 157.
49. Bishop, E.; Indicators, Pergamon Press: Oxford, 1972. 50. Reshetnyak, E. A.; Nikitina, N. A.; Loginova, L. P.;
Mchedlov-Petrossyan, N. O.; Svetlova, N. V.; Kharkov University Bulletin
2005, 13, 67.
51. Gohain, B.; Boruah, B.; Saikia, P. M.; Dutta, R.; J. Phys. Org. Chem2010, 23, 211.
52. Basahl, S. N.; El-Arab, M. A. F. E.; Gasem, A. A.; Emara, M. M.;
Indian J. Chem.1986, 25A, 544.
53. Kholin, Yu. V.; http://www-chemo.univer.kharkov.ua/kholin/ clinp.html accessed in January 2011.
54. Mchedlov-Petrossyan, N. O.; Rubtsov, M. I.; Lukatskaya, L. L.;
Ukr. Khim. Zh.1990, 56, 69.
55. Zaslavsky, B. Yu.; Miheeva, L. M.; Gulaeva, N. D.; Borovskaya, A. A.; Rubtsov, M. I.; Lukatskaya, L. L.; Mchedlov-Petrossyan, N. O.; J. Chem. Soc., Faraday Trans.1991, 87, 931.
56. Mudakavi, J. R.; Analyst1984, 109, 1577.
57. Weidgans, B. M.; Krause, C.; Klimant, I.; Wolfbeis, O. S.;
Analyst2004, 129, 645.
Supplementary Information
S
I
J. Braz. Chem. Soc., Vol. 22, No. 5, S1, 2011. Printed in Brazil - ©2011 Sociedade Brasileira de Química 0103 - 5053 $6.00+0.00
*e-mail: [email protected]
Protolytic Properties of Dyes Embedded in Gelatin Films
Nataliya A. Nikitina,* Elena A. Reshetnyak, Nataliya V. Svetlova and Nikolay O. Mchedlov-Petrossyan
Kharkov V. N. Karazin National University, Kharkov, 61077, Ukraine
Figure S1. Normalized absorption spectra of the R form (1,3) and HR+ form (2,4) of neutral red in aqueous solutions at pH 10.0 and 4.0,
respectively (1,2) and in the gelatin ilm at pH 10.5 and 6.0, respectively (3,4).