Article
J. Braz. Chem. Soc., Vol. 22, No. 8, 1478-1483, 2011. Printed in Brazil - ©2011 Sociedade Brasileira de Química 0103 - 5053 $6.00+0.00
A
*e-mail: [email protected]
Aspects of Protonation and Deprotonation of Humic Acid Surface
on Molecular Conformation
Alexandre G. S. Prado,* Jonas Pertusatti and Alécio R. Nunes
Instituto de Química, Universidade de Brasília, CP 4478, 70904-970 Brasília-DF, Brazil
As densidades supericiais de carga de ácidos húmicos foram determinadas por titulação potenciométrica e condutimétrica simultâneas. Também foi observada a inluência do pH na conformação molecular através de espectroscopia de UV-Vis e microscopia eletrônica de varredura (MEV). A densidade de carga supericial para todas as amostras de ácido húmico é aproximadamente zero na faixa de pH 3,5-6,0. A inluência do pH na condensação molecular foi observada pela determinação do índice β na equação de Doty e Steiner. Os altos valores de β foram obtidos na região ácida, indicando uma conformação condensada, devido à fraca interação atrativa. Além disso, na região alcalina, a densidade de carga na superfície da molécula é mais negativa, o que favorece o aumento da repulsão e dispersão das partículas, levando à formação de estruturas micelares como consequência da característica anifílica dos ácidos húmicos.
The surface charge densities for humic acids (HAs) were determined by simultaneous potentiometric and conductimetric titrations. It was also observed the pH inluence on molecular conformation by UV-Vis spectroscopy measurements and scanning electron microscopy (SEM) images. The surface charge densities are approximately zero at the pH range 3.5 to 6.0 for all samples. The pH inluence on molecular condensation level was observed by the determination of the β index from Doty and Steiner equation. High values of β were obtained at acid region indicating a condensed conformation due to weak attractive interactions whereas around the neutral region the repulsive intramolecular forces take place leading to an extended conformation of humic molecules. Moreover, at very alkaline region, the charge density on molecule surface is more negative, increasing repulsion and dispersion of the particles and also takes place formation of micelle-like structure because of the amphyphylic feature of HA samples.
Keywords:humic acid, pH, surface charge density, conformation
Introduction
Humic acids (HA) are a part of chemically undeined and dark matter present in soil, surface waters, peats and sediments. They correspond to the great amount of organic matter in environment and are generated from natural degradation of biomatter through uncertain routes.1-6 This fact creates chemically heterogeneous compounds, but with some common features as the huge concentration of carboxyl and phenolic groups, which give them the weak acid behavior. HA perform a very important role on environment such as on germination of seeds and plants growth, transport and sorption of hydrophobic compounds, structural aggregation of soil, bioavailability and complexation of metal ions and present buffering capacity on natural environments.1-3,7
The reactivity of HA on buffering capacity of soils, bioavailability, motion and transport of micro and macronutrients, toxic metal, xenobiotic organic cations in soils and surface waters is strongly influenced by acid-base properties of humic acids.7,8 These interactions concern to protonation and deprotonation of HA surface acid groups and they are directly related to the structural conformation of HA. There are two points of view on the HA macrostructure in the literature. The irst one says that HA present a polymer-like macrostructure and the second believes that HA are formed by a supramolecular aggregation of relatively small humic molecules held together by weak dispersive forces, such as hydrogen bonds and van der Waals interactions.2,9
ones. Molecules with simultaneous polar and apolar moieties, amphiphilics, tend to aggregate in supramolecular structures above a critical concentration. The aggregation happens to reduce unfavorable interaction between apolar parts with the solvent, in this case, water a polar molecule. These amphiphilic molecules can form micelles, double layers or micelle-like structures.10-12
In this present work, HA were studied by potentiometric and conductimetric titration in order to determine the charge tendencies on the surface of the material. Besides, UV-Vis molecular absorption and scanning electron microscopy (SEM) were performed in order to understand the relationship between the pH system and molecular aggregation of the HA macromolecule.
Experimental
Chemicals
Commercial humic acid was obtained from Fluka (CHA); sodium hydroxide and hydrochloric acid from Vetec. Aquatic humic acids (AHA) were collected from ecological reserve of the “Parque Estadual da Serra do Mar” located in São Paulo State, Brazil. This AHA was isolated, puriied and characterized as reported before.12
Samples of peat humic acid (PHA) were obtained from peat soil fractions collected at the margins of the Mogi Guaçu river (47o9’ W/21o5’ S) in the town of Luiz Antonio (São Paulo, Brazil). This humic acid was isolated, puriied and characterized as reported before.13
Speciic surface area determination
The speciic surface areas of the samples of HA were evaluated from the adsorption/desorption isotherm of nitrogen, using a Quantachrome Nova 2200 analyzer. The HA samples were previously dried under vacuum at 80 ºC for 6 h.14
Surface charge density determination
In order to determine the surface charge density, samples of humic acid were simultaneously titrated by potentiometry and conductimetry by using 50.0 mL of a 40.0 g L-1 HA aqueous suspension. Firstly, HA samples were completely protoned by the addition of 6.0 mL of a 1.0 mol L-1 hydrochloric acid (HCl) solution, and titrated using a 0.05 mol L-1 sodium hydroxide (NaOH) solution. The potentiometric determination was performed using a PHTEC pH-meter with a Ag/AgCl glass electrode to give the pH value of solution at every instant.15,16
UV-Vis spectroscopy
The structural conformation of humic acid macromolecule samples and its relationship with the pH medium were analyzed by using a UV-Vis Beckman DU spectrometer. A suspension of HA 0.5 mg L-1 with NaHCO
3 0.01 mol L-1, as electrolyte, was prepared and the pH of this solution was adjusted to several values (3, 5, 7, 9 and 11) by addition of HCl or NaOH, both 0.01 mol L-1, in order to obtain the E4/E6 ratio, i.e. absorbance ratio at 465 and 665 nm respectively. These different additions were made in order to observe the pH inluence on conformation of CHA, AHA and PHA structures.12
Scanning electron microscopy (SEM)
The structure conformation of the CHA, on natural and acid form, was also evaluated with the SEM images obtained from a Zeiss EVO 50 scanning electron microscope, using an electron beam of 20 keV, and metallization with gold on Baltec SCD 050 metallizer. For the natural form, the CHA was dialyzed for 24 h and lyophilized before obtaining the image. In order to obtain the acid form, 50 mL of a suspension of a 2 mg L-1 CHA solution was acidiied with HCl 0.10 mol L-1, until a pH value up to 3 was reached, over stirring at room temperature. After, the solution was lyophilized.
Results and Discussion
Speciic surface area
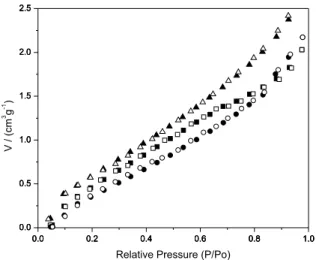
The speciic surface areas of humic acid samples were determined from the adsorption/desorption isotherms of nitrogen applying the BET equation.14,17 The analysis was performed by using high purity nitrogen as adsorbent, and liquid nitrogen as refrigerant bath because the adsorption is an exothermic process; thus, a temperature increase is unfavorable to adsorption. Figure 1 shows the adsorption/desorption isotherms of N2 on HA. This analysis showed the isotherms behavior and the absence of hysteresis which characterize the HA as a microporous material.14,18,19 HA samples also presented a low surface area, which gave 0.52, 0.48 and 0.71 m2 g-1 for CHA, PHA and AHA. This result is in agreement with the values reported before.20
Surface charge density
Colloids suspended in water are very complexes systems. Many processes like ionic sorption, particle/ particle interaction and dissolution of the material are a result of distribution and heterogeneity of surface sites.23 The surface electrostatic charge on the interface solid/ water is caused by the interaction of surface sites and the potential of the ions, and can be partially balanced by counter-ions. Each surface reaction is followed by heat exchanges that are important information to characterize the physicochemical interface reactions. According to the surface complexation model, the mechanism of surface charging will be interpreted by 2-pK model, as shown in the equations below, where the HA samples in water are regarded as a set of amphotheric sites which are diprotic acids.
HAH+ HA + H+; K
1; ∆H1; 1 (1)
HA H+ + A–; K
2; ∆H2; 2 (2)
H+ + OH– H
2O; Kw; ∆Hw; w (3) In this case, HA samples are the solid surfaces of humic acid, K, ∆H and ξ are: the equilibrium constant, the enthalpy and the change of the reactions extent of each reaction, respectively. Data in Figure 2 showed the titration of protonated CHA. Titrations were used to evaluate pK1 and pK2, which gave the values 2.03 ± 0.13 and 7.28 ± 0.13 for CHA, 1.97 ± 0.14 and 8.11 ± 0.11 for PHA, and 3.9 ± 0.13 and 5.75 ± 0.14 for AHA. The pH at the point of zero charge is related to the equilibrium constant values of the surface sites and is calculated by applying the equation:24,25
(4)
where [A−] is the concentration of humic acid unprotoned
samples and [HAH+] is the concentration of the protonated one. At the pHPZC, the [A−] = [HAH
+] and the equation 4
gives the pHPZC as the average of pK1 and pK2, which was pHPZC = 4.66 ± 0.26, 5.04 ± 0.25 and 4.83 ± 0.27 for CHA, PHA and AHA, respectively.
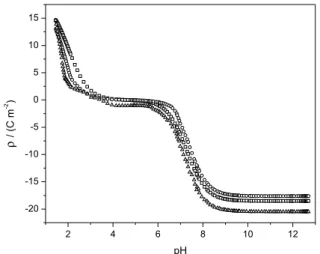
Then, the surface charge density of CHA, AHA and PHA were calculated using equation 5, and the obtained curve was plotted as a function of pH,15,16 as shown in Figure 3.
(5)
Figure 3 presents three distinct regions: the irst one refers to acid sites HAH+ (bulk solution), where the charge decreases hardly up to pH 3.5 for CHA and PHA. On the other hand, charge decreases softly up to 4 for AHA. From these pH, which is related to the second region, the surface charge density remains constant, σca. 0, which is related to amphoteric HA sites up to pH 6.5 for CHA and PHA, whereas pH 5.5 for AHA. Finally, on third region, above pH 8 for CHA and PHA and above pH 7 for AHA, the charge decreases hardly because of the dissociation of HA surface acid sites, which is complete at pH 9. This area corresponds to the basic sites of HA surface. This igure also suggests that the CHA and PHA are resistant to pH changes in a range between pH 3.5 and 6.5, whereas, AHA must be resistant to pH changes in a range between pH 4.0 and 5.5. Above pH 6.5 for CHA and PHA and above 5.5 for AHA, or below pH 3.5 for CHA and PHA, and below pH 4.0 for AHA, these samples tend to lose the buffer ability.5 Figure 1. Adsorption/desorption isotherm of N2 for CHA (-adsorption/
-desorption), for PHA (-adsorption/-desorption), and for AHA (-adsorption/-desorption).
The chemical properties of humic acids are complex and due to their chemical heterogeneity composition and the behavior of the surface charge, these properties are determined by surface reactions. Reactivity of functional groups is ruled by the protons. At a low pH value, the groups are protonated and at high pH values, neutralization reactions take place and the groups dissociate, becoming negatively charged.18,19
The comprehension of pH dependence on charge behavior around surfaces is important in order to control the colloidal stability of dispersion. Around a charged surface in aqueous solution, a diffuse electric double layer takes place, which protects the charge and let all the system uncharged. For example, around a negatively charged particle, the concentration of positively ions and protons are higher in the double layer than in the rest of the solution. This fact increases the cations binding surface. The electrolyte concentration determines the charge protection, and shows that at high ionic strength the double layer decreases because the ions in solution have a greater interaction with the solvent molecules and a lower interaction with the electric ield. Then, the ionic species have bigger mobility inside the solution. On the other hand, at low ionic strength, the electric ield overtaking inside the solution is bigger than taking to an enlargement of double layer.26
Therefore, electrostatic effects are expected to play an important role in the formation, phase behavior, and stability of aqueous suspensions of charged HA.
Molecular absorption spectroscopy
Investigation of structural conformation of HA samples is important because their structure has a hard influence on their chemical and physical properties, like the ability to react with metals and the stability of
the formed species. Structural conformation of macro molecules, like AH, is inluenced by several factors as pH, ionic strength, charge density, ionization degree of acid groups, concentration, hydrogen bonds and intermolecular arrangements.12 Besides, HA samples are able to form molecular aggregation in solution and their sizes are a function of pH.2
From the molecular absorption spectroscopy, we can obtain the E4/E6 index. This parameter is commonly used as a degree of molecular condensation and polycondensated aromatic-ring structures of humic substances.12,25,26 The E4/E6 ratio decreases whereas the molecular weight and aromatic structures increase. Higher values of the ratio can indicate the presence of high amounts of aliphatic structures.12,25,26
The dispersion of monochromatic light through a diluted solution of macromolecules or colloids is directly related to weight, particle size and interaction in the solution. However, according to Doty and Steiner,27 this kind of information can be derived from derivative spectroscopy, comparing the absorbances in distinct wavelenghts, applying the equation 6:
(6)
In this case, A is the absorbance of the solution; λ is the wavelength of transmitted light, β can be directly related to b/λ°, b is the largest dimension of the particle and λ° is the wavelength of incident light.12,27
Applying the relation E4/E6 according to Doty and Steiner equation, we can ind:12,27
(7)
(8)
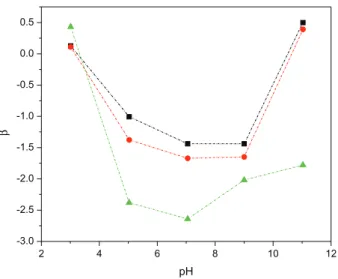
The β value can be directed related to the condensation level of HA macromolecule. The highest values of β indicate a condensed conformation of the humic macromolecule as shown in Figure 4 .
At low pH values, β is high indicating a more condensed structure due to hydrogen bonds, dispersive electrostatic forces as van der Waals and interactions among π-orbitals from aromatic rings. Besides, intra and intermolecular interactions can induce dipole formation because of the Figure 3. Surface charge density of CHA (), PHA (), and AHA ()
electrons delocalization, which also takes to an aggregate structure of humic molecule.
The lowest values of β are observed from neutral to basic pH as shown in Figure 4. This fact suggests that HA assume a more extended conformation due to an intra and intermolecular repulsion in association with an increase of negative charge on molecule surface, as it was observed on surface charge density curve, Figure 3.7
At extremely alkaline medium, the charge density on molecule surface increases negatively because of the dissociation of acid groups. However, the counter ions (Na+) can minimize the potential charge of the polyelectrolyte inducting an increase of double layer, causing repulsion and dispersion between the particles. On the other hand, in this region, HA present the highest value of β, which is characteristic of a condensed structure. This effect can be explained by a reduction of intra or intermolecular repulsion of the negatively charged groups, in a diluted solution, taking to a more condensed structure.12 Moreover, in this kind of system, HA are able to assume a micelle-like conformation because of their amphiphilic feature, it means, the molecule presents hydrophobic (apolar) moieties and hydrophilic (polar) ones, which are able to induce micelle-like conformation in solution. In both cases, the polar parts can present ionizable groups that dissociate upon contact with water, releasing neutralized counterions that shield the electrostatic interactions between different aggregates.12 Electrostatic screening may also result from dissociation of the added electrolyte in the suspension.10
The structural conformation of the humic macro molecule is ruled by pH and ionic strength. At neutral to alkaline media, the molecule tends to be extended as a result of intramolecular electrostatic repulsion. At high ionic strength or low pH, the polyelectrolyte presents a coil conformation.
SEM images
Scanning electron microscopy (SEM) images were obtained in order to observe the pH effect on morphology of the CHA structure. Figure 5 (a) shows that the CHA in their nature pH present a regular morphology, particles close to each other and amorphous and extended microstructures. Figure 5 (b) shows the CHA acid form, and it can be observed the aggregation of small particles into bigger and more isolated amorphous particles. This fact suggests that there is a supra molecular interaction between some humic molecules by dispersive forces such as van der Waals, π−π, CH−π interactions and mainly hydrogen bonds that make the structure more rigid and coiled.17 The SEM images are in agreement with the observations from β values, condensed conformation at acid pH becomes more extended with the increasing pH values. These values are representative of other HA samples.
These results corroborate with Saab et al.28 and Zara
et al.12 which suggested that in acid pH weak electrostatic interactions and hydrogen bonding are responsible for aggregates formation while in alkaline pH electrostatic interactions are strong due to the increase in groups ionization, resulting in more flexibles structures by dispersive forces.12,28
Figure 4. pH inluence on β index in CHA (), PHA (), and AHA () suspensions (0.5 mg L-1) and NaHCO
3 (0.01 mol L-1).
Figure 5. SEM Images of CHA in neutral pH (a) and acid form (b) of CHA.
Figure 4. pH inluence on β index in CHA (), PHA (), and AHA () suspensions (0.5 mg L-1) and NaHCO
Conclusions
Humic acid surface is protonated (H+/HA) at pH values below 4, and an aggregated structure is conirmed by β
values and SEM images, forming coiled supramolecular structures. At pH values between 4 and 6, the surface charge is close to zero (ρca. 0). This fact minimizes the intramolecular repulsion, making the humic macrostructure more extended and dispersed. The neutralization of HA acid sites makes the molecule surface get a negative charge, favoring the dispersion and extension of HA molecules. However, in extreme alkaline medium, the amphiphilic feature of HA favors the formation of a micelle-like structure, as it was observed by the elevation of β index. Finally, the experiments reported may be considered eficient tools to explore the chemical behavior of humic acid, due to the relationship of the molecular and supramolecular conformation and the pH of the medium.
Acknowledgments
The authors wish to thank CNPq and CAPES for fellowships and to FAPDF, CAPES and CNPq for inancial support. The donation of AHA by Prof. Dr. Luiz Fabricio Zara is greatly acknowledged.
References
1. MacCarthy, P.; Soil Sci.2001, 166, 738. 2. Piccolo, A.; Soil Sci.2001, 166, 810.
3. Prado, A. G. S.; Torres, J. D.; Martins, P. C.; Pertusatti, J.; Bolzon, L. B.; Faria, E. A.; J. Hazard. Mater.2006, 136, 585. 4. Prado, A. G. S.; Miranda, B. S.; Jacintho, G. V. M.; Surf. Sci.
2003, 542, 276.
5. Pertusatti, J.; Prado, A. G. S.; J. Colloid Interface Sci.2007,
314, 484.
6. Plaza, C.; Senesi, N.; Polo, A.; Brunetti, G.; Environ. Sci.
Technol.2005, 39, 7141.
7. Prado, A. G. S.; Airoldi, C.; Thermochim. Acta2003, 405, 287. 8. Prado, A. G. S.; Miranda, B. S.; Zara, L. F.; J. Hazard. Mater.
2005, 120, 243.
9. Prado, A. G. S.; Miranda, B. S.; Dias, J. A.; Colloids Surf., A
2004, 242, 137.
10. Tamashiro, M. N.; Henriques, V. B.; Lamy, M. T.; Langmuir
2005, 21, 11005.
11. Stumm, W.; Morgan, J. J. In Chemistry of the Solid-Water Interface: Processes at the Mineral-Water and Particle-Water
Interface in Natural Systems; Stumm, W.; Morgan, J. J., eds.;
2nd ed., John Wiley & Sons: New York, 1992.
12. Zara, L. F.; Rosa, A. H.; Toscano, I. A. S.; Rocha, J. C.; J. Braz.
Chem. Soc.2006, 17, 1014.
13. Prado, A. G. S.; Souza, S. M.; Lopes da Silva, W. T.; Rezende, M. O. O.; Quim. Nova 1999, 22, 894.
14. Teixeira, V. G.; Coutinho, F. M. B.; Gomes, A. S.; Quim. Nova
2001, 24, 808.
15. Parks, G. A.; Bruyn, P. L. D.; J. Phys. Chem.1962, 66, 967. 16. Campos, A. F. C.; Tourinho, F. A.; Silva, G. J.; Lara, M. C. F.
L.; Depeyrot, J.; Eur. Phys. J. E2001, 6, 29.
17. Brunauer, S.; Deming, L. S.; Deming, W. S.; Teller, E.; J. Am.
Chem. Soc. 1940, 62, 1723.
18. Faria, E. A.; Marques, J. S.; Dias, I. M.; Andrade, R. D. A.; Suarez, P. A. Z.; Prado, A. G. S.; J. Braz. Chem. Soc. 2009, 20, 1732. 19. Moura, A. O.; Prado, A. G. S.; J. Colloid Interface Sci. 2009,
330, 392.
20. Chiou, C. T.; Kile, D. E.; Rutherford, D. W.; Sheng, G. Y.; Boyd, S. A.; Environ. Sci. Technol.2000, 34, 1254.
21. Kallay, N.; Madic, T.; Kucej, K.; Preocanin, T.; Colloids Surf., A2004, 230, 3.
22. Prado, A. G. S.; Bolzon, L. B.; Pedroso, C. P.; Moura, A. O.; Costa, L. L.; Appl. Catal., B2008, 82, 219.
23. Costa, L. L.; Prado, A. G. S.; J. Photochem. Photobiol., A 2009,
201, 45.
24. Atkins, P. W.; Physical Chemistry, 7th ed., Oxford University
Press: Oxford, 2002.
25. Chen, Y.; Senesi, N.; Schinitzer, M.; Soil Sci. Soc. Am. J.1977,
41, 352.
26. Rocha, J. C.; Rosa, A. H.; Furlan, M.; J. Braz. Chem. Soc.1998,
9, 51.
27. Doty, P.; Steiner, R. F.; J. Chem. Phys.1950, 18, 1211. 28. Saab, S. C.; Carvalho, E. R.; Bernardes Filho, R.; Moura, M.
R.; Martin-Neto, L.; Mattoso, L. H. C.; J. Braz. Chem. Soc.
2010, 21, 1490.
Submitted: October 28, 2010