Article
J. Braz. Chem. Soc., Vol. 26, No. 9, 1769-1780, 2015. Printed in Brazil - ©2015 Sociedade Brasileira de Química 0103 - 5053 $6.00+0.00
A
*e-mail: [email protected]
Layered Zinc Hydroxide Salts Intercalated with Anionic Surfactants and
Adsolubilized with UV Absorbing Organic Molecules
Ana C. T. Cursino,a Vicente Rives,b Luís D. Carlos,c João Rochad and
Fernando Wypych*,a
aCentro de Pesquisa em Química Aplicada (CEPESQ), Departamento de Química,
Universidade Federal do Paraná, P.O. Box 19032, 81531-980 Curitiba-PR, Brazil
bGIR-QUESCAT, Departamento de Química Inorgánica,
Universidad de Salamanca, 37008 Salamanca, Spain
cDepartment of Physics and dDepartment of Chemistry, CICECO,
University of Aveiro, 3810-193 Aveiro, Portugal
Two anionic surfactants, dodecylsulfate (DDS) and dodecylbenzenesulfonate (DBS), were intercalated into layered zinc hydroxide salts (LHS) using the direct alkaline co-precipitation method, and characterized by powder X-ray diffraction (PXRD), Fourier-transform infrared (FTIR) and thermogravimetric analysis/differential thermal analysis (TGA/DTA). Different UV-absorbing organic molecules, like salicylates, cinnamates and benzophenones, were adsolubilized in the LHS interlayer following two different procedures (conventional microwave treatment and microwave with hydrothermal treatment). The adsolubilized products were investigated by PXRD, FTIR, diffuse reflectance UV-Vis (DRUV-Vis) and luminescence spectroscopies before and after exposure to UV radiation. Most of the products showed a good absorption in the UV region, from UVC to UVA, and good stability under UV radiation. The photodegradation tests showed that DDS-intercalated compounds were more stable than those intercalated with DBS. Adsolubilization in LHS can be an interesting alternative to immobilize neutral molecules with UV absorption capability, to prepare materials to be used in sunscreen formulations.
Keywords: layered hydroxide salt, intercalation, sunscreen, adsolubilization, solar protection
Introduction
Layered hydroxide salts (LHS) have a structure
based on that of brucite, Mg(OH)2, where a fraction of
the hydroxide anions of the layers have been replaced by appropriate anions or water molecules. This process generates a family of compounds with the typical formula
Mx+(OH)
x−y(Bn−)y/n.zH2O, where Mx+ stands for the metal
cation (e.g., Mg2+, Ni2+, Zn2+, Ca2+, Cd2+, Co2+ and Cu2+)
and Bn− is the counter-anion (e.g., Cl−, NO
3−, SO42−,
etc.).1-4 The interlayer anions can be easily exchanged by
other anionic species like carboxylates,5 fluorescein dye,6
orange and blue azo dyes,7-9 oxalatooxoniobate complex,10
molybdenum η3-allyl dicarbonyl complex,11 molecules with
solar protection activity,12,13 among others.
Different organic molecules which absorb UV radiation, like salicylates, cinnamates and benzophenones, are frequently used as sunscreen components, but they can penetrate into the corneous stratus, causing different skin reactions, such as contact dermatitis, allergies,
photoallergic reactions, and others.14,15 Layered inorganic
compounds (clays, layered double hydroxides and others) can absorb, scatter and reflect the UV radiation; if they host the UV absorbers in their interlayers these continue being active, but will not easily interact with the skin. So, immobilization of organic UV absorbing molecules within inorganic matrixes is an interesting alternative to reduce the absorption of organic sunscreens by human bodies.
anions (in clays or layered hydroxide salts, respectively) to increase the hydrophobicity of the interlayer; in addition, even weak interactions between these species and the UV absorbers will favor the intercalation of the organic UV absorber. The most widely species to be intercalated in layered hydroxide salts or layered double hydroxides are anionic surfactants such as dodecylsulfate (DDS) or
dodecylbenzenosulfonate (DBS).16-19 As these species
have also a rather large molecular size, swelling of the interlayers further favours intercalation of the usually large, neutral species.
Microwaves are often used as an energy source for heating reactants during preparation of solids, as they permit an increase in the crystallinity in shorter reaction times, also
decreasing energy consumption. Komarnemi et al.20 were
probably the authors who first reported the use of microwave electromagnetic energy coupled with hydrothermal treatment for the preparation of layered double hydroxides. They observed that these compounds crystallized faster under microwave-hydrothermal processing than under
conventional hydrothermal processing.20 After this work,
microwave-hydrothermal treatment became an adequate technique to prepare layered double hydroxides intercalated
with different inorganic and organic anions.21-25 The
application of microwaves might be useful for synthesizing compounds with adsolubilized neutral molecules containing intercalated UV radiation absorbers as well.
In this paper, we propose novel adsolubilized compounds prepared using conventional and microwave treatment of a mixture composed of layered hydroxide salt hosts intercalated with surfactants and adsolubilized with neutral, UV absorbers, organic guest molecules. This procedure was used to prepare sunscreens where the direct contact of this organic UV absorber with the skin is avoided, to enhance its ultraviolet absorption and to protect the molecule from photodegradation.
Experimental
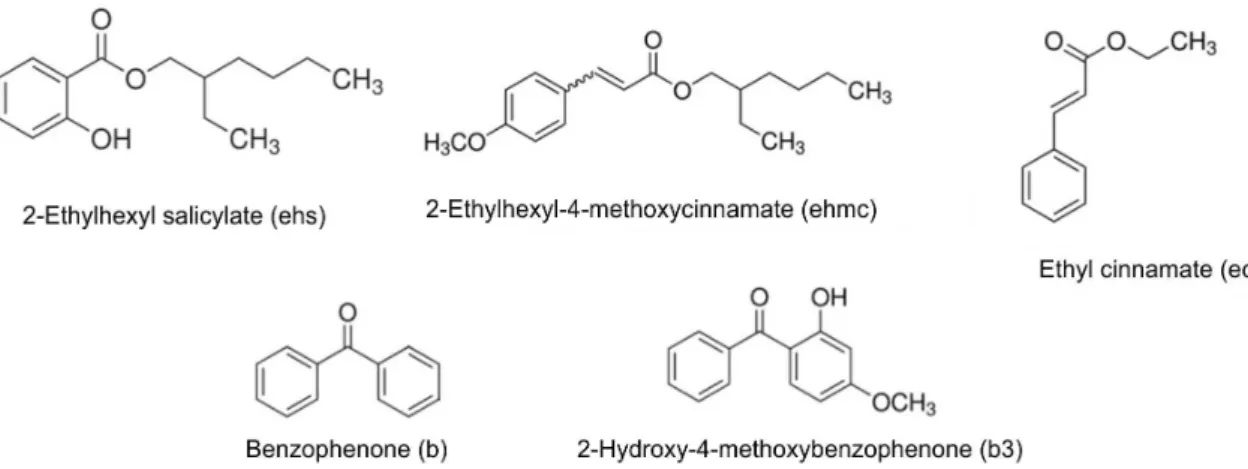
Organic and inorganic reagents were of analytical grade and were used without further purification. Benzophenone (Aldrich, 98%), 2-hydroxy-4-methoxybenzophenone (Aldrich, 98%), 2-ethylhexyl salicylate (Aldrich, 99%), ethyl cinnamate (Aldrich, 98%), and 2-ethylhexyl 4-methoxycinnamate (Aldrich, 98%) were selected as representative ultraviolet absorbers (Figure 1). Sodium dodecylbenzenesulfonate (95%, Aldrich, DBS) or sodium dodecylsulfate (90%, Synth, DDS) were used to increase the hydrophobicity of the swelled interlayer. Starting inorganic chemicals, zinc nitrate hexahydrate (98%, Panreac) and sodium hydroxide (99%, Vetec), were of reagent grade.
Synthesis of layered zinc hydroxide salts containing intercalated anionic surfactants
Surfactant-intercalated layered zinc hydroxide salts (LHS) were synthesized by co-precipitation at alkaline
pH as previously reported by some of us.12,13 Stock
1 mol L−1 aqueous solutions of NaOH and Zn(NO
3)2.6H2O
were prepared with distilled water and slowly dropwise added to the reactor (complete addition taking around 3 h) containing DBS or DDS, dissolved in 100 mL of water. Based on the expected formula of the LHS,
Zn5(OH)8(S)2.nH2O (S = surfactant), and to prevent any
contamination, an excess of surfactant was used: while the expected surfactant:Zn ratio was 0.4, the actual ratio used was 1.2. The reaction and the ripening process (24 h) were conducted at room temperature, under magnetic stirring and virtually constant pH. The solid was repeatedly centrifuged (3000 rpm) for 3 min, washed and dispersed with distilled water and finally dried at 60 °C in a vacuum oven until constant mass.
Preparation of the adsolubilized compounds
The method to prepare the adsolubilized compounds
was similar to that previously described.26 A portion
of 2 mmol of the layered zinc hydroxide salt sample intercalated with the surfactant (DBS or DDS) was mixed with 8 mmol of benzophenone (this UV absorber was selected for the preliminary experiments here described), in three different experimental batches. Based again on the ideal formulation, the amount of benzophenone was twice the theoretical content of the intercalated surfactant. Details on naming of all the samples prepared with this and other UV absorbers are given in Table 1.
In the first batch, the mixture was placed in a Teflon vessel inside a steel reactor, and heated at 80 °C in a drying oven for 12 days; this method will be described as the “fused state” one. The same procedure was used in the second batch, but benzophenone (8 mmol) was dissolved
in ethyl ether.26
Finally, in the third batch the mixture was placed in a household microwave oven with the power set to 40% for processing for 2 min, as preliminary experiments using 3 or 4 min led to formation of ZnO as a decomposition
byproduct.26
In all cases the compounds were washed twice with ethyl ether, centrifuged twice at 3000 rpm for 3 min and
dried at room temperature.26
The samples prepared using the microwave oven showed the best results, for example, they absorb a broader range of UV light and present high amounts of benzophenone adsolubilized in relation to that shown by the adsolubilization products prepared using conventional heating, so new attempts to prepare adsolubilized compounds by direct co-precipitation were made using a Milestone Ethos Plus multimode cavity microwave oven. The adsolubilized compounds were prepared by dissolving 8 mmol of the surfactant sodium salt (DBS or DDS) in 50 mL of water and mixing with 32 mmol of 2-hydroxy-4-methoxybenzophenone (b3) dissolved in 30 mL of acetone. A portion of 50 mL of a solution containing 20 mmol of
Zn(NO3)2.6H2O was slowly added to this mixture, and
the final pH was adjusted to 7 by addition of a NaOH
(1 mol L−1) solution.
The samples were placed in Teflon digestion vessels, sealed and mounted on a turntable in the microwave oven and submitted to microwave-hydrothermal treatment (MWHT) at 80 °C for 1 h. Temperature during irradiation was continuously monitored with a thermocouple introduced in a reference vessel. The software dynamically controls the temperature profile, adjusting the delivered power at any time to maintain a constant temperature. The precipitates were separated and washed by centrifugation with acetone and dried at room temperature.
Methods of characterization
Powder X-ray diffraction (PXRD) patterns were recorded with a Shimadzu XDR-6000 instrument using
Cu Kα radiation (λ = 1.5418 Å) and dwell time of 1° min−1.
The samples were placed and oriented by gently hand pressing on neutral and flat glass sample holders.
The Fourier-transform infrared (FTIR) spectra were recorded in a Bio-Rad FTS 3500GX instrument, using approximately 1% of the sample in 100 mg of spectroscopic grade KBr, the pellets being pressed at 10 ton. The measurements were performed in transmission mode with accumulation of 32 scans and recorded with a nominal
resolution of 2 cm−1.
Thermogravimetric analysis (TGA) and differential thermal analysis (DTA) were carried out in TG-7 and DTA-7 instruments, respectively, both from Perkin-Elmer,
in flowing oxygen at a heating rate of 10 °C min−1.
The UV-Vis reflectance spectra were recorded at room temperature by the diffuse reflectance (DRUV-Vis) technique in the 800-250 nm region, with a resolution of 0.5 nm, in a Varian Cary 100 spectrophotometer equipped with an integration sphere and using MgO as a reference.
The photoluminescence spectra of the solids were recorded at room temperature in a Perkin Elmer LS55 spectrofluorometer. The emission spectra for the photodegradation study were recorded at room temperature with a modular double grating excitation spectrofluorometer with a TRIAX 320 emission monochromator (Fluorolog-3, Horiba Scientific) coupled to a Hamamatsu R928 photomultiplier. The wavelengths of irradiation were
selected according to the λmax for each compound. The
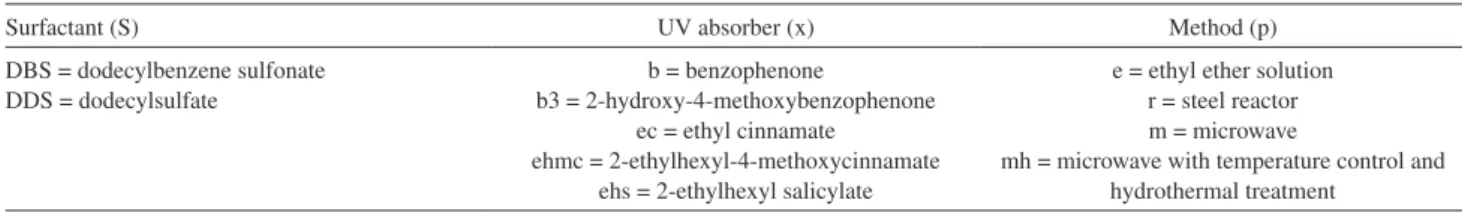
Table 1. Naming of the LHS/Sx-p samples
Surfactant (S) UV absorber (x) Method (p)
DBS = dodecylbenzene sulfonate DDS = dodecylsulfate
b = benzophenone
b3 = 2-hydroxy-4-methoxybenzophenone ec = ethyl cinnamate
ehmc = 2-ethylhexyl-4-methoxycinnamate ehs = 2-ethylhexyl salicylate
e = ethyl ether solution r = steel reactor m = microwave
decreased is presented as a percentage, related to the intensity of the peak.
High-performance liquid chromatography (HPLC) was performed with a Waters 600E instrument equipped with auto-sampling and photodiode array detectors (PDA). Separations were performed in a Waters C18 column using isocratic elution with 70% acetonitrile and 30% water at
a flow rate of 1.0 mL min−1. The samples were filtered
through a 0.22 µm syringe filter before injection into the
HPLC system. The detection wavelength was set at 285 nm. For quantification of the adsolubilized benzophenone, an external standard was used with the calibration curve obtained using high-purity benzophenone. The samples were prepared by dissolving 0.20 g of LHS intercalated with the surfactant and adsolubilized with benzophenone in 1.5 mL of hydrochloric acid (35%), followed by addition of 20 mL of distilled water. Liquid/liquid extractions were then performed by carrying out successive washings with diethyl ether. The organic fraction was dried in a rotary evaporator, at room temperature, and 1 mL of acetonitrile was added to the extracted fraction. The solution was
filtered into vials for subsequent analysis.26
Results and Discussion
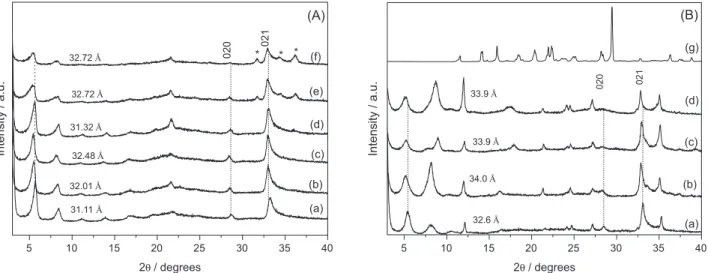
The PXRD patterns of the LHS intercalated with DBS or DDS are included in Figure 2. The patterns correspond to a crystalline phase of layered zinc hydroxide nitrate,
Zn5(OH)8(NO3)2·2H2O, identified by the JCPDS file
No. 24-1460.19, characterized by two non-basal maxima corresponding to diffraction by planes (002) and (021) in
the region of 33° (2θ).2 The basal distances calculated from
the PXRD patterns were 32.6 and 31.11 Å for LHS/DBS
and LHS/DDS, respectively, which are coincident with the values expected for the intercalation of these anions in an interdigitated monolayer arrangement, as proposed
by You et al.27
The PXRD patterns of the surfactant-intercalated LHS remained almost unchanged after adsolubilization of benzophenone, but basal spacing were somewhat larger. For instance, the basal spacing for LHS/DDSb-m [Figure 2A (d)] increased slightly by 0.21 Å, while for LHS/DDSb-e [Figure 2A (c)] and LHS/DBSb-r [Figure 2B (b)] the increase was 1.37 Å, in all cases with respect to the non-adsolubilized sample. This basal spacing increase can be attributed to the re-orientation of the surfactant entities to accommodate the adsolubilized neutral molecules between intercalated surfactant anions, adjusting their position to a new condition. Certainly, this adjustment is dependent on the concentration of the adsolubilized molecules and their interaction with the surfactant anions.
The figure also includes the diagram for sample LHS/DDSb-m submitted to microwave treatment for 3 min [Figure 2A (e)] and 4 min [Figure 2A (f)], revealing a basal distance of 32.72 Å. However, these products exhibited a small contamination by zinc oxide, evidenced by a set of characteristic diffraction peaks (indicated by *) between 30 and 40°, when DDS was used as the surfactant. No evidence of crystalline benzophenone was detected in the PXRD patterns.
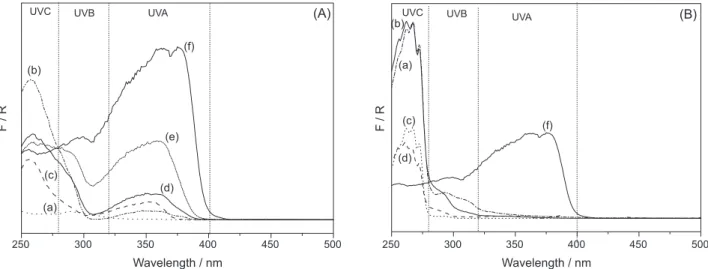
The presence of benzophenone was evidenced by DRUV-Vis spectroscopy, as this technique is very sensitive to this chemical. The absorption in the ultraviolet region of the LHS/DDS precursor without benzophenone was very small [Figure 3A (a)]. However, the absorption of the compounds after intercalation of benzophenone,
5 10 15 20 25 30 35 40
021
(f)
(e)
(d)
(c)
(b)
(a)
Intensity / a.u.
2 / degreesθ 2 / degreesθ
(A)
020
32.72Å
32.01Å
32.48Å
31.32Å
32.72Å
31.11Å
* * *
5 10 15 20 25 30 35 40
32.6Å
020 021
(g)
(b) (d)
(c)
Intensity / a.u.
(a)
(B)
34.0Å
33.9Å
33.9Å
Figure 2. PXRD patterns of LHS/S samples before (a) and after adsolubilization with benzophenone: LHS/Sb-r (b); LHS/Sb-e (c); LHS/Sb-m (2 min) (d);
[Figure 3A (f)] and [Figure 3B (f)], was significantly larger below 400 nm, comprising the regions of the UVC, UVB and part of the UVA region.
For the adsolubilized compounds, bands were recorded
at 250-310 nm and 320-390 nm, and were ascribed to π-π*
and n-π∗ transitions, respectively, of benzophenone. As
previously reported by Cursino et al.,26 these bands are
shifted to larger and smaller wavelengths, with respect to pristine benzophenone.
The DRUV-Vis spectra of the adsolubilized compounds prepared with the LHS/DBS precursor (Figure 3B) showed absorption only in the B and C ultraviolet regions, a behavior similar to that of the matrix. The products did not
absorb in the visible region (λ > 400 nm).
HPLC was used to quantify the amount of benzophenone adsolubilized in these samples. The concentrations of benzophenone in samples LHS/DDSb-r, LHS/DDSb-e and LHS/DDSb-m were 0.265, 0.074 and 0.084% (m/m), respectively. This demonstrates that even small amounts of benzophenone in the hydrophobic interlayer space of LHS give rise to significant absorption in the ultraviolet region. On the contrary, compounds prepared with DBS, LHS/DBSb-r, LHS/DBSb-e and LHS/DBSb-m, showed concentrations only of 0.03, 0.02 and 0.05% (m/m), respectively, so they were not efficient absorbers in the ultraviolet region A, as noted for the adsolubilized compounds when the precursor was LHS/DDS.
The UV absorption properties of the samples treated with microwaves were better than those showed by the other samples, despite the benzophenone content was more than three times larger in sample LHS/DDSb-r than in sample LHS/DDSb-m. Therefore, the microwave method with temperature control was adopted to prepare adsolubilized compounds with
2-hydroxy-4-methoxybenzophenone or benzophenone-3 (b3). For naming these samples a new letter was added (mh instead of m), see Table 1.
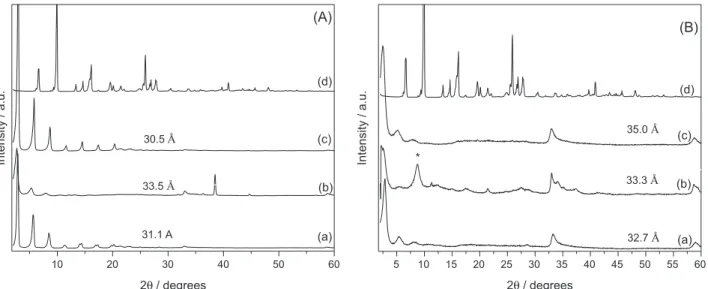
The powder X-ray diffraction patterns of the adsolubilized products containing benzophenone-3 (Figure 4) showed good crystallinity and an increase in the basal spacings was observed, compared to LHS/S (Table 2), suggesting the presence of adsolubilized benzophenone-3. The compound LHS/DDSb3-mh [Figure 4A (b)], for which the basal spacing was 31.1 Å without b3, showed an increase of 2.4 Å, up to 33.5 Å. However, when the precursor LHS/DBS was used, the increases were 0.6 and 2.3 Å for compounds LHS/DBSb3-mh and LHS/DBSb3-m [Figure 4B (b) and (c)], respectively.
The PXRD pattern of sample LHS/DBSb3-mh evidenced the presence of a contamination responsible for the diffraction maximum (marked as *) at 10.3 Å [Figure 4B (b)], attributed to the formation of zinc
hydroxide sulfate;28 its presence was confirmed by FTIR
spectroscopy, as the spectrum of this sample displayed
characteristic bands at 1165 and 603 cm−1 [Figures S1A
and S1B in the Supplementary Information (SI) section], assigned to the vibrational modes of the sulfate group.
T h e F T I R s p e c t r u m o f s a m p l e L H S / D D S
[Figure S1A (a)] showed strong absorptions due to C−H
stretching vibrations of the alkyl chains of DDS at 2957,
2922 and 2852 cm−1. The bands at 1235, 1065, 969 and
830 cm−1 were assigned to the vibration of sulfate anions.4
The intense absorption band centered at 3500 cm−1 can
be attributed to hydroxyl vibrations having multiple hydrogen bonds with water molecules and hydroxyl groups of the inorganic lattice. These bands were also observed in the spectrum of LHS/DBS [Figure S1B (a)]. The characteristic bands of sulfonate anions were observed at
1129 cm−1 [ν
as(S=O)] and 1038 cm−1 [νs(S=O)]. Ascription
of the most relevant bands recorded is included in Table 2. The FTIR spectrum of pure 2-hydroxy-4-methoxybenzophenone [Figure S1B (d)] showed the band
due to the aromatic C−H group at 3065 and 3013 cm−1
and the aliphatic C−H stretching bands were recorded at
2911, 2841 and 2946 cm−1. A characteristic band of the
axial deformation of the C=O bonds was also recorded at 1635 cm−1.29,30
In the spectra of all LHS/DDS compounds containing adsolubilized benzophenone-3 it was possible to identify characteristic bands of benzophenone-3, like the band
close to 1630 cm−1 attributed to the axial deformation
of the C=O bonds [Figures S1A (b) and (c)], although small shifts due to possible interaction with the surfactant molecules were also observed (Table 3). This interaction was also evidenced by the absorption bands of the sulfate groups, which interact with the positively charged LHS
layers in LHS/DDS (bands at 1235, 969 and 830 cm−1).
These bands were observed at 1244, 977 and 832 cm−1 and
1231, 967 and 830 cm−1, in samples LHS/DDSb3-mh and
LHS/DDSb3-m, respectively.
Bands related to benzophenone-3 in the region
3500-2800 cm−1 were not identified in the spectra of the
adsolubilized products, probably due to their overlap with the intense bands of the surfactant and to the low concentration of benzophenone-3 in the interlayer space.
The TGA curves (Figure S2) were different for the compounds with adsolubilized species than for the LHS/S precursors. The DTA results (not shown) for non-adsolubilized LHS/DDS revealed a complex decomposition profile with a series of endothermic events at 80, 117 and 163 °C, attributed to loss of both adsorbed and structural water, which correspond to ca. 6% of the initial mass in the TGA curve [Figure S2A (a)]. A mass loss of 41% between 150 and 750 °C was attributed to burning of organic matter
and dehydroxylation of the matrix,31 followed by formation
of ZnO and Zn3O(SO4)2, which subsequently decomposed to
ZnO, SO2 and O2, a process responsible for an endothermic
event (not shown) about 800 °C.28,32 Unfortunately, we could
not precisely observe the decomposition patterns since no analysis of evolved gases could be carried out.
The mass losses for precursor LHS/DDS were
consistent with the formula Zn5(OH)8(CH3(CH2)11OSO3)1.77
(NO3)0.23·3.37H2O, close to the expected one. The presence
of nitrate was concluded from a band in the FTIR spectrum
of this sample [Figure S1A (a)] at 1384 cm−1, characteristic
of nitrate anions in D3h symmetry. This band was also
Table 2. Basal spacing (dh00, color, λmaxexc and λmaxemi) of the LHS/S precursors and of the adsolubilized compounds
Sample dh00 / Å Color λmaxexc / nm λmaxemi / nm
LHS/DDS 31.1 white − −
LHS/DDSb3-mh 33.5 pale yellow 389 486
LHS/DDSb3-m 30.5 white 367 517
LHS/DBS 32.7 yellow − −
LHS/DBSb3-mh 33.3 pale yellow 373 486
LHS/DBSb3-m 35.0 dark yellow 388 503
dh00: basal spacing; λmaxexc: wavelength of the maximum excitation; λmaxemi: wavelength of the maximum emission.
10 20 30 40 50 60
30.5Å
(d)
(c)
(b)
Intensity / a.u.
2 / degreesθ
(A)
(a)
31.1 A 33.5Å
5 10 15 20 25 30 35 40 45 50 55 60
2 / degreesθ
Intensity / a.u.
(B)
(d)
(c)
(b)
(a) *
32.7Å 33.3Å 35.0Å
Figure 4. PXRD patterns of LHS/S (a) and of the adsolubilization products: LHS/Sb3-mh (b); LHS/Sb3-m (c); and raw benzophenone-3 (d), where
observed in the spectra of the LHS/DBS compounds [Figure S1B (a)], suggesting the presence of contaminating nitrate species; the formula proposed for sample LHS/DBS
is Zn5(OH)8(CH3(CH2)11C6H4SO3)1.32(NO3)0.68·3.71H2O.
Thermal decomposition of LHS intercalated with DBS displayed two endothermic peaks with maxima near 150 and 220 °C (not shown), which correspond to a mass loss of 6.7% [Figure S2B (a)], associated to the removal of physisorbed/intercalated water and the beginning of fragmentation of the surfactant molecule, respectively. Thereafter, a continuous mass loss (52.7%) took place from 250 to 600 °C. It can be assigned to combustion of the organic matter, dehydroxylation of the inorganic matrix and formation of zinc oxide.
The mass losses recorded between room temperature and 145 °C for the adsolubilized compounds LHS/DDSb3-mh and LHS/DDSb3-m [Figures S2A (b) and (c)] were 6.5 and 6.1%, 40.0 and 49.8% between 150 and 760 °C and 9.5 and 12.9% between 760 and 1000 °C. Therefore, the total mass losses for these compounds were 56 and 69%, respectively.
Compounds LHS/DBSb3-mh and LHS/DBSb3-m [Figure S2B (b) and (c)] showed mass losses (8.9 and 7.1%, respectively) attributed to the removal of physisorbed/ intercalated water, followed by mass losses of 38.1 and 52.2%, assigned to dehydroxylation and combustion of organic matter. The total mass losses were 47 and 59%, respectively.
The mass losses for the adsolubilization products LHS/DDSb3-m and LHS/DBSb3-m, were larger or almost identical than for their respective precursors (LHS/DDS and LHS/DBS), probably because they have a larger content of organic matter, indicating the presence of benzophenone-3. However, the mass losses for LHS/DDSb3-mh and LHS/DBSb3-mh were smaller than for LHS intercalated only with the respective surfactants. It can be tentatively assumed that total incorporation of the S anions did not take place and some of the positive charge of the layers
was balanced by interlayer nitrate anions, as suggested by
the FTIR spectra,28,32 above discussed.
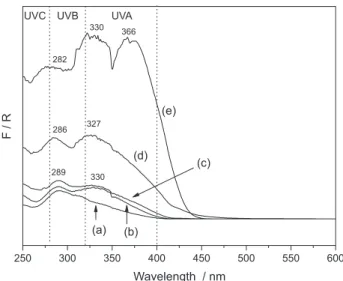
Figure 5 includes the DRUV-Vis spectra of the samples containing adsolubilized benzophenone-3. As the LHS/samples did not absorb the UV-Vis radiation, most of the bands in the analyzed spectra can be ascribed to benzophenone-3. The DRUV-Vis spectrum of pristine 2-hydroxy-4-metoxybenzophenone (Figure 5e) showed absorption bands in the ultraviolet region with maxima at 282, 330 and 366 nm. After adsolubilization, LHS/DBSb3-m (Figure 5d) and LHS/DBSb3-mh (Figure 5c) showed intense bands in the UV region, with maxima at 286 and 327 nm and 289 and 330 nm, respectively, positions very close to those of pristine benzophenone-3; however, the band at 366 nm seems to be absent for both samples.
The wavelength of the maximum absorption, λmax, was
shifted in the adsolubilized compounds. This may be due to interaction of benzophenone-3 with hydroxyl groups from the layered matrix, or even with the surfactant, which would
Table 3. Positions (in cm−1) and ascription of the infrared absorption bands of benzophenone-3 and its adsolubilization products
b3/ cm−1 LHS/Sb3-mh LHS/Sb3-m
DDS / cm−1 DBS / cm−1 DDS / cm−1 DBS / cm−1
νC=O 1635 1636 − 1633 1629
νCC βCH 1592 − − 1596 1599
νCC βCH 1507 1514 − 1511 1510
νCC βCH βCC 1348 1344 − 1350 1345
νCC βCH βCC 1260 − − − 1261
νCC βCH νCCsym νC-O 1114 1114 − 1114 1113
τRsym τRtri 915 917 − 916 916
τRtri τRsym γCH 708 699 − 708 700
ν: stretching; β: in-plane bending; γ: out of plane bending; τ: torsion; R: phenyl ring; tri: trigonal deformation; sym: symmetric.1
250 300 350 400 450 500 550 600
F / R
(a) (b)
(c) (d)
Wavelength / nm
282 330
327 286
289 330
(e)
UVA UVB
UVC
366
Figure 5. DRUV-Vis spectra of the adsolubilization products.
explain such a displacement for both regions of higher
(n-π*) and for lower energy (π-π*), as discussed earlier.26
After adsolubilization, intense bands with maxima at 486, 517, 486 and 503 nm were recorded, respectively, for samples LHS/DDSb3-mh, LHS/DDSb3-m, LHS/DBSb3-mh and LHS/DBSb3-m [Figure 6B (a) to (d)]. The excitation spectra of the adsolubilization compounds (Figure 6A) comprise the same region of the absorption spectra (Figure 5), showing that there is no process in the excited state. The changes in the spectra of these samples were further confirmed from their photographs under irradiation with UV light (Figure S3).
The photodegradation of the adsolubilization products was monitored by fluorescence emission spectroscopy (Figure S4). The excitation wavelength was set at 313 nm, and the spectra were collected at intervals of 5 min for 2 h and every 10 min to complete 4 h. The fluorescence intensity decreased gradually and after 2 h the compounds LHS/DDSb3-mh, LHS/DBSb3-mh and LHS/DBSb3-m (Figure S4) showed losses of 14, 59 and 62%, respectively. After 4 h of exposure, the degradation reached 25, 67 and 68% for these same compounds. It should be concluded that the product adsolubilized with the surfactant DDS was much more stable than with DBS. Performing the synthesis in microwave with controlled temperature and hydrothermal treatment (procedure “mh”) or conventional microwave (procedure “m”) oven has no significant influence on the stability of the adsolubilization products (middle and bottom panels in Figure S4). Consequently, for the adsolubilization of 2-ethylhexyl 4-methoxycinnamate (ehmc), ethyl cinnamate (ec) and 2-ethylhexyl salicylate (ehs), conventional heating with microwave (procedure “m”) was chosen.
The basal distances for the adsolubilized products derived from LHS/DBS did not increase significantly.
However, when using LHS/DDS, the basal peaks recorded
between 3 and 10° (in 2θ) split, i.e., two layered phases
are formed (Figures 7A and S5A, between ca. 6 and 8°). The characteristic diffractions by non-basal planes (020) and (021) were also recorded. Some diffraction peaks in
the region between 30 and 40° (2θ), due to ZnO, were also
recorded for sample LHS/DDSehs-m [Figure S5A (f)]. The average shift in the position of the first basal peak of each phase was around 3.3 Å, which is consistent with the addition of the van der Waals diameter of the water molecule (around
3 Å), associated with the intercalated anions.33
Despite the prevalence of the DDS bands, in the FTIR spectra, with no exceptions, characteristic bands of the adsolubilized organic compounds were recorded with no significant shifts after adsolubilization.
The compounds LHS/DBSec-m, LHS/DDSec-r [Figure 7A (b)], and LHS/DDSec-m [Figure 7A (c)]
show an intense band at 1710 cm−1 characteristic of the
carbonyl group and a small shifts in the order of 5 cm−1
were observed. This shift to higher energy regions is also observed in DRUV-Vis spectra (Figure 8B).
In adsolubilizated compounds with 4-methoxycinnamate 2-ethylhexyl shifts to shorter wavelengths were also observed. The bands in the spectra of LHS/DDSehs-r and LHS/DDSehs-m showed shifts to higher wavelengths compared to pure ehs (Figure 8C). Therefore, it can be concluded that the compounds adsolubilized with cinnamates (ehmc and ec) present a blue shift and those adsolubilizated with salicylates present a red
shift. This displacement is attributed to the cis-trans
photoisomerization of cinnamates,34 whereas when ehmc
and ec are confined in the hydrophobic environment of the interlayer space, the rotation is hindered, explaining the related shift.
275 300 325 350 375 400 425 450
Intensity / a.u.
Wavelength / nm 388.5
373
367.5
389 307
302.5
299
(c) (b)
(d)
(a)
(A)
400 450 500 550 600 650
(c)
(b) (d)
Intensity / a.u.
Wavelength / nm 503
486
486
517.5 (a)
(B)
Figure 7. PXRD patterns (A) and FTIR spectra (B) of LHS/DDS before (a) and after adsolubilization: LHS/DDSec-r (b); LHS/DDSec-m (c); ec (d).
Figure 8. DRUV-Vis spectra of LHS/DDS and LHS/DBS adsolubilizated with 2-ethylhexyl 4-methoxycinnamate (A) [(a) ehmc; (b) LHS/DBSehmc-m;
(c) LHS/DBSehmc-r; (d) LHS/DDSemhc-m; (e) LHS/DDSehmc-r], ethyl cinnamate (B) [(a) ec; (b) LHS/DBSec-m; (c) LHS/DBSec-r; (d) LHS/DDSec-m; (e) LHS-DDSec-r] and 2-ethylhexyl salicylate (C) [(a) ehs; (b) LHS/DBSehs-m; (c) LHS/DBSehs-r; (d) LHS/DDSehs-m; (e) = LHS/DDSehs-r].
250 300 350 400 450 500
F / R
UVA UVB
UVC (A)
Wavelength / nm (a)
(b) (c) (d) (e)
250 300 350 400 450 500
Wavelength / nm
F / R
UVA UVB
UVC
(B)
(a) (b) (c) (d) (e)
250 300 350 400 450 500
F / R
Wavelength / nm UVA UVB
UVC
(C)
(a) (b)
(c) (d)
In the emission spectrum of LHS/Sec [Figure S6 (II-A)] it was possible to observe intense bands with maxima at 458, 457, 432 and 435 nm for LHS/DBSec-r, LHS/DBSec-m, LHS/DDSec-r and LHS/DDSec-m, respectively. Significant shifts were observed in the positions of the maxima for compounds with different surfactants, whereas smaller shifts were detected in the samples obtained when using conventional heating (oven) and microwave irradiation. The same behavior was observed in the products adsolubilized with 2-ethylhexyl 4-methoxycinnamate [Figure S6 (II-B)] and 2-ethylhexyl salicylate [Figure S6 (II-C)]. The spectrum of LHS/DBSehs-r [Figure S6 (I-C)(a)] showed a second band with an absorption maximum at 360 nm; consequently this wavelength was chosen for the excitation and to record the emission spectrum. A reversal in the maximum intensity was observed. The excitation band at 312 nm was
due to the transition from the ground state to the S1π,π*
excited state of the −C6H4OH group and the shoulder
at 345 nm to the transition from the ground state to the
S1n,π* excited state. The emission band at 443 nm could
be assigned to the transition emission from T1π,π* to the
ground state and the shoulder at 403 nm to the transition
emission from T1n,π* to the ground state.35 This behavior
was not observed in the spectra of compounds whose surfactant was DDS. The strong blue luminescence of these compounds was further demonstrated by their digital photographs when excited by ultraviolet light [Figure S6 (II-C)]. The photodegradation of LHS/DDSehmc-m, LHS/DDSec-r, LHS/DDSehs-r and LHS/DBSehs-r was monitored by the fluorescence emission spectra (Figure 9), with the excitation wavelength set at 403, 377, 347 and 346 nm, respectively.
The fluorescence intensity decreased gradually after 2 h and the LHS/DDSehmc-m, LHS/DDSec-r, LHS/DDSehs-r, LHS/DBSehs-r compounds showed losses in their absorption of 48, 39, 58 and 85%, respectively. After 4 h of exposure, they retained only 40, 48, 33 and 9% of their absorption, respectively.
The 60% degradation of LHS/DDSehmc-m after 4 h
was a significant result, as Serpone et al.36 reported a
systematic study and found that the degradation of ehmc was of 90% in water, 40% in methanol, 45% in acetonitrile
and 40% in n-hexane, with only 30 min of exposure to
ultraviolet radiation and with almost complete degradation (95%) in hexane after 2 h of exposure. The absorption
decrease can be attributed to the cis-trans isomerization
and the formation of photodegradation products.34,36 When
comparing LHS/DDSehs and LHS/DBSehs, it can be concluded that the products intercalated with DDS were more stable than those intercalated with DBS.
Observing the BET curves (Figures S8 and S9), with the exception of the sample LHS/DBSb-mh, which is highly contaminated with a zinc hydroxide sulfate, all the isotherms are from the type IV according to the International Union of Pure and Applied Chemistry classification, which corresponds to mesoporous materials, generated by interparticles agregations. The hysteresis loops are from
H3 type, characteristic from layered structures. As N2 is
not expected to be adsorbed at the hydrophobic surface nor penetrate in the interlayer spaces, total and surface areas are smaller in the hydrophobic surfactant intercalate LHS compared with the hydrophilic ones. As the areas and pore volumes are reduced after the adsolubilization process, the presence of benzophenone is probably hindering the
adsorption process of N2 and promoting the particles
aggregations.37
Conclusions
The adsolubilization of benzophenone, benzophenone-3, 2-ethylhexyl 4-methoxycinnamate, ethyl cinnamate and 2-ethylhexyl salicylate into layered zinc hydroxide salts intercalated with the anionic surfactants was effective in all investigated methods of synthesis (conventional, microwave and microwave with hydrothermal treatment). After adsolubilization, in general, the compounds presented a small increase of the basal spacing. The FTIR spectra of the adsolubilization products presented bands characteristic of organic molecules, attesting the adsolubilization of benzophenones, salicylates and cinnamates. In spite of the relatively low concentration, the products showed a good adsorption in the ultraviolet region.
ultraviolet region, showing that adsolubilization can be an interesting alternative to immobilize neutral molecules with UV absorption capability.
Experiments are under way to create a protective nanometric silica shell around the adsolubilized compound crystals by the alkaline hydrolysis of tetraethylorthosilicate (TEOS), whose results will be the subject of a forthcoming publication.
Supplementary Information
Supplementary data (FTIR spectra, TGA curves, emission and excitation spectra, PXRD patterns and BET analysis) are available free of charge at http://jbcs.sbq.org.br as PDF file.
Acknowledgements
We gratefully acknowledge the Brazilian research agencies CNPq, CAPES, FINEP and the project Nennan (Fundação Araucária/CNPq) for their financial support of this work. A. C. T. C. thanks Ciências sem Fronteiras/CNPq and CAPES for the doctorate grant and V. R. acknowledges a grant from MICINN (MAT2009-08526) and ERDF.
References
1. Stählin, W.; Oswald, H. R.; J. Solid State Chem.1971, 3, 252.
2. Stählin, W.; Oswald, H. R.; Acta Crystallogr.1970, B 26, 860. 3. Stählin, W.; Oswald, H. R.; J. Solid State Chem. 1971, 3, 256.
4. Lee, J. W.; Choi, W. C.; Kim, J. D.; CrystEngComm2010, 12, 3249.
5. Wypych, F.; Arizaga, G. G. C.; Gardolinski, J.; J. Colloid Interface Sci.2005, 283, 130.
6. Lee, J. H.; Jung, D.-Y.; Kim, E.; Ahn, T. K.; Dalton Trans. 2014,
43, 8543.
7. da Silva, M. L. N.; Marangoni, R.; Cursino, A. C. T.; Schreiner, W. H.; Wypych, F.; Mater. Chem. Phys.2012, 134, 392.
8. Marangoni, R.; Ramos, L. P.; Wypych, F.; J. Colloid Interface Sci.2009, 330, 303.
9. Marangoni, R.; Mikowski, A.; Wypych, F.; J. Colloid Interface Sci. 2010, 351, 384.
10. Arizaga, G. G. C.; Gardolinski, J. E. F. C.; Schreiner, W. H.; Wypych, F.; J. Colloid Interface Sci.2009, 330, 352.
11. Gomes, A. C.; Bruno, S. M.; Gamelas, C. A.; Valente, A. A.; Abrantes, M.; Goncalves, I. S.; Romao, C. C.; Pillinger, M.;
Dalton Trans.2013, 42, 8231.
12. Cursino, A. C. T.; Gardolinski, J.; Wypych, F.; J. Colloid Interface Sci.2010, 347, 49.
13. Cursino, A. C. T.; Mangrich, A. S.; Gardolinski, J.; Mattoso, N.; Wypych, F.; J. Braz. Chem. Soc. 2011, 22, 1183.
14. Morête, A.; Rodrigues, J. C. C.; Pinto, J. F.; Rev. Port. Imunoalergol. 2002, 9, 331.
15. Wong, T.; Orton, D.; Clin. Dermatol. 2011, 29, 306.
16. Bruna, F.; Pavlovic, I.; Barriga, C.; Cornejo, J.; Ulibarri, M. A.;
Appl. Clay Sci.2006,33, 116.
17. Zhao, H. T.; Nagy, K. L.; J. Colloid Interface Sci. 2004, 274,
613.
18. Zhao, Q.; Chang, Z.; Lei, X. D.; Sun, X. M.; Ind. Eng. Chem. Res. 2011, 50, 10253.
19. Dekany, I.; Berger, F.; Imrik, K.; Lagaly, G.; Colloid Polym. Sci.1997, 275, 681.
20. Komarneni, S.; Li, Q. H.; Roy, R.; J. Mater. Res. 1996, 11, 1866.
21. Benito, P.; Herrero, M.; Labajos, F. M.; Rives, V.; Appl. Clay Sci. 2010, 48, 218.
22. Benito, P.; Labajos, F. M.; Mafra, L.; Rocha, J.; Rives, V.;
J. Solid State Chem.2009, 182, 18.
23. Fetter, G.; Hernández, F.; Maubert, A. M.; Lara, V. H.; Bosch, P.;
J. Porous Mat.1997, 4, 27.
24. Benito, P.; Labajos, F. M.; Rives, V.; Pure Appl. Chem. 2009,
81, 1459.
25. Sommer Marquez, A. E.; Lerner, D. A.; Fetter, G.; Bosch, P.; Tichit, D.; Palomares, E.; Dalton Trans.2014, 43, 10521.
26. Trindade Cursino, A. C.; Lisboa, F. S.; Pyrrho, A. S.; de Sousa, V. P.; Wypych, F.; J. Colloid Interface Sci. 2013, 397, 88.
27. You, Y. W.; Zhao, H. T.; Vance, G. F.; J. Mater. Chem.2002,
12, 907.
28. Hongo, T.; Iemura, T.; Satokawa, S.; Yamazaki, A.; Appl. Clay Sci. 2010, 48, 455.
29. Joseph, L.; Sajan, D.; Chaitanya, K.; Suthan, T.; Rajesh, N. P.; Isac, J.; Spectrochim. Acta, Part A 2014, 120, 216.
30. S u t h a n , T. ; R a j e s h , N . P. ; M a h a d eva n , C . K . ; Bhagavannarayana, G.; Spectrochim. Acta, Part A2011, 78,
771.
31. Leroux, F.; Adachi-Pagano, M.; Intissar, M.; Chauviere, S.; Forano, C.; Besse, J. P.; J. Mater. Chem. 2001, 11, 105. 32. Hongo, T.; Iemura, T.; Yamazaki, A.; J. Ceram. Soc. Japan
2008, 116, 192.
33. Wypych, F.; Arízaga, G. G. C.; Quim. Nova2005, 28, 24.
34. Tarras-Wahlberg, N.; Stenhagen, G.; Larko, O.; Rosen, A.; Wennberg, A. M.; Wennerstrom, O.; J. Invest. Dermatol.1999, 113, 547.
35. Sun, J.; Xie, W.; Yuan, L.; Zhang, K.; Wang, Q.; Mater. Sci. Eng., B1999, 64, 157.
36. Serpone, N.; Salinaro, A.; Emeline, A. V.; Horikoshi, S.; Hidaka, H.; Zhao, J. C.; Photochem. Photobiol. Sci.2002, 1, 970.
37. Cornejo, J.; Celis, R.; Pavlovic, I.; Ulibarri, M. A.; Hermosin, M. C.; Clay Miner.2000, 35, 771.
Submitted: January 20, 2015