BIOMEDICAL SCIENCES
AND
CLINICAL INVESTIGATION
www.bjournal.com.br
www.bjournal.com.br
Braz J Med Biol Res, August 2011, Volume 44(8) 738-747
doi: 10.1590/S0100-879X2011007500081
Citations to papers from Brazilian institutions: a more effective
indicator to assess productivity and the impact of research in
graduate programs
R. Meneghini
Institutional Sponsors
The Brazilian Journal of Medical and Biological Research is partially financed by
Faculdade de Medicina de Ribeirão Preto Campus
Ribeirão Preto
Ex plor e H igh - Pe r for m a n ce M S Or bit r a p Te ch n ology I n Pr ot e om ics & M e t a bolom ics
Brazilian Journal of Medical and Biological Research (2011) 44: 738-747 ISSN 0100-879X Concepts and Comments
Citations to papers from Brazilian institutions:
a more effective indicator to assess productivity
and the impact of research in graduate programs
R. Meneghini
Scientific Coordinator of the SciELO Project, FAP, Fundação de Apoio à Universidade Federal de São Paulo, São Paulo, SP, Brasil
Abstract
A recent assessment of 4400 postgraduate courses in Brazil by CAPES (a federal government agency dedicated to the im -provement of the quality of and research at the postgraduate level) stimulated a large amount of manifestations in the press, scientific journals and scientific congresses. This gigantic effort to classify 16,400 scientific journals in order to provide indicators for assessment proved to be puzzling and methodologically erroneous in terms of gauging the institutions from a metric point of view. A simple algorithm is proposed here to weigh the scientometric indicators that should be considered in the assessment of a scientific institution. I conclude here that the simple gauge of the total number of citations accounts for both the productivity of scientists and the impact of articles. The effort spent in this exercise is relatively small, and the sources of information are fully accessible. As an exercise to estimate the value of the methodology, 12 institutions of physics (10 from Brazil, one from the USA and one from Italy) have been evaluated.
Key words: Scientometrics; Institutional assessment; CAPES; Scientific journals; Citations
Introduction
Correspondence: R. Meneghini, Rua Machado Bittencourt, 430, 04044-001 São Paulo, SP, Brasil. E-mail: [email protected]
Received December 29, 2010. Accepted June 10, 2011. Available online June 24, 2011. Published August 19, 2011.
Assessment of scientific performance is becoming in
-creasingly dependent on scientometric indicators as tools
to complement peer evaluation. This trend has spread
widely in recent years and has been applied for many pur
-poses: analysis of merit for advancement in the academic
career, application of scoring criteria in the dispute for research funding, and ranking of scientific institutions and universities, among others. Debate on the use and misuse
of these indicators is abundant in the literature. Neverthe
-less, the requirement of its judicious use in the increas
-ingly overwhelming processes of assessment has been
recognized more and more as necessary (see comments in Nature (http://www.nature.com/news/2009/090923/full/ news.2009.933.html).
In Brazil, the federal agency CAPES, a branch of the Ministry of Education, devoted to the improvement of the quality of learning and research at the postgraduate (PG) level, has recently evaluated 16,400 scientific journals. The
attempt was to classify them according to their impact factor
[IF, Journal Citation Report (JCR), Thomson-Reuters] and/ or to their relative importance for 43 areas of knowledge into
which the 4400 Brazilian PG courses are classified. This criterion was not the only one used for the final classification of PG courses, but certainly it was the most important. To grasp the intricacy of the process, a given journal received different grades in distinct areas. The problems raised by
this procedure caused a large amount of confusion and led
to complaints by the Brazilian scientific community (1-3). The IF of the journals in which the scientific results of a
person or of an institution were published has been consid
-ered a very inappropriate indicator of scientific merit. The main reason lies in the citation distribution of the journal’s articles: typically, articles in the most cited half of the articles in a journal are cited ten times as often as the least cited half (4). For a small community of scientists, as is the case for a PG course, the use of the IF of the journals as an indicator of the quality of scientific production might result
in a much distorted picture of its merit. If scientometrics is
most knowledgeable evaluation procedure on a national
scale in science and education (5). In this article I will
sug-gest that the total number of citations is an encompassing indicator to be used to compare institutions in the same scientific field.
The present exercise has been carried out to show the feasibility of a much less demanding and time-consuming procedure of evaluation of PG courses through scientific indicators. Ten of the most renowned Brazilian institutions
of physics plus the Departments of Physics of the Universi
-ties of Princeton and Padua (as examples of distinguished international institutions, for the purpose of comparison) were chosen for this exercise.
The three main scientometric indicators, obtained from the Web-of-Science (WoS) and JCR, both affiliated with Thomson-Reuters, were 1) number of articles published in
each journal in a 5-year period (2003-2007); 2) number of ci
-tations per article to these publications in 2008; 3) the 5-year IF of the same journals used to publish the articles.
The reasons for these choices are explained in the Re
-sults section. Basically, the IFs of the journals that published
articles of a given institution are not, per se, an indicator of
quality of the institution. Instead, the number of citations is considered to be a more reliable gauge for quality.
Data sources, processing and results
Scientometric data were obtained from the WoS and JCR databases (Thomson-Reuters).
Ten Brazilian institutions of research in physics were
chosen for this study based on their reputation in the Brazil
-ian academic community. All of them maintain PG courses of high CAPES evaluation scores according to the 2004-2007 evaluation (http://qualis.capes.gov.br/webqualis/). They are:
Departamento de Física, Universidade Federal de Pernam
-buco (UFPE), Recife, PE; Instituto de Física, Universidade Estadual de Campinas (UNICAMP), Campinas, SP; Centro Brasileiro de Pesquisas Físicas (CBPF), Rio de Janeiro, RJ; Instituto de Física, Universidade de São Paulo (USP), São Paulo, SP; Instituto de Física, Universidade Federal do Rio Grande do Sul (UFRGS), Porto Alegre, RS; Instituto de Física, Universidade Federal de São Carlos (UFSCar), São Carlos, SP; Instituto de Física Teórica, Universidade
do Estado de São Paulo (UNESP), São Paulo, SP; Depar
-tamento de Física, Universidade Federal de Minas Gerais
(UFMG), Belo Horizonte, MG; Instituto de Física, Univer
-sidade Federal do Rio de Janeiro (UFRJ), Rio de Janeiro, RJ; Instituto de Física, Universidade de São Paulo (USP), São Carlos, SP.
Two institutions abroad were selected for the purpose
of comparison: the Physics Department of Princeton Uni
-versity (USA), one of the top institutions in the world, and the Physics Department Galileu Galilei of the University of Padua (Italy), respected for its tradition and current
research dynamism.
Institutions of research in physics
The application of 4 scientific indicators to these Univer
-sities is shown in Table 1. Among the Brazilian Institutions, the number of citations in 2008 to 2003-2007 articles ranges from 699 to 6200 (column 2). The Universities of Padua and Princeton are both above USP, the best classified among the Brazilian universities. They are 1.39 and 2.96 times higher,
respectively. The average citation per article (column 3) sets
the institutions approximately in the same order as the total
number of citations (linear regression, R2 = 0.923). So does
the indicator weighted average impact factor (WAIF) in column 4 (R2 = 0.931); less so does the indicator citations per article
divided by WAIF in column 5 (R2 = 0.803). This latter indicator
is important to measure how the average IF compares to the real citation average to the journals employed by the institutions. Column 5 shows that the number of citations achieved in the journals by the authors of some universities is well above that expected from their IFs. This is evident in the case of Princeton University, in which the number of citations per article is 2.1 times the WAIF of the journals that published its articles; in the case of the Brazilian Universities this same comparison falls
in a 0.8-1.0 interval.
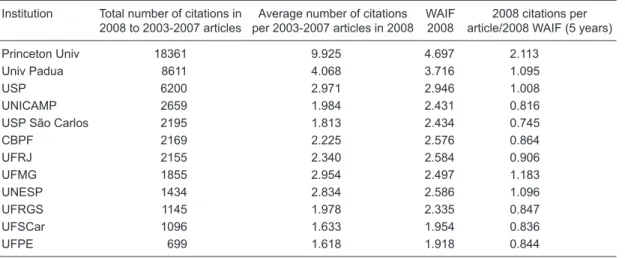
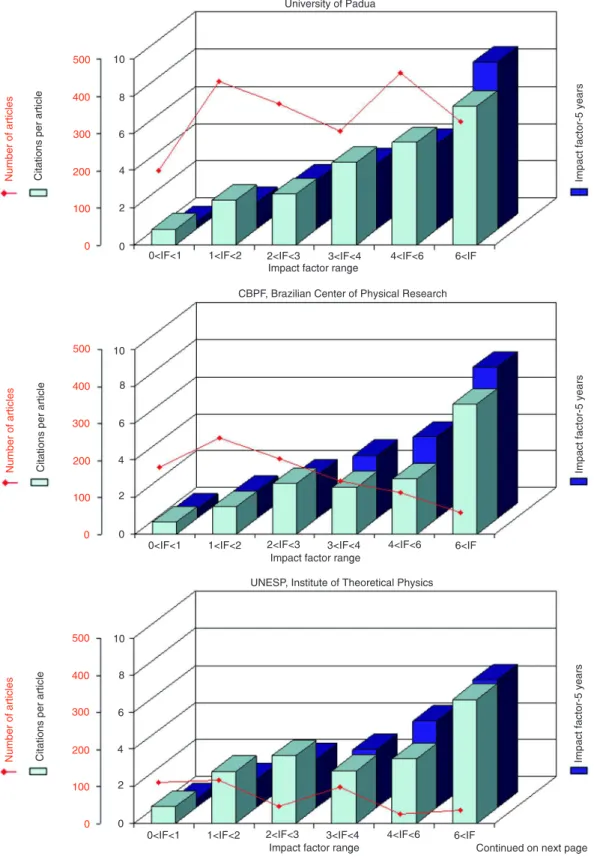
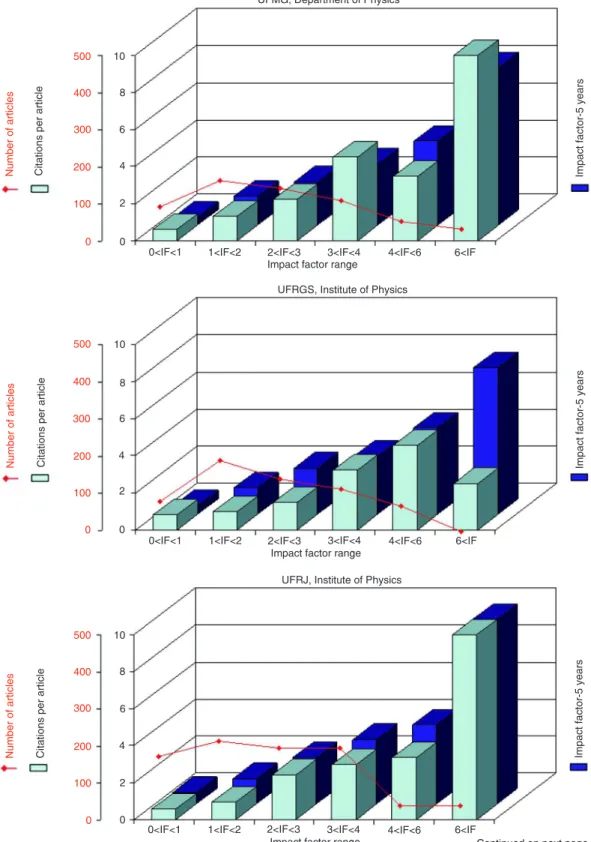
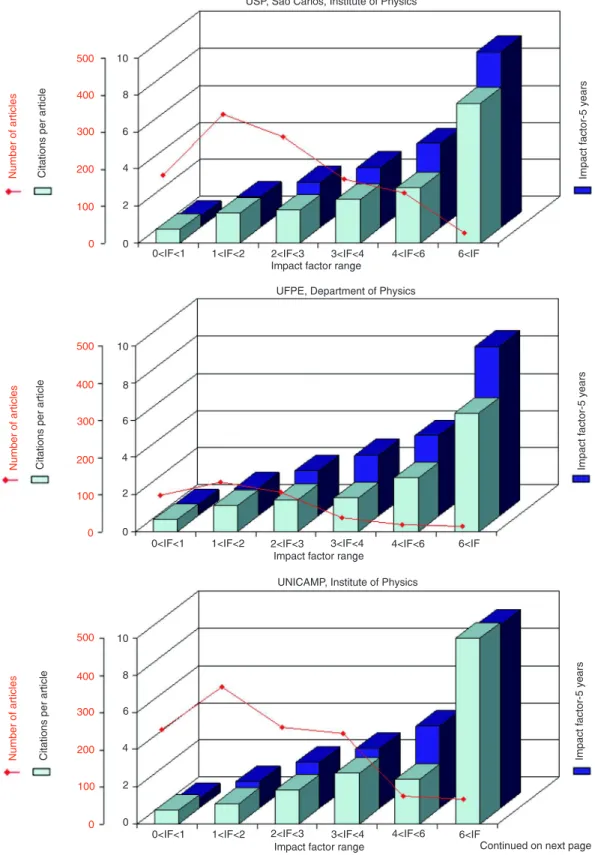
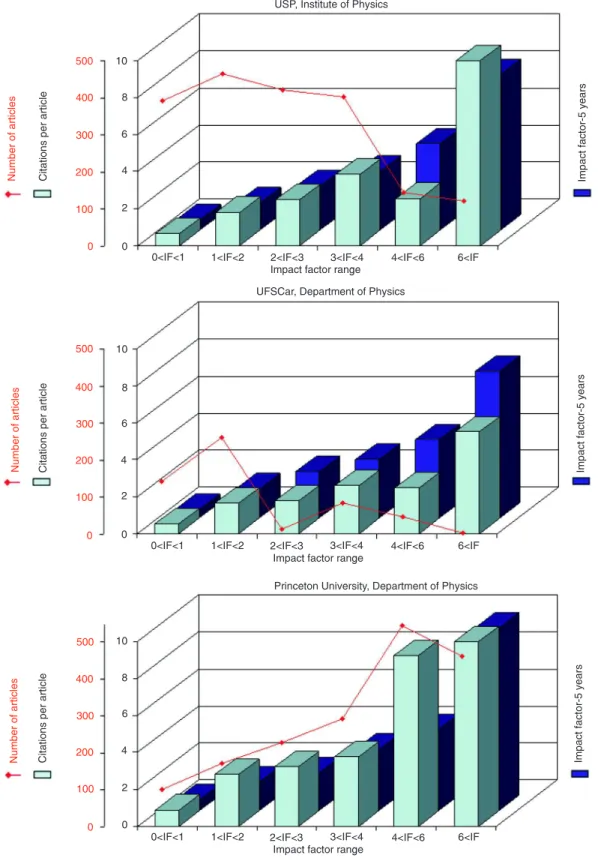
The correlations among the indicators can be better
appreciated in 3-D graphics in which 3 indicators are plot
-ted: citations per article, IF and number of articles (Figure 1). The light blue and the dark blue bars help to compare the citations per article and the IFs for the corresponding journals, respectively, for 6 IF intervals. For instance, the shorter light blue bars as compared to the dark blue bars in the case of UFPE show the trend of lower citations per article than expected from the average IF in each IF range. The opposite occurs for Princeton University. Notice that the red line (number of articles in each IF interval) clearly shows the tendency towards publishing more or less in the most prestigious journals. Thus, a glance at these graphs allows a quick grasp of the profile of the institutions.
Classifying the institutions
The data listed in Table 1 and illustrated in Figure 1 provide a very convenient way to establish a scientific metric procedure to assess the performance of institutions. The traditional triad of indicators is employed, namely, number of publications, number of citations per article and IF of the journals. However, instead of being examined separately, they are interconnected to allow both the exploration of
their attributes and to avoid the pitfalls of their use individu
740 R. Meneghini
its IF. This may be easily viewed in Figure 1 by comparing the light and dark blue bars. This approach eliminates the drawback of considering the IF as an isolated indicator of the quality of the articles by itself (4) since it is balanced by the real number of citations that the journal received in
the institution.
In this procedure, the journals are distributed in inter
-vals set by their IFs (Figure 1). It is possible to express
the inputs of the indicators in a simple algorithm in order
to obtain numerical values for the assessment of the insti
-tution. For this purpose one has to: 1) attribute a weight to each interval set by its minimum and maximum IF. The most obvious way is to take the WAIF of the journals used by the institution in each interval; 2) to consider the number of articles (na) in each interval (Figure 1); 3) to ponder, as reasoned above, the ratio between number of citations per number of articles (nc/na) and WAIF of the journals in each interval. Given these assumptions, the algorithm could be expressed as:
n
nc / na i WAIF i 1
(WAIF.na.
)
=∑
(Eq. 1)In order to appreciate the algorithm it is helpful to point out that the general idea is to weigh the “positive”
scien-tometric values (number of articles, number of citations and IF of the journals) for each institution. In principle, the “quality” of an institution should be in proportion to each of these “positive” parameters, and therefore with their product. The advantage of breaking down the total data into the intervals of IFs is a more didactic one and is
helpful for keeping a correspondence with the figures. For this reason, the final expression is given by a summation function, as shown above.
In this summation function, each term corresponds to an interval limited by IFs 0-1, namely, 1-2, 2-3, 3-4, 4-6, and >6. Each interval encompasses the WAIF of the articles in
this interval, the na and the nc. The positive outcome of the
two latter, in terms of productivity and quality, is obvious. The meaning of the expression [(nc/na)/WAIF] may be less evident. The numerator (nc/na) is the average number of
citations per article in the interval and the denominator is
the WAIF of the journals in that interval. If the numerator is
higher than the denominator it means that in that interval the institution produces articles whose citations achieve
numbers higher than those predicted by the impact factors (WAIF) and vice versa if the numerator is lower than the denominator. Therefore, the expression reflects a positive
outcome of quality.
Itis intriguing that the expression results in nc, namely,
the total number of citations, even though the other scien
-tific indicators were included in the algorithm. However,
on a second thought, it makes sense that nc expresses
best the comparative performance of institutions of the same nature. Considering a similar faculty size, a higher number of citations is likely to reflect both a higher rate of publications and more citations per article. In fact, each of these indicators taken separately are almost meaningless in this context.
The h-indexes of the institutions
The h-index (6) has been widely welcomed as an indi
-Table 1. Scientometric indicators of Brazilian institutions of physics.
Institution Total number of citations in 2008 to 2003-2007 articles
Average number of citations per 2003-2007 articles in 2008
WAIF 2008
2008 citations per article/2008 WAIF (5 years) Princeton Univ 18361 9.925 4.697 2.113
Univ Padua 8611 4.068 3.716 1.095
USP 6200 2.971 2.946 1.008
UNICAMP 2659 1.984 2.431 0.816
USP São Carlos 2195 1.813 2.434 0.745
CBPF 2169 2.225 2.576 0.864
UFRJ 2155 2.340 2.584 0.906
UFMG 1855 2.954 2.497 1.183
UNESP 1434 2.834 2.586 1.096
UFRGS 1145 1.978 2.335 0.847
UFSCar 1096 1.633 1.954 0.836
UFPE 699 1.618 1.918 0.844
Figure 1. Number of articles (2003-2007), citations per article (2008), and 5-year impact factor (2008) for 12
742 R. Meneghini
Figure 1 continued. Number of articles (2003-2007), citations per article (2008), and 5-year impact factor
Figure 1 continued. Number of articles (2003-2007), citations per article (2008), and 5-year impact factor
744 R. Meneghini
Figure 1 continued. Number of articles (2003-2007), citations per article (2008), and 5-year impact factor
cator of quality of individual scientists. The extension of the application of the h-index to institutions has been proposed (7,8). The assertion is that the h-index of an institution (hi)
is equal to h if the institution has published h articles, each of which has at least h citations. The h-indexes of the in
-stitutions retrieved from the WoS follow this definition and are shown in Table 2.
The h-index varies with the square root of the nc and
tends to underestimate productivity (6). It has a particular
advantage when comparing scientists of different academic
ages, because the nc favors those with long careers. When
comparing institutions in a same timeframe, as is the case in the present study, the advantage of using the h-index
vanishes.
The effect of articles produced by large
networks of authors on citation indicators
Networks with a large number of authors have been a matter of discussion in the area of scientometrics (9). These
networks are consistent with the need for collecting a mas
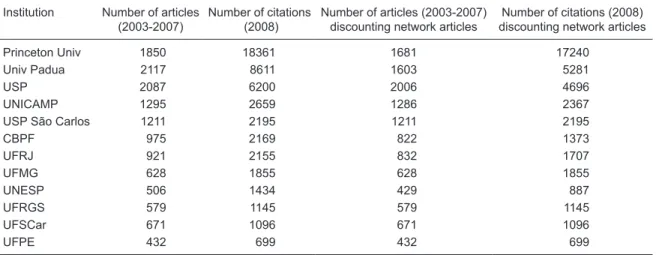
-sive amount of data. This is typically the case for multicenter studies in medicine, genomic-proteomic analysis in biology and subatomic particle collisions and astrophysical studies in physics. The individual or institutional participation in these enterprises significantly affects their scientometric indicators since such studies are bound to draw considerable interest and, consequently, highly cited articles. Fifteen networks were detected in the present assessment, most of them with hundreds of authors. In seven institutions these network articles were numerous, averaging 11.1% of the total articles (Table 3). However, 5 institutions did not publish articles
produced by large networks of authors.The eliminationof
the network articles caused a significant reductionin the
number of citations per article of most institutions, with the exception of Princeton University. This example illustrates the large impact of the regular articles of the Department of Physics of Princeton University.
Topics of research in the institutions
Physics has turned into a highly interdisciplinary field.
Its connection with chemistry is centennial whereas its
con-nection with molecular biology/biochemistry has increased steadily in the last 50 years. The research interest of a
Table 2. h-index of the institutions studied.
Institution Number of faculty
members (CAPES, 2006) h-index
Princeton Univ 84 120
Univ Padua 95 75
USP 124 67
UFMG 49 44
UFRJ 67 41
UNICAMP 89 40
CBPF 44 38
UNESP 22 36
USP São Carlos 62 34
UFRGS 49 30
UFPE 33 24
UFSCar 19 24
For identification of abbreviations of institutions, please see the “Data sources, processing and results” section. h-indexes were obtained from the Web of Science database on October 18, 2010.
Table 3. Effect of network articles on the total number of citations.
Institution Number of articles (2003-2007)
Number of citations (2008)
Number of articles (2003-2007)
discounting network articles discounting network articlesNumber of citations (2008)
Princeton Univ 1850 18361 1681 17240
Univ Padua 2117 8611 1603 5281
USP 2087 6200 2006 4696
UNICAMP 1295 2659 1286 2367
USP São Carlos 1211 2195 1211 2195
CBPF 975 2169 822 1373
UFRJ 921 2155 832 1707
UFMG 628 1855 628 1855
UNESP 506 1434 429 887
UFRGS 579 1145 579 1145
UFSCar 671 1096 671 1096
UFPE 432 699 432 699
746 R. Meneghini
physics institution in these two areas is dependent on the
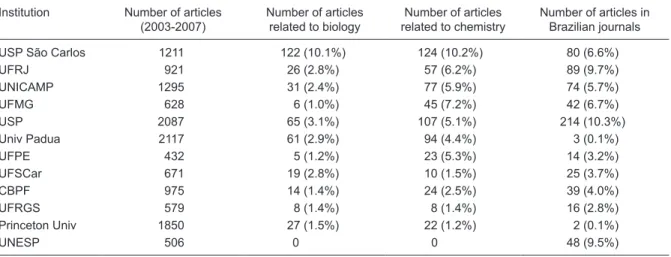
appeal they have for the faculty members and on the general scientific atmosphere that surrounds the institution. Table 4
shows the very strong trend towards research in biochem
-istry and chem-istry at some institutions. In the USP-São Carlos Institute of Physics, these areas account for 20.3% of the articles. In fact, a strong long-standing interest in
X-ray diffraction and optics has driven the research of this
institution towards chemistry, structural/molecular biology and photodynamics in biology and medicine. On the other hand, it is quite clear that the Department of Physics of the Princeton University is over focused on pure physics, whereas the UNESP Institute of Physics, being devoted to theoretical physics, practically has no investigation in these two areas. These distinct trends of research focus set different patterns for the journals used and this may have influenced the WAIF and citations per article shown in Table 1. However, this point was not investigated further.
Table 4 also lists the number of articles published in Brazilian journals. The ten Brazilian Institutions published an average of 6.2% of their articles in Brazilian journals, the great majority of which were in the Brazilian Journal of Physics. This is the only Brazilian journal that publishes original research on experimental and theoretical physics. The 5-year IF (2008) of this journal is 0.500, well below
the average citations per article in 2008 of the 2003-2007
articles of the Brazilian institutions of physics (Table 1, column 3). Nevertheless, in recent years this journal has increased both in IF and in publications of non-Brazilian articles, which attained 51.4% in 2007-2008!
Final considerations
A significant number of articles have already discussed the inexistence of a universal scientometric indicator to
gauge science output. The choice of a metric method is very much dependent on the specific aims and the characteristics of the subject of study. I have proposed that when the focus is the performance of a scientific institution the indicator
number of citations is the most appropriate one because it
comprises both productivity and impact. Whereas number of
citations per article, even crudely, gives an estimate of quality
(10), it does not include productivity. The widespread use of
the impact factor of the journals as a quality gauge has its own pitfalls (4) and also does not contemplate productivity.
As already pointed out, productivity is also underestimated if the h-index is the indicator of choice.
The size of the faculty has not been considered in the methodology proposed. In fact, a simple normalization
of the number of citations in terms of the faculty size is
troublesome, since in the case of very big or very small
institutions distortions may occur towards false impressions
of under- or over-productivity, respectively.
A large faculty will tend to generate a larger number of articles. However, this will not necessarily correspond to a larger number of citations, which is the parameter that encompasses both productivity and quality.
In the specific case of CAPES, the assessment of 16,400 journals as the basis for the evaluation of Brazilian PG courses involved a gigantic effort and was absolutely pointless. The challenge became insurmountable when different committees had to value the journals according to their interest and use. This survey was undertaken with the conviction that the procedure was sustained by a proper methodology, when this premise was undoubtedly wrong. The effort to obtain data on the total number of citations to the articles of an institution is immeasurably less. The database Web of Science, Scopus, SciELO, Scimago, and
Google Scholar are available to CAPES and to the institu
-tions. A complementary search may be carried out easily
Table 4. Articles related to biology and chemistry published by the institutions of physics.
Institution Number of articles (2003-2007)
Number of articles
related to biology related to chemistryNumber of articles
Number of articles in Brazilian journals USP São Carlos 1211 122 (10.1%) 124 (10.2%) 80 (6.6%)
UFRJ 921 26 (2.8%) 57 (6.2%) 89 (9.7%)
UNICAMP 1295 31 (2.4%) 77 (5.9%) 74 (5.7%)
UFMG 628 6 (1.0%) 45 (7.2%) 42 (6.7%)
USP 2087 65 (3.1%) 107 (5.1%) 214 (10.3%)
Univ Padua 2117 61 (2.9%) 94 (4.4%) 3 (0.1%)
UFPE 432 5 (1.2%) 23 (5.3%) 14 (3.2%)
UFSCar 671 19 (2.8%) 10 (1.5%) 25 (3.7%)
CBPF 975 14 (1.4%) 24 (2.5%) 39 (4.0%)
UFRGS 579 8 (1.4%) 8 (1.4%) 16 (2.8%)
Princeton Univ 1850 27 (1.5%) 22 (1.2%) 2 (0.1%)
UNESP 506 0 0 48 (9.5%)
References
1. Rocha-E-Silva M. [The new Qualis, or the announced trag -edy]. Clinics 2009; 64: 1-4.
2. Galembeck F, de Andrade JB. Qualis: quo vadis? Quim Nova
2009; 32: 5.
3. Lucena AF, Tiburcio RV. [Qualis periodical: view of an aca -demic on medical graduation]. Rev Assoc Med Bras 2009; 55: 247-248.
4. Seglen PO. Why the impact factor of journals should not be used for evaluating research. BMJ 1997; 314: 498-502. 5. Harnad S. Open access scientometrics and the UK Re
-search Assessment Exercise. Scientometrics 2009; 79: 147-156.
6. Hirsch JE. An index to quantify an individual’s scientific research output. Proc Natl Acad Sci U S A 2005; 102:
16569-16572.
7. Prathap G. Hirsch-type indices for ranking institutions’ sci -entific research output. Current Sci 2006; 91: 1439.
8. Da Luz MP, Marques-Portella C, Mendlowicz M, Gleiser S,
Freire-Coutinho ES, Figueira I. Institutional h-index: The performance of a new metric in the evaluation of Brazil-ian Psychiatric Post-graduation Programs. Scientometrics
2008; 77: 361-368.
9. Bollen J, Van de Sompel H, Smith JA, Luce R. Toward alter -native metrics of journal impact: A comparison of download and citation data. Information Processing & Management
2005; 41: 1419-1440.
10. Hermes-Lima M, Santos NCF, Alencastro ACR, Ferreira ST. Whither Latin America? Trends and challenges of science.
IUBMB Life 2007; 59: 199-210.
11. Batista PD, Campiteli MG, Kinouchi O, Martinez AS. Is it possible to compare researchers with different scientific interests? Scientometrics 2006; 68: 179-189.
12. Radicchi F, Fortunato S, Castellano C. Universality of citation distributions: toward an objective measure of scientific im -pact. Proc Natl Acad Sci U S A 2008; 105: 17268-17272. in these databases. Moreover, in a set of institutions of the
same nature but with specific interests toward subsets of scientific areas (for instance, in the present study, the strong
interest of some of the institutions of physics in carrying out
research in biochemistry and chemistry), correction can be made using available methodologies (11,12).