ACPD
14, 7469–7516, 2014Trends in particle phase liquid water
T. K. V. Nguyen et al.
Title Page
Abstract Introduction
Conclusions References
Tables Figures
◭ ◮
◭ ◮
Back Close
Full Screen / Esc
Printer-friendly Version Interactive Discussion
Discussion
P
a
per
|
D
iscussion
P
a
per
|
Discussion
P
a
per
|
Discuss
ion
P
a
per
|
Atmos. Chem. Phys. Discuss., 14, 7469–7516, 2014 www.atmos-chem-phys-discuss.net/14/7469/2014/ doi:10.5194/acpd-14-7469-2014
© Author(s) 2014. CC Attribution 3.0 License.
Atmospheric Chemistry and Physics
Open Access
Discussions
This discussion paper is/has been under review for the journal Atmospheric Chemistry and Physics (ACP). Please refer to the corresponding final paper in ACP if available.
Trends in particle phase liquid water
during the Southern Oxidant and Aerosol
Study
T. K. V. Nguyen1, M. D. Petters2, S. R. Suda2, and A. G. Carlton1 1
Department of Environmental Sciences, Rutgers University, New Brunswick NJ, 08901, USA
2
Department of Marine Earth and Atmospheric Sciences, North Carolina State University, Raleigh, NC, 27695, USA
Received: 30 January 2014 – Accepted: 28 February 2014 – Published: 18 March 2014
Correspondence to: M. D. Petters ([email protected])
ACPD
14, 7469–7516, 2014Trends in particle phase liquid water
T. K. V. Nguyen et al.
Title Page
Abstract Introduction
Conclusions References
Tables Figures
◭ ◮
◭ ◮
Back Close
Full Screen / Esc
Printer-friendly Version Interactive Discussion
Discussion
P
a
per
|
D
iscussion
P
a
per
|
Discussion
P
a
per
|
Discuss
ion
P
a
per
|
Abstract
We present in situ measurements of particle phase liquid water. Measurements were conducted 3 June to 15 July 2013 during the Southern Oxidant and Aerosol Study in the southeastern US. The region is dominated by biogenic emissions, impacted by anthro-pogenic pollution, photochemically active, humid, and known to contain high
concen-5
trations of organic aerosol mass. Measurements characterized mobility number size distributions of ambient atmospheric aerosols in three states: unperturbed, dry, and dry-humidified. Unperturbed measurements describe the aerosol distribution at ambi-ent temperature and relative humidity. For the dry state, the sample was routed through a cold trap upstream of the inlet then re-heated, while for the dry-humidified state the
10
sample was re-humidified after drying. The total volume of water and semi-volatile com-pounds lost during drying was quantified by differencing dry and unperturbed volumes from the integrated size spectra, while semi-volatile volumes were quantified diff erenc-ing unperturbed and dry-humidified volumes. Results indicate that liquid water was al-ways present. Water mass concentrations typically ranged from 1 to 5 µg m−3, but were
15
as high as 73 µg m−3. Hygroscopic growth factors followed a diel cycle and exceed two from 07:00 to 09:00 LT. The hygroscopicity parameter kappa ranged from 0.14 to 0.46 and hygroscopicity increased with increasing particle size. An observed diel cy-cle in kappa indicates that aerosol composition systematically changed on time scales of a few hours and influenced particle phase liquid water mass concentrations.
Un-20
perturbed and dry-humidified aerosol volumes did not result in statistically discernible differences, demonstrating that drying did not lead to large losses in dry particle vol-ume. We anticipate that our results will help improve the representation of aerosol water content and aqueous phase mediated partitioning of atmospheric photochemical models.
ACPD
14, 7469–7516, 2014Trends in particle phase liquid water
T. K. V. Nguyen et al.
Title Page
Abstract Introduction
Conclusions References
Tables Figures
◭ ◮
◭ ◮
Back Close
Full Screen / Esc
Printer-friendly Version Interactive Discussion
Discussion
P
a
per
|
D
iscussion
P
a
per
|
Discussion
P
a
per
|
Discuss
ion
P
a
per
|
1 Introduction
Atmospheric aerosols affect human health and welfare, global climate, visibility, and ecosystems. Aerosols are either directly emitted or form in the atmosphere through a myriad of chemical reactions involving a variety of anthropogenic and biogenic pre-cursors (Kanakidou et al., 2005; Hallquist et al., 2009). As a consequence, atmospheric
5
aerosols consist of a mix of chemically diverse lower and higher volatility compounds. While low-volatility species remain predominantly in the particle phase, semi-volatile compounds, including water, undergo equilibrium partitioning between the condensed and gaseous phases (Murphy et al., 1998; Pöschl, 2005; Robinson et al., 2007). Par-ticle phase liquid water and its interactions with aerosol chemical composition is
as-10
sociated with many aerosol health and welfare effects: acid deposition (Calvert et al., 1985), impaired visibility through light scattering (e.g. Malm et al., 1994; Park et al., 2004; Pitchford et al., 2007), and climate through effects on cloud condensation and ice nuclei (e.g. Cruz and Pandis, 1997; Pöschl, 2005). Quantitative characterization of ambient aerosol size, mass, and chemical composition, including water content, is
15
essential to adequately understand the fate and transport of chemicals in the Earth’s atmosphere, and to develop effective strategies that mitigate aerosol-related problems. Water is an abundant atmospheric constituent that is present in the condensed phase as a function of relative humidity (RH), temperature, aerosol concentration and chemical composition (Zhou et al., 2011). Liquid water is estimated to represent a
sub-20
stantial fraction of total tropospheric aerosol volume at RH>85 % (Kreidenweis et al., 2008) and is predicted to exceed total aerosol dry mass by 2 to 3 times globally (Liao and Seinfeld, 2005). The aqueous phase also provides a medium for the partitioning of polar, water-soluble gas phase species (Asa-Awuku et al., 2010; Prisle et al., 2010), thus facilitating secondary organic aerosol (SOA) formation (Carlton et al., 2009;
Er-25
ACPD
14, 7469–7516, 2014Trends in particle phase liquid water
T. K. V. Nguyen et al.
Title Page
Abstract Introduction
Conclusions References
Tables Figures
◭ ◮
◭ ◮
Back Close
Full Screen / Esc
Printer-friendly Version Interactive Discussion
Discussion
P
a
per
|
D
iscussion
P
a
per
|
Discussion
P
a
per
|
Discuss
ion
P
a
per
|
Several techniques exist to measure aerosol hygroscopic properties. In general, hy-groscopicity measurements characterize the change in aerosol properties in response to perturbations in RH. Sorooshian et al. (2008) provide a detailed overview of the different available techniques. Broadly, the approaches can be classified into meth-ods that probe single sizes and methmeth-ods that probe the entire aerosol. Popular single
5
size methods include the hygroscopicity tandem differential mobility analyzer (HTDMA) technique (Liu et al., 1978; Rader and McMurry, 1986; Suda and Petters, 2013), the laminar flow tube approach (Stratmann et al., 2004; Wex et al., 2005), and the sin-gle particle levitation approaches (Tang, 1996; Mitchem and Reid, 2008). The HTDMA technique has been routinely deployed in field experiments, providing rich datasets for
10
particle hygroscopic growth factors in a wide range of environments (e.g. McMurry and Stolzenburg, 1989; Berg et al., 1998; Dick et al., 2000; Swietlicki et al., 2008, and ref-erences therein). Popular methods that characterize the change in the entire aerosol with humidity include humidified nephelometery (Rood et al., 1985), aerosol hydra-tion spectrometry (Stanier et al., 2004; Hegg et al., 2008; Snider and Petters, 2008;
15
Engelhart et al., 2011), and gravimetric methods (Mikhailov et al., 2013). Single size methods are generally more precise and less ambiguous to interpret relative to bulk techniques. Bulk techniques, however, are useful because they characterize the en-tire aerosol rather than a subset and thus are needed to directly measure total water volume.
20
Here we introduce a newly developed bulk technique, semi-volatile differential mobil-ity analysis (SVDMA), to explicitly measure total aerosol liquid water and semi-volatile compound volumes. Our study is motivated by the need to explore the hypothesis that particle water enhances biogenic SOA volume through aqueous-mediated partitioning of biogenically-derived organic species as the result of anthropogenic perturbations
25
ACPD
14, 7469–7516, 2014Trends in particle phase liquid water
T. K. V. Nguyen et al.
Title Page
Abstract Introduction
Conclusions References
Tables Figures
◭ ◮
◭ ◮
Back Close
Full Screen / Esc
Printer-friendly Version Interactive Discussion
Discussion
P
a
per
|
D
iscussion
P
a
per
|
Discussion
P
a
per
|
Discuss
ion
P
a
per
|
enhanced by the presence of sulfates and nitrates that affect particle water uptake (Chan et al., 2010). Further, model predictions suggest liquid water mass concentra-tions are high (Carlton and Turpin, 2013), and that aqueous phase water attributed to anthropogenic sulfate may influence biogenic SOA mass (Carlton et al., 2010; Hoyle et al., 2011) in the area.
5
The SVDMA was deployed as a part of the Southern Oxidant and Aerosol Study (SOAS), a collaborative field campaign during the summer season near Talladega Na-tional Forest in Brent, Alabama. The site is situated at (32.903◦N, 87.250◦W), and at an elevation of 126 m. Data were collected from 3 June to 15 July 2013. Our principle objectives were to measure continuous in situ aerosol volume distributions of the dry,
10
semi-volatile, and particle phase liquid water constituents over the six-week time period of SOAS, and to identify chemical and thermodynamic controls on particle phase liquid water content. This work provides a description and analysis of the SVDMA instrument design, data reduction methods, and field measurement results, and also explores in-fluences on ambient water content.
15
2 Methods
2.1 Instrument design
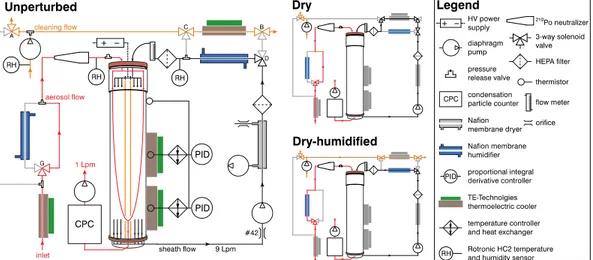
A schematic of the instrument and experimental setup is presented in Fig. 1. Ambient air entered the instrument via a preconditioning inlet assembly consisting of a copper tube (9.5 mm ID, ∼60 cm length) embedded in an aluminum block that was located
20
∼1 m a.g.l. under the roof of an open shed. The temperature of the copper tube could be stably controlled betweenTinlet−30
◦
C andTinlet+50 ◦
C (TE Technology LC-061). An optional Nafion membrane water-to-gas humidifier (PermaPure MH-series) was used to condition the aerosol. Subsequently the aerosol passed through a charge neutralizer (Aerosol Dynamics Inc. Model 100; Russell et al., 1996) holding four fresh210Po charge
25
ACPD
14, 7469–7516, 2014Trends in particle phase liquid water
T. K. V. Nguyen et al.
Title Page
Abstract Introduction
Conclusions References
Tables Figures
◭ ◮
◭ ◮
Back Close
Full Screen / Esc
Printer-friendly Version Interactive Discussion
Discussion
P
a
per
|
D
iscussion
P
a
per
|
Discussion
P
a
per
|
Discuss
ion
P
a
per
|
routed through an equilibration section (not pictured) before entering a high-flow diff er-ential mobility analyzer (DMA; Stolzenburg et al., 1998). The DMA sheath flow was controlled by a critical orifice (O’Keefe Controls Co., 9 L min−1) and configured in recir-culation mode. Monodisperse aerosol exiting the DMA was counted by a condensation particle counter (CPC; TSI 3772) operated at 1 L min−1. Aerosol transit times were 10 s
5
through the inlet loop, 6 s through the charge neutralizer, 5 s in the equilibration section between the Nafion humidifier and the DMA entrance, and 10.4 s through the DMA column.
The DMA was operated in scanning mobility particle sizer (SMPS) mode (Wang and Flagan, 1990). Negative voltage applied to the inner rod was held steady at 7 kV for
10
60 to 190 s, depending on the holding time of the present system state, and was then followed by an exponential decrease to 5 V over 300 s. Mapping between the time-varying electric field and selected particle mobility was achieved using the method of Wang and Flagan (1990). Conversion between particle mobility and mobility diameter followed standard DMA theory (Knutson and Whitby, 1975). The diameter range was
15
determined by the sheath flow rate and DMA dimensions (60 cm tall, 11.6 cm ID outer cylinder, 10 cm OD collection rod) and spanned from 13 nm to∼1.1 µm. The number size distribution was found via a standard inversion that accounts for the transmission of multiply charged particles using the method described in Petters et al. (2009a) with empirically determined adjustments accounting for particle transmission efficiencies
20
that are described in detail in Sect. 2.2.
Relative humidity and temperature control of the DMA column were unchanged from previous versions of the instrument (Suda and Petters, 2013). Since the instrument was placed inside a well-ventilated shed, and since the objective was to track ambient temperatures, the neoprene insulation used by Suda and Petters (2013) was removed.
25
ACPD
14, 7469–7516, 2014Trends in particle phase liquid water
T. K. V. Nguyen et al.
Title Page
Abstract Introduction
Conclusions References
Tables Figures
◭ ◮
◭ ◮
Back Close
Full Screen / Esc
Printer-friendly Version Interactive Discussion
Discussion
P
a
per
|
D
iscussion
P
a
per
|
Discussion
P
a
per
|
Discuss
ion
P
a
per
|
temperature determined the dew point temperature of the sheath and sample stream and was actively controlled by LabVIEW to match the ambient dew point temperature measured at the inlet. Temperature of the DMA column was measured using thermis-tors at the entrance, middle and bottom of the instrument. Two aluminum sleeves with PID controlled thermoelectric heat exchangers that were mounted on the outside were
5
used to reduce the standard deviation of the three thermistor temperatures to less than ±0.02◦C. The nominal RH inside the instrument was computed from the average of the three thermistor temperatures and the flow rate weighted average of the measured sheath and sample dew point temperatures from the RH sensors embedded in the flows (HC2 Rotronics, Hygroclip, RH=±0.8 % accuracy). We have previously
demon-10
strated (Suda and Petters, 2013) that this method of humidity control and measurement is sufficient for measuring aerosol hygroscopic growth and activity coefficients in tan-dem DMA studies at RH<90 %.
The panels in Fig. 1 show three instrument states. In theunperturbed state, no hu-midity conditioning occurred to the sample prior to particle sizing. The temperature of
15
the preconditioning copper tube and the DMA column temperatures equaled the tem-perature measured at the inlet. The Nafion humidifier was bypassed. The sheath flow was actively humidified to match the relative humidity of the sample stream. This con-figuration measured the particle size distribution with minimal perturbation to sample temperature and RH.
20
In thedry instrument state, the temperature of the copper tube was chilled to 30◦C below the inlet temperature (Fig. 1, panel 2). The temperature drop causes substances with dew point temperatures higher than the tubing temperature to condense onto the wall. Measurements of relative humidity downstream of the copper tube confirmed that the dew point of the sample was less than or equal to the temperature of the aluminum
25
ACPD
14, 7469–7516, 2014Trends in particle phase liquid water
T. K. V. Nguyen et al.
Title Page
Abstract Introduction
Conclusions References
Tables Figures
◭ ◮
◭ ◮
Back Close
Full Screen / Esc
Printer-friendly Version Interactive Discussion
Discussion
P
a
per
|
D
iscussion
P
a
per
|
Discussion
P
a
per
|
Discuss
ion
P
a
per
|
The dry-humidified state is similar to the unperturbed state (Fig. 1, panel 3). The difference is that the sample aerosol was dried to RH∼10 % using the same method as the dry instrument state. Subsequently, the sample stream was re-humidified before entering the SMPS. Presumably some semi-volatile substances were irreversibly re-moved inside the chilled copper tube. We expect that warming of the sample flow after
5
the copper tube would result in re-equilibration of the semi-volatile compounds, simi-larly to what is observed with water. Thus this configuration was intended to measure the particle size distribution with minimal perturbation to sample temperature and RH after removal of some fraction of semi-volatiles.
The full duty cycle of the instrument was unperturbed, dry-humidified, and dry,
fol-10
lowed by an automated cleaning cycle (not pictured in Fig. 1). During the cleaning cycle the temperature of the copper tube was warmed to 30◦C above outside temperature and back flushed with ambient air to remove water and other condensed substances from the tube. Complete cleaning was ensured by verifying that the dew-point tem-perature measured before and after the copper tube were indistinguishable within
ex-15
perimental uncertainty. Since the temperature of the copper tube had to be adjusted between the instrument states, there was a 160 s delay between the cleaning cycle and unperturbed state, 190 s between the unperturbed and dry-humidified states, 60 s between the dry-humidified and dry states. A total of 600 s was allotted for the cleaning cycle. Approximately two unperturbed, dry-humidified, and dry size distributions were
20
acquired per hour.
2.2 Instrument performance
Particle sizing accuracy was verified in the laboratory using polystyrene latex spheres (PSL; 102±3 nm; Thermo Scientific, lot #36489). The resulting measured size distri-bution was in agreement with the PSL size within the accuracy of the PSL spheres.
25
ACPD
14, 7469–7516, 2014Trends in particle phase liquid water
T. K. V. Nguyen et al.
Title Page
Abstract Introduction
Conclusions References
Tables Figures
◭ ◮
◭ ◮
Back Close
Full Screen / Esc
Printer-friendly Version Interactive Discussion
Discussion
P
a
per
|
D
iscussion
P
a
per
|
Discussion
P
a
per
|
Discuss
ion
P
a
per
|
dried in silica gel diffusion dryer (TSI 3062), charge equilibrated, and size selected by a second DMA (same origin and dimensions as the primary DMA, operated at 9 : 2 sheath-to-monodisperse flow ratio). Monodisperse aerosol was then routed to the SMPS and a second CPC (TSI 3771). Prior to these tests the two CPCs were intercompared sampling lab air side-by-side. Concentrations correlated well and the
5
systematic offset between the instruments was 7.6 %, which is within the manufacturer tolerance (±10 %). Using this setup, the kernel function accounting for DMA transfer entering the inversion algorithm (Petters et al., 2009a) for the selected bin resolution (60 bins) was determined for a series of mobility sizes between 20 and 600 nm. Re-duced transmission efficiencies were encountered for D <50 nm, presumably due to
10
diffusion losses. To account for reduced transmission a diameter dependent loss cor-rection was included into the inversion matrix. Overall performance of the instrument was confirmed by comparing DMA integrated number concentration with CPC mea-sured number concentration obtained either in simultaneously or sequentially with the size distribution scan. Concentrations from the integrated size distribution and the CPC
15
agreed within 10 %.
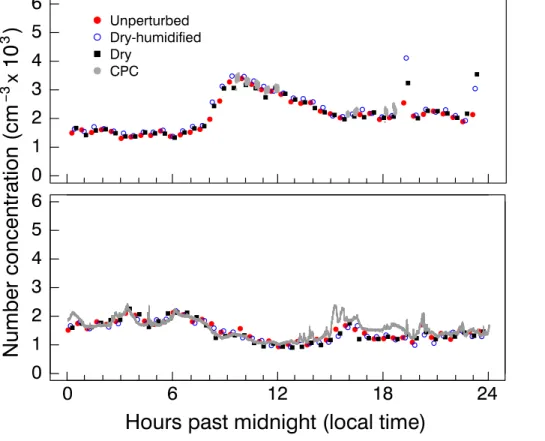
The aforementioned procedure does not capture losses that may occur in the pre-conditioning inlet assembly. These losses were different for the unperturbed, dry-humidified, and dry state. To account for differential transmission between the diff er-ent states, the unperturbed, dry-humidified, and dry states are multiplied by a constant
20
factor 1, 1.2, and 1.12 respectively to match the concentrations of a co-located CPC that was available prior to the start of the campaign (27–29 May) as well as 3–15 July. Between 3 June and 3 July instrument performance was validated by disconnecting the CPC from the DMA during several cleaning cycles. After 3 July the CPC sample flow was reduced to 0.5 L min−1 to accommodate flow requirements for a cloud
con-25
ACPD
14, 7469–7516, 2014Trends in particle phase liquid water
T. K. V. Nguyen et al.
Title Page
Abstract Introduction
Conclusions References
Tables Figures
◭ ◮
◭ ◮
Back Close
Full Screen / Esc
Printer-friendly Version Interactive Discussion
Discussion
P
a
per
|
D
iscussion
P
a
per
|
Discussion
P
a
per
|
Discuss
ion
P
a
per
|
there is generally satisfactory agreement between SMPS and CPC derived concentra-tions, although there are some time periods when the SMPS undercounted relative to the CPC (e.g. Fig. 2 bottom panel 15–20 h). The reasons for this are not entirely clear but undercounting occurs preferentially when fine mode aerosol are present. This indi-cates that transmission correction for particles withD <50 nm may not fully account for
5
the combined losses in the inlet assembly and the DMA column. We do not believe that these deviations are of concern since aerosol volume is most sensitive to accumulation mode sizes, and thus the error in volume introduced by these deviations is small.
2.3 Data reduction
The volume of water associated with the aerosol is described using the hygroscopicity
10
model of Petters and Kreidenweis (2007) and Kreidenweis et al. (2008):
Vw=Vdκ aw 1−aw
, (1)
where aw is the water activity, Vw and Vd are the volume of water and dry aerosol components, andκ is the hygroscopicity parameter. In general κ may vary with water activity and depends on particle chemical composition. For a particle composed of
mul-15
tiple components the particle’sκ can be computed from the volume-weighted mixture of its dry components
κ=Xεiκi, (2)
whereεi andκi are the volume fraction and hygroscopicity parameter of theith com-ponent comprising the particle. Water activity and RH are related via
20
aw=RH exp 4σ
wMw ρwRT D
−1
, (3)
ACPD
14, 7469–7516, 2014Trends in particle phase liquid water
T. K. V. Nguyen et al.
Title Page
Abstract Introduction
Conclusions References
Tables Figures
◭ ◮
◭ ◮
Back Close
Full Screen / Esc
Printer-friendly Version Interactive Discussion
Discussion
P
a
per
|
D
iscussion
P
a
per
|
Discussion
P
a
per
|
Discuss
ion
P
a
per
|
humidified particle diameter, and RH is the fractional relative humidity. Two hygroscopic growth factors can be defined:
gfvol=
Vw+Vd Vd
and gfD= D DD
, (4)
where gfvol and gfD are the volume and diameter based growth factors, and DD is the dry particle diameter. The dry particle composition can be conceptually divided
5
into a low volatile (lv) and a semi-volatile (sv) fraction. The component parameter sets are{εlv, κlv,Vw,lv and Vd,lv} and{εsv, κsv,Vw,sv and Vd,sv}, respectively. Assuming that volumes are additive (see Sect. 2.4 for further discussion), the total volume of water and dry components areVw=Vw,lv+Vw,svandVd=Vd,lv+Vd,sv.
Aerosol water and aerosol semi-volatile volumes are quantified using the measured
10
aerosol volume of three consecutively measured instrument states: unperturbed, dry-humidified, and dry. The measured volumes of the three states correspond to
Vunperturbed=Vw,lv+Vw,sv+Vd,lv+Vd,sv (5)
Vdry=Vd,lv
Vdry-humidified=Vw,lv+Vd,lv,
15
where Vunperturbed, Vdry, and Vdry-humidified are the total particle volumes measured for each instrument state, again assuming that volumes are additive. The semi-volatile volumes in Eq. (5) are operationally defined to correspond to the amount that was lost during the drying procedure. Consequently aerosol water volume is
20
Vw=Vdry-humidified−Vdry. (6)
As will be discussed in Sect. 4, the contribution ofVd,sv toVwwas not discernible. The semi-volatile volume is
ACPD
14, 7469–7516, 2014Trends in particle phase liquid water
T. K. V. Nguyen et al.
Title Page
Abstract Introduction
Conclusions References
Tables Figures
◭ ◮
◭ ◮
Back Close
Full Screen / Esc
Printer-friendly Version Interactive Discussion
Discussion
P
a
per
|
D
iscussion
P
a
per
|
Discussion
P
a
per
|
Discuss
ion
P
a
per
|
We note that the instrument defined loss ofVsv,instrumentimplies a loss of water that was hygroscopically bound in the particle. The amount of water associated with the semi-volatile fraction can be determined combining Eq. (7) with Eqs. (1) and (2) and solving for the amount of dry semi-volatile volume lost
Vd,sv=Vsv,instrument
1−aw 1−aw+κsvaw
. (8)
5
Equation (8) demonstrates that ifκsv=0 (corresponding to non-hygroscopic materials lost during drying),Vsv,instrumentis an accurate measure ofVd,sv. For cases whereκsv>0, Vsv,instrument will overestimate the amount of semi-volatile material lost. Equation (8) can be used to estimate the magnitude of this effect.
Volumes entering Eqs. (6) and (7) are derived from the size distribution data.
Vol-10
ume distributions were calculated from the number size distributions assuming particle sphericity following Seinfeld and Pandis (2006). Figure 3 shows example histograms of the inverted 60-bin representation of the number and volume size distribution. The data show that the size distribution is bimodal with mode diametersDp1∼0.06 µm and Dp2∼0.2 µm. The relative contributions of number and volume to the ratio of mode
15
#1 to #2 are ∼10 : 1 and ∼1 : 2, respectively. Low number concentrations result in poor counting statistics leading to the apparent noisiness of the volume distribution histograms in the larger size mode. A single false count in the largest diameter bins can significantly bias the total volume derived from the spectra. False counts some-times arise due to arcing in the DMA column. Arcing occurs at high relative humidity
20
and high electric potential leading to a breakdown of the electric field in the column. This enables transmission of smaller particles that are falsely sized in the large bins. These particles would appear as a peak atD∼1 µm (not seen in Fig. 3).
To filter out possible contributions from arcing, reduce the noisiness from low count-ing statistics, and identify the mode diameters in each scan, log-normal distribution
25
ACPD
14, 7469–7516, 2014Trends in particle phase liquid water
T. K. V. Nguyen et al.
Title Page
Abstract Introduction
Conclusions References
Tables Figures
◭ ◮
◭ ◮
Back Close
Full Screen / Esc
Printer-friendly Version Interactive Discussion
Discussion
P
a
per
|
D
iscussion
P
a
per
|
Discussion
P
a
per
|
Discuss
ion
P
a
per
|
distribution function. Artifacts from rogue counts at high diameters are filtered since a 3rd mode is not allowed. Distribution functions are fit to both the number and volume distributions separately. Example fits to the histograms are superimposed in Fig. 3. To test the efficacy of the fits to represent the data, the fit integrated number and vol-ume concentrations were compared. For the sample data set in Fig. 3, the medians of
5
the differences between measured and fitted values do not exceed 0.2 (i.e., medians of∆log10<0.2) across the observed size range for all three states. The figure also shows that log10 values for the data distribution generally exceed 0.2 for both number and volume distribution. Thus the variability in the data greatly exceeds any artificial error introduced by the two-mode parameterization, indicating that the two-mode
pa-10
rameterization is appropriate to model the size distribution.
The fitted volumes Vunperturbed and Vdry enter Eq. (6) to find Vw. Furthermore, Vdry definesVd in Eq. (1). For these calculations, we assume aw is equivalent to RH, and the implications of this assumption are discussed later on in Sect. 2.4.
Alternatively, growth factors are defined by calculating the ratio of the shift in the
15
mode diameters from the log-normal fit betweenVunperturbedandVdry:
gfi =Dpgi,unperturbed
Dpgi,dry , (9)
where gfi is the diameter growth factor of theith log-normal mode andDpgi,unperturbed and Dpgi,dry are the fit-returned mode diameters of the ith log-normal mode for the sequential unperturbed and dry measurement cycles. Conversion from RH to water
20
activity is performed using Eq. (3) and withDpgi,unperturbedas the particle diameter. The resulting diameter growth factors can be used to defineκ values that characterize the hygroscopicity of the individual modes:
κDi=
gf3i −1(1−aw)a− 1
w , (10)
whereκDi is the diameter based hygroscopicity parameter for theith log-normal mode.
ACPD
14, 7469–7516, 2014Trends in particle phase liquid water
T. K. V. Nguyen et al.
Title Page
Abstract Introduction
Conclusions References
Tables Figures
◭ ◮
◭ ◮
Back Close
Full Screen / Esc
Printer-friendly Version Interactive Discussion
Discussion
P
a
per
|
D
iscussion
P
a
per
|
Discussion
P
a
per
|
Discuss
ion
P
a
per
|
The fitted volumesVunperturbedandVdry-humidified enter Eq. (7) to findVsv,instrument. Since the scans were sequential, relative humidity was not necessarily the same between the two scans. To account for RH variations from the target value theVdry-humidified volume was empirically corrected to the RH corresponding the unperturbed cycle as recom-mended by Gysel et al. (2009). In our case, the correction is performed as follows. First,
5
κdry-humidified is determined fromVdry-humidified and Vdryusing Eq. (1) and RHdry-humidified. Second, we obtain the corrected state using:
Vdry-humidified,corrected=Vdryκvol
RHunperturbed
1−RHunperturbed +Vdry, (11)
where Vdry-humidified,corrected is the corrected volume for the dry-humidified state, and RHunperturbedis the average RH measured during the unperturbed state.
10
2.4 Sources of uncertainty
Since RHunperturbedwas slightly lower than that measured at the meteorological station due to slight heating of the shed, the reported water contents represent a lower esti-mate. Equation (11) can be used to estimate the corrected water content at conditions deviating from instrument conditions.
15
The DMA measures mobility diameter, which for spherical particles is equal to the volume equivalent diameter. During the unperturbed and dry-humidified state, particles that contain water will likely have a nearly spherical shape because water preferentially adsorbs at the corners and edges of the particle (Mikhailov et al., 2004). However, some particles may have a crystalline structure when dried. Particle shape
irregulari-20
ties increase the drag inside the DMA and result in a larger electric mobility diameter measured. Compounds with a cubic structure, for example, have a shape factor of 1.08 (e.g. Kelly and McMurry, 1992). Gysel et al. (2002) calculated that the relation between the volume equivalent diameter and the mobility diameter of a cubic particle is 0.96, which indicates a 4 % overestimate of particle diameter by the DMA for cubic particles.
ACPD
14, 7469–7516, 2014Trends in particle phase liquid water
T. K. V. Nguyen et al.
Title Page
Abstract Introduction
Conclusions References
Tables Figures
◭ ◮
◭ ◮
Back Close
Full Screen / Esc
Printer-friendly Version Interactive Discussion
Discussion
P
a
per
|
D
iscussion
P
a
per
|
Discussion
P
a
per
|
Discuss
ion
P
a
per
|
As a result, the volume distribution calculated from the mobility diameters of irregularly shaped particles during the dry state may be overestimated, which would result in an underestimate of water content when we difference the dry-humidified and dry states.
The calculations also assume volume additivity, i.e. that aerosol species volumes are independent of solution concentration and of species mixing fractions. Detailed studies
5
of water activity for inorganic compounds show that excess volume of mixing can be large for some systems, particularly at low water content (Clegg et al., 1998; Wexler and Clegg, 2002). However, other studies find that volume additivity holds, although this may be due to the cancellation of excess volumes (Stokes and Robinson, 1966). Mikhailov et al. (2004) found volume additivity to be a safe assumption for aerosols
10
composed of proteins and salts for which the individual densities and behavior in so-lution were known. In the absence of detailed knowledge of composition and the com-ponent behavior in solution, as is the case with ambient aerosol, volume additivity has typically been assumed (Dick et al., 2000; Speer et al., 2003). Dick et al. (2000) constrained their results with the calculation that for simple aqueous inorganic
solu-15
tions volume additivity mis-estimates particle phase liquid water by−7 % for H2SO4at RH=90 % and by<5 % for deliquesced NH4HSO4, (NH4)3H(SO4)2, and (NH4)2SO4, thus providing an estimate of error for different ammonium-to-sulfate ratios for the inor-ganic fraction of ambient aerosols. In sum we conclude that the assumption of volume additivity may introduce a small error in our calculations when molecular interactions in
20
the solution deviate from the pure components.
Since multiple sizes contribute to the fitted volumes, the conversion from instrument RH (Sect. 2.1) toawvia Eq. (3) is not straightforward. We therefore assumeawis equiv-alent to RH averaged over the scan to compute a size distribution integrated volume based hygroscopicity parameter,κvol, from Eq. (1). The expected difference between
25
RH and water activity are between 0.01 and 0.02 in absolute units (e.g. Tang, 1996) and will result an RH dependent overestimate inκvolranging from 4 to 11 %.
In-ACPD
14, 7469–7516, 2014Trends in particle phase liquid water
T. K. V. Nguyen et al.
Title Page
Abstract Introduction
Conclusions References
Tables Figures
◭ ◮
◭ ◮
Back Close
Full Screen / Esc
Printer-friendly Version Interactive Discussion
Discussion
P
a
per
|
D
iscussion
P
a
per
|
Discussion
P
a
per
|
Discuss
ion
P
a
per
|
side the Nafion tube during the dry-humidified state, the RH approaches ∼100 % at the temperature that approximates the dew point temperature of the outside air. Thus most particles that can deliquesce at subsaturated relative humidity will contain wa-ter exiting the Nafion. Particles may or may not effloresce prior to entering the DMA. If Vdry-humidified exceeds Vunperturbed, it may be possible that a sufficiently large volume
5
of water was added by the deliquescence of water on particles that were effloresced under unperturbed conditions.
The removal of semi-volatile compounds in the preconditioning inlet also has as-sociated uncertainties. First, the assumption of fast kinetics is made for the aerosol dissolution. However, this may not be the case if RH is low, as the aerosol becomes
10
viscous and formation of a homogenous liquid phase may be slow (Vaden et al., 2011; Renbaum-Wolff et al., 2013). Second, it is assumed that evaporation rates are fast enough to remove semi-volatiles in the inlet even though evaporation rates may be slow (Bilde et al., 2003). Succinic acid, for example, has been measured to have an evaporation rate of 2.76 nm s−1at 299.8 K and 64.1 % RH (Koponen et al., 2007). The
15
residence time of the preconditioning inlet may not be adequate to capture full evapora-tion of succinic acid. It is possible that succinic acid and similar substances are treated as a nonvolatile in the inlet. The third uncertainty is the phase state of the particles after drying. Sub-cooled liquid vapor pressure may be up to three orders of magnitude higher than solid vapor pressure (Booth et al., 2010). Since partitioning between gas
20
and particle phase is dependent on the saturation vapor pressure of the organic com-pound in the liquid state (Pankow, 1994), semi-volatile content may be underestimated if particles are in the solid state after drying. However, water in the organic phase could reduce organic equilibrium partial pressure according to Raoult’s law (Pankow and Chang, 2008), though this effect did not play a strong role onα-pinene SOA formation
25
ACPD
14, 7469–7516, 2014Trends in particle phase liquid water
T. K. V. Nguyen et al.
Title Page
Abstract Introduction
Conclusions References
Tables Figures
◭ ◮
◭ ◮
Back Close
Full Screen / Esc
Printer-friendly Version Interactive Discussion
Discussion
P
a
per
|
D
iscussion
P
a
per
|
Discussion
P
a
per
|
Discuss
ion
P
a
per
|
3 Results
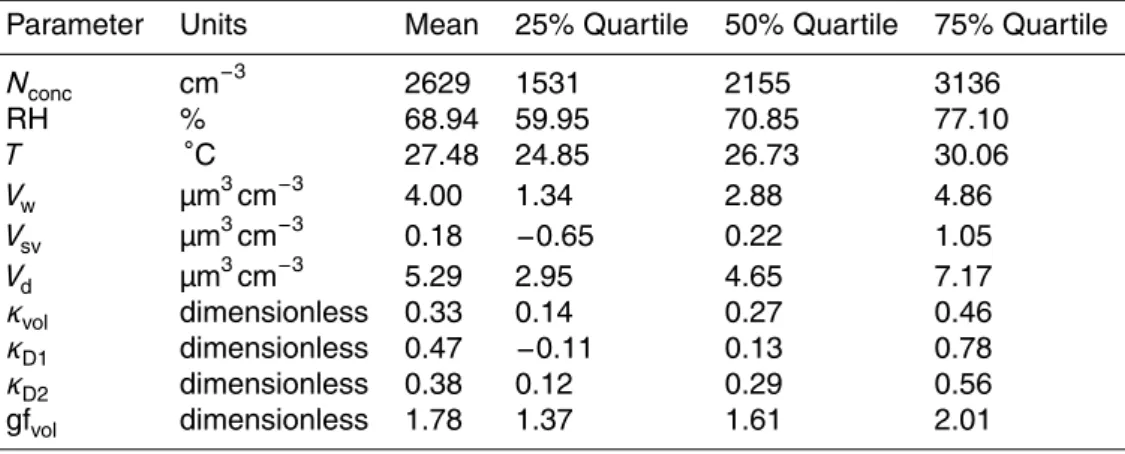
Figure 4 provides a time-series of the measured data for the six weeks of data col-lection. A campaign-based statistical summary of selected quantities is summarized in Tables 1 and 2. Temperatures typically fluctuated between∼24◦C during nighttime and∼30◦C during daytime. Minor fluctuations in the dew point temperature (Tdew)
in-5
dicate that the diel cycle of RH was driven mostly by temperature variations – highest at low temperatures and lowest at high temperatures. Daily fluctuations for RH were typically within 60 % to 77 %. Periods of heavy rainfall included 5–7 June, 18 June, and 3–6 July. The highest amount of precipitation for a single day was 45.8 mm on 6 June. Periods with little to no rainfall included 8 June, 11–12 June, 14–16 June, 19–22 June,
10
25–26 June, and 9–12 July. Periods with noticeably high amounts of rainfall, such as 5 and 6 June, resulted in low levels of dry (Vd) and water aerosol (Vw) volume. During periods with no rainfall, such as the days between 19 and 22 June, dry particle volume steadily increased, presumably due to the lack of an efficient aerosol sink.
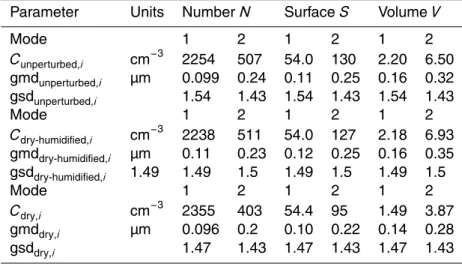
Statistics of the campaign average bimodal distributions of number concentration,
15
surface area, and volume for the three-instrument inlet states are summarized in Ta-ble 2. A graphical interpretation of TaTa-ble 2 is provided in Fig. 5. Average number concentrations were ∼2300 cm−3 and 500 cm−3 for the smaller and larger diameter mode, respectively. Surface area distributions are higher for the unperturbed and dry-humidified states than for the dry state due to the additional water uptake. For the
20
smaller diameter mode, surface areas average at 54.0 µm2cm−3 for both the unper-turbed and dry-humidified states, and 54.4 for the dry state, while for the larger mode, the averages are 130, 127, and 95 µm2cm−3 for the unperturbed, dry-humidified, and dry states respectively. This indicates that water uptake increases the aerosol surface area by 33.7 % for the large diameter mode, while the effect for the small diameter mode
25
ACPD
14, 7469–7516, 2014Trends in particle phase liquid water
T. K. V. Nguyen et al.
Title Page
Abstract Introduction
Conclusions References
Tables Figures
◭ ◮
◭ ◮
Back Close
Full Screen / Esc
Printer-friendly Version Interactive Discussion
Discussion
P
a
per
|
D
iscussion
P
a
per
|
Discussion
P
a
per
|
Discuss
ion
P
a
per
|
the smaller diameter mode and 6.50, 6.93, and 3.87 µm3cm−3 for the larger diameter mode, for the unperturbed, dry-humidified, and dry states, respectively. The observed size distribution statistics are consistent with previous measurements of accumulation mode remote continental aerosol size distributions (Jaenicke, 1993; Martin et al., 2010; Levin et al., 2012). Notably, small particle events indicative of nucleation (Levin et al.,
5
2012) were not observed during the campaign. Number and volume concentrations were significantly higher during SOAS than during the Amazonian Aerosol Characteri-zation Experiment (Martin et al., 2010), suggesting anthropogenic influence, likely from sulfates, on the SOAS site (Carlton and Turpin, 2013). One would expect that the pres-ence of sulfates would result in more hygroscopic aerosol in Alabama compared to the
10
pristine Amazon rainforest.
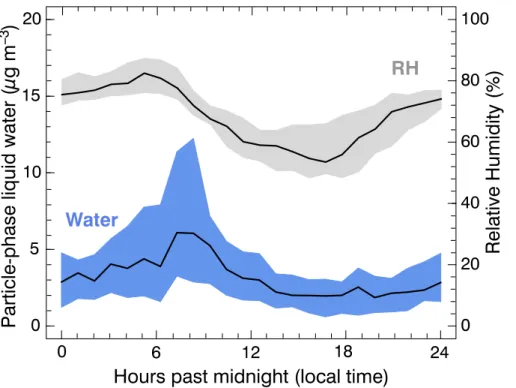
Figure 4 summarizes trends of particle phase liquid water (Vw) throughout the cam-paign. Measured water concentrations always exceeded 0 µg m−3, typically varied be-tween 1 and 5 µg m−3, and peaked at 73 µg m−3on 17 June. The campaign time-series data indicate a strong diel cycle forVw. A campaign-average representation of the diel
15
cycle is presented in Fig. 6. We note that this average diel cycle was suppressed dur-ing periods with heavy washout. Analysis contrastdur-ing selected time periods is provided in Appendix A. Figure 6 shows that water volume peaked during the early morning hours∼07:00 to 09:00 LT. On average, the median value for water concentrations was 2.9 µg m−3, and the interquartile range was between 1.3 and 4.9 µg m−3 (Table 1). For
20
07:00 to 09:00 LT, however, the average median value for water mass concentrations was 5.8 µg m−3. The start of the decreasing transition for RH occurred in the morning at approximately 06:00 LT. The peak in water content occurred shortly after RH decreased and RH continued its decline until it increased again at 16:00 LT. Water mass concen-trations leveled offafter the morning peak, and despite the RH increase after 16:00 LT,
25
ACPD
14, 7469–7516, 2014Trends in particle phase liquid water
T. K. V. Nguyen et al.
Title Page
Abstract Introduction
Conclusions References
Tables Figures
◭ ◮
◭ ◮
Back Close
Full Screen / Esc
Printer-friendly Version Interactive Discussion
Discussion
P
a
per
|
D
iscussion
P
a
per
|
Discussion
P
a
per
|
Discuss
ion
P
a
per
|
The evolution of composition is demonstrated further by the volumetric growth factor data. Figure 7 shows the diurnal profile of gfvoloverlaid with expected gfvolassuming an invariantκ throughout the day. Analysis in the Appendix is performed for a volumetric growth factor profile for a single day as an illustrative example of a day with no rainfall. The data shows that gfvol is always higher than 1, and exceeds 2 between 07:00 and
5
09:00 LT. Overall, the gfvol median is 1.61 (Table 1). The data also show that the ob-served interquartile range for gfvol is between 1.37 and 2.01. These values are similar to those found during the Pittsburgh Air Quality Study (Khlystov et al., 2005). The over-laid expected growth factor for different values ofκin the plot suggest that the aerosol hygroscopicity during the campaign changed systematically throughout the day, which
10
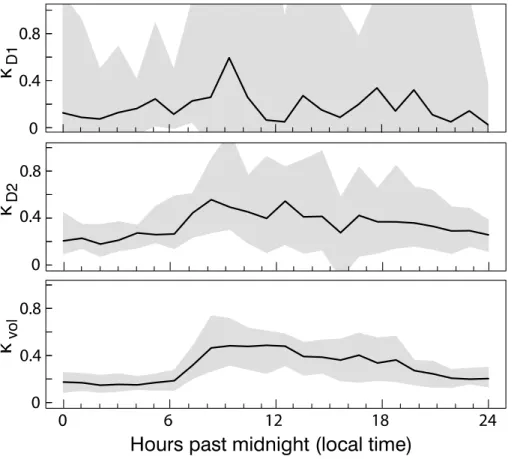
is further explored in the diel cycle ofκvolshown in Fig. 8. Overall, the median observed value forκvol is 0.27 and the interquartile range is from 0.14 to 0.46. At night, κvol is steady at median values of∼0.18 and quartiles of ∼0.08 to 0.3. After 07:00 LT, κvol increases to about a median value of∼0.48 and quartiles of ∼0.2 to 0.7 followed by a gradual decrease throughout the rest of the day. The hygroscopicity statistics for the
15
two size modes are summarized in Table 1. Medians of κ for the smaller and larger diameter mode average toκD1=0.13 andκD2=0.29. In comparison, medians forκvol average to 0.27, which more closely matchesκD2 than κD1. κD1 also exhibits greater variability than either κvol or κD2, which is most likely attributable to noisiness in the fittings on a scan by scan basis that increases variability in the diameter growth factors
20
for the mode.
The measured κvol are consistent with a mix of hygroscopic organic and inorganic compounds (Petters and Kreidenweis, 2007; Kreidenweis et al., 2008; Suda et al., 2012). The observedκvolare significantly larger than those in organic dominated envi-ronments encountered in remote continental forests (Gunthe et al., 2009; Sihto et al.,
25
ACPD
14, 7469–7516, 2014Trends in particle phase liquid water
T. K. V. Nguyen et al.
Title Page
Abstract Introduction
Conclusions References
Tables Figures
◭ ◮
◭ ◮
Back Close
Full Screen / Esc
Printer-friendly Version Interactive Discussion
Discussion
P
a
per
|
D
iscussion
P
a
per
|
Discussion
P
a
per
|
Discuss
ion
P
a
per
|
Results for the diel cycle of the semi-volatile fraction computed from Eqs. (7) and (11) are summarized Fig. 9. No clear diel trend is noticeable. At times the average semi-volatile volume concentration is negative. However, the 95 % confidence interval of the mean consistently envelops zero. This is consistent with the null hypothesis that no semi-volatile partitioning occurs and that the measurement has random error. The data
5
thus indicate that detection of semi-volatiles was not statistically discernible. We note that the confidence limits are∼ ±0.5 µg m−3, which implies that point-to-point variability in the semi-volatile retrieval led to significant uncertainty. Semi-volatile losses less than 0.5 µg m−3may have occurred but were undetectable with our method.
4 Discussion
10
The dynamics governing the total water volume that is available for water-mediated partitioning and condensed aqueous phase reactions are complex. First, our results show that at minimum 7 % of the aerosol volume is composed of water. Day-to-day variations in aerosol hygroscopicity are relatively minor and total water volumes scale with dry aerosol volume and RH. The fractional water content is highest during the
15
early morning hours when temperatures are lowest and RH is at a maximum. During those times volume growth factors exceed two, implying that the aerosol composition is dominated by water. Second, on timescales longer than the diel cycle, dry aerosol volume is the dominant determinant of absolute water content. For example, between 3 and 9 June (Fig. 4), dry aerosol volume increased from 1 to 10 µm3cm−3, with
con-20
comitant increases in water volumes. Dry aerosol volume concentrations result from a balance in production (emissions and secondary production via chemical reactions) and removal (dry deposition, washout, and venting to the free troposphere) processes. The buildup of dry aerosol volume during stagnation events seems to be tied to the meteorological conditions. Warm temperatures, high actinic flux, and absence of deep
25
contin-ACPD
14, 7469–7516, 2014Trends in particle phase liquid water
T. K. V. Nguyen et al.
Title Page
Abstract Introduction
Conclusions References
Tables Figures
◭ ◮
◭ ◮
Back Close
Full Screen / Esc
Printer-friendly Version Interactive Discussion
Discussion
P
a
per
|
D
iscussion
P
a
per
|
Discussion
P
a
per
|
Discuss
ion
P
a
per
|
gent on, suitable weather conditions. Finally, the diel cycle of aerosol hygroscopicity suggests that significant changes in aerosol composition may occur on the time scale of a few hours. Notably, the aerosol is most hygroscopic when the fractional water content is larger. It is some indication that either the aqueous phase itself, or con-ditions that correlate with fractional water content (lower temperature and prolonged
5
absence of photochemistry through the night) can lead to changes in aerosol chemical composition that changeκ by a factor of 3.3 over the timescale of ∼3 h. The diel fluc-tuation inκvol is from 0.14 to 0.46. The overall κvol results from the volume weighted hygroscopicity parameters of the components comprising the mixture. Assuming an approximate effective two component mixture of organic and inorganic species, and
10
assigning κorg∼0.1 (e.g. Levin et al., 2012) and κinorg∼0.6 (sulfate species, Petters and Kreidenweis, 2007) one can estimate the relative organic volume fractions (ǫorg) in the mixture. These areǫorg=0.92 andǫorg=0.28 forκvol=0.14 andκvol=0.46, re-spectively. Volume fractions derived in this manner are not meant to reflect the actual volume fractions in the mixture. The calculations are illustrative to demonstrate that
15
the diel cycle inκvol corresponds to a dramatic change in the constituents comprising the mixture. Figure 10 shows that there was not strong diel profile in dry aerosol vol-ume. Thus the diel changes in aerosol hygroscopicity are indicative of dynamic aerosol chemistry that does not involve major volume changes. One possible explanation for the observed κvol changes are chemical transformations of the organic fraction itself
20
that lead to corresponding changes in κorg. Specifically, κorg has shown to increase with higher oxygen-to-carbon ratio (Jimenez et al., 2009), smaller molecular size (Pet-ters et al., 2009b), and higher solubility in water (Pet(Pet-ters and Kreidenweis, 2008). The presence of an aqueous phase combined with the morning actinic flux could drive aqueous phase oxidation reactions or lead to hydrolysis reactions resulting in smaller,
25
more oxidized, and water-soluble organic molecules or ions.
ACPD
14, 7469–7516, 2014Trends in particle phase liquid water
T. K. V. Nguyen et al.
Title Page
Abstract Introduction
Conclusions References
Tables Figures
◭ ◮
◭ ◮
Back Close
Full Screen / Esc
Printer-friendly Version Interactive Discussion
Discussion
P
a
per
|
D
iscussion
P
a
per
|
Discussion
P
a
per
|
Discuss
ion
P
a
per
|
nitrates. Similar trends ofκ with particle size were observed in previous field studies (Gunthe et al., 2009; Wiedensohler et al., 2009; Levin et al., 2012). A direct conse-quence of the size dependence is that the aqueous phase volume is predominately located with the larger particles sizes both due to the larger dry aerosol volume and the larger hygroscopicity. This initiates the question: of the three parameters influencing
5
particle phase liquid water (dry aerosol volume, hygroscopicity, and RH), which ones are the most important under ambient conditions?
We address this question using sensitivity analysis following the approach of (Fein-gold, 2003; McFiggans et al., 2006). The sensitivity is defined asS(Xi)=∂lnVw/∂lnXi,
whereXi is one ofVd, RH, orκvol. Comparing values ofS(Xi) describes their relative
10
importance given equal perturbationsδVd,δRH, orδκvol. Based on Eq. (1), sensitiv-ities S(κvol) and S(Vd)=1, while S(RH)=1/(1−RH). These sensitivities, combined with values for δXi are summarized in Table 3. The interpretation of S(Xi)=1 is that e.g. a 10 % relative change in parameter Xi will lead to a 10 % relative change
in Vw. Changes in hygroscopicity, dry aerosol volume, and RH are potentially
cross-15
correlated. For example, the condensation of sulfuric acid onto organic aerosol will lead to both increases in κ and Vd, thereby influencing Vw via both pathways. In con-trast, the condensation of nonhygroscopic organic material (i.e.,κ=0) will lead to no increase inVwas the effects of increased volume and decreased hygroscopicity cancel after application of the ZSR mixing rule forκ (Petters and Kreidenweis, 2007). From
20
observations during SOAS, the perturbationsδκ andδVd are comparable, resulting in 0–200 % variability ofVw depending on the hygroscopicity of the compound that con-trols the variability of the dry aerosol volume. Although the relative variability in RH is typically lower thanκorVd, the relative sensitivity of water volume to changes in RH is much larger. At RH=40 %, 70 %, and 90 %,S(RH)=1.66, 3.33, and 10, respectively.
25
ACPD
14, 7469–7516, 2014Trends in particle phase liquid water
T. K. V. Nguyen et al.
Title Page
Abstract Introduction
Conclusions References
Tables Figures
◭ ◮
◭ ◮
Back Close
Full Screen / Esc
Printer-friendly Version Interactive Discussion
Discussion
P
a
per
|
D
iscussion
P
a
per
|
Discussion
P
a
per
|
Discuss
ion
P
a
per
|
et al., 2005). Since dew points are relatively constant during the day at the site location (see Fig. 4), we believe that that the dielVwcycle is indirectly controlled by temperature. Correlations between ambient temperature, relative humidity, and particle phase liquid water can potentially obfuscate the attribution of semi-volatile partitioning into the con-densed phase to either the presence of water due to increased RH or reduced vapor
5
pressure due to reduced temperature. Although this conceptual distinction is important, it is irrelevant for this study because changes in semi-volatile volumesVsvwere not sta-tistically discernible (Fig. 8). An important corollary to this finding is that the method of particle drying used in this study did not lead to detectable removal of material that was associated with the aqueous phase, which would bias observational constraints
10
on predicted cloud droplet number concentration (Topping and McFiggans, 2012). We thus note that particle drying followed by quick processing in the SMPS does not nec-essarily lead to large underestimates of dry aerosol volume. Improved methodology will be needed to further reduce the uncertainty to resolve removal of less than 0.5 µg m−3 amounts, lengthen residence time between the exit of the cold trap and SMPS to
en-15
sure full equilibration, and test whether the conclusion is valid when single particle sizes are considered. Further analyses of semi-volatile measurements are necessary to reduce uncertainties regarding the equilibrium partitioning of semi-volatiles to the aqueous phase.
5 Conclusions
20
We introduced a new technique – semi-volatile differential mobility analysis (SVDMA) – to measure volumes of the three aerosol constituents – dry matter, semi-volatiles, and particle phase liquid water. The instrument was deployed during the SOAS cam-paign at Talladega National Forest in Brent, AL from 3 June to 15 July 2013 to collect six weeks of continuous in situ measurements of ambient aerosols. Aqueous phase
25
dom-ACPD
14, 7469–7516, 2014Trends in particle phase liquid water
T. K. V. Nguyen et al.
Title Page
Abstract Introduction
Conclusions References
Tables Figures
◭ ◮
◭ ◮
Back Close
Full Screen / Esc
Printer-friendly Version Interactive Discussion
Discussion
P
a
per
|
D
iscussion
P
a
per
|
Discussion
P
a
per
|
Discuss
ion
P
a
per
|
inant aerosol constituent from ∼07:00 to 09:00 LT. The diel water-content cycle was dominated by changes in RH, which mostly fluctuated due to changes in temperature. A strong diel cycle in aerosol hygroscopicity indicates that dramatic and systematic changes in aerosol composition occurred on time scales of a few hours. Aerosol hygro-scopicity increased with particle size. The method of particle drying used in this study
5
did not lead to removal of significant material that was associated with the aqueous phase. We conclude that either water-mediated partitioning of semi-volatiles is kineti-cally limited or reversible, or both; or that the effect was smaller than the measurement uncertainty.
Appendix A
10
Conclusions based on campaign-based average diel cycles may be influenced by dif-ferent regimes. To explore the possible influence of averaging we repeat the analysis performed in Fig. 7 for a single day in Fig. A1. Comparing Figs. 7 and A1 suggests that the reported diel trend accurately captures the behavior for a single day. An unusual cold and rainy period occurred between 4 and 8 July 2013. During that time, aerosol
15
volume was low and diel temperature and RH fluctuations were minimal. Figure A2 contrasts the diel cycle for particle phase liquid water for a stagnation event with a pro-nounced diel cycle and the cold period. The data show that no diel cycle was observed during this atypical period, suggesting that conclusions reached about typical regional southeastern US aerosol must be interpreted in the context of the meteorological
set-20
ting.
Acknowledgements. This material is based upon work funded by the National Science Foun-dation grant AGS-1242155. SRS and MDP acknowledge support from the US Department of Energy grant DE-SC0006633. We thank the Atmospheric Administration, Atmospheric Re-search & Analysis, Inc. for providing precipitation data for the SEARCH site, and Eric Edgerton,
25
Elec-ACPD
14, 7469–7516, 2014Trends in particle phase liquid water
T. K. V. Nguyen et al.
Title Page
Abstract Introduction
Conclusions References
Tables Figures
◭ ◮
◭ ◮
Back Close
Full Screen / Esc
Printer-friendly Version Interactive Discussion
Discussion
P
a
per
|
D
iscussion
P
a
per
|
Discussion
P
a
per
|
Discuss
ion
P
a
per
|
tric Power Research Institute, and all of the SOAS participants for their help and support during the SOAS campaign.
References
Asa-Awuku, A., Nenes, A., Gao, S., Flagan, R. C., and Seinfeld, J. H.: Water-soluble SOA from Alkene ozonolysis: composition and droplet activation kinetics inferences from analysis of
5
CCN activity, Atmos. Chem. Phys., 10, 1585–1597, doi:10.5194/acp-10-1585-2010, 2010. Berg, O. H., Swietlicki, E., and Krejci, R.: Hygroscopic growth of aerosol particles in the
marine boundary layer over the Pacific and Southern Oceans during the First Aerosol Characterization Experiment (ACE 1), J. Geophys. Res.-Atmos., 103, 16535–16545, doi:10.1029/97jd02851, 1998.
10
Bilde, M., Svenningsson, B., Monster, J., and Rosenorn, T.: Even-odd alternation of evaporation rates and vapor pressures of C3–C9 dicarboxylic acid aerosols, Environ. Sci. Technol., 37, 1371–1378, doi:10.1021/es0201810, 2003.
Booth, A. M., Barley, M. H., Topping, D. O., McFiggans, G., Garforth, A., and Percival, C. J.: Solid state and sub-cooled liquid vapour pressures of substituted dicarboxylic acids using
15
Knudsen Effusion Mass Spectrometry (KEMS) and Differential Scanning Calorimetry, Atmos. Chem. Phys., 10, 4879–4892, doi:10.5194/acp-10-4879-2010, 2010.
Calvert, J. G., Lazrus, A., Kok, G. L., Heikes, B. G., Walega, J. G., Lind, J., and Cantrell, C. A.: Chemical mechanisms of acid generation in the troposphere, Nature, 317, 27–35, doi:10.1038/317027a0, 1985.
20
Carlton, A. G. and Turpin, B. J.: Particle partitioning potential of organic compounds is highest in the Eastern US and driven by anthropogenic water, Atmos. Chem. Phys., 13, 10203–10214, doi:10.5194/acp-13-10203-2013, 2013.
Carlton, A. G., Wiedinmyer, C., and Kroll, J. H.: A review of Secondary Organic Aerosol (SOA) formation from isoprene, Atmos. Chem. Phys., 9, 4987–5005, doi:10.5194/acp-9-4987-2009,
25
2009.
Carlton, A. G., Pinder, R. W., Bhave, P. V., and Pouliot, G. A.: To what extent can biogenic SOA be controlled?, Environ. Sci. Technol., 44, 3376–3380, doi:10.1021/es903506b, 2010. Chan, M. N., Surratt, J. D., Claeys, M., Edgerton, E. S., Tanner, R. L., Shaw, S. L., Zheng, M.,
Knipping, E. M., Eddingsaas, N. C., Wennberg, P. O., and Seinfeld, J. H.: Characterization
ACPD
14, 7469–7516, 2014Trends in particle phase liquid water
T. K. V. Nguyen et al.
Title Page
Abstract Introduction
Conclusions References
Tables Figures
◭ ◮
◭ ◮
Back Close
Full Screen / Esc
Printer-friendly Version Interactive Discussion
Discussion
P
a
per
|
D
iscussion
P
a
per
|
Discussion
P
a
per
|
Discuss
ion
P
a
per
|
and quantification of isoprene-derived epoxydiols in ambient aerosol in the southeastern United States, Environ. Sci. Technol., 44, 4590–4596, doi:10.1021/es100596b, 2010. Clegg, S. L., Brimblecombe, P., and Wexler, A. S.: Thermodynamic model of the system
H+−NH+4−Na+−SO42−−NO−3−Cl−−H2O at 298.15 K, J. Phys. Chem. A, 102, 2155–2171, doi:10.1021/jp973043j, 1998.
5
Cruz, C. N. and Pandis, S. N.: A study of the ability of pure secondary organic aerosol to act as cloud condensation nuclei, Atmos. Environ., 31, 2205–2214, doi:10.1016/S1352-2310(97)00054-X, 1997.
Dick, W. D., Saxena, P., and McMurry, P. H.: Estimation of water uptake by organic compounds in submicron aerosols measured during the Southeastern Aerosol and Visibility Study, J.
10
Geophys. Res.-Atmos., 105, 1471–1479, doi:10.1029/1999jd901001, 2000.
Ding, X., Zheng, M., Yu, L. P., Zhang, X. L., Weber, R. J., Yan, B., Russell, A. G., Edgerton, E. S., and Wang, X. M.: Spatial and seasonal trends in biogenic secondary organic aerosol tracers and water-soluble organic carbon in the southeastern United States, Environ. Sci. Technol., 42, 5171–5176, doi:10.1021/es7032636, 2008.
15
Engelhart, G. J., Hildebrandt, L., Kostenidou, E., Mihalopoulos, N., Donahue, N. M., and Pandis, S. N.: Water content of aged aerosol, Atmos. Chem. Phys., 11, 911–920, doi:10.5194/acp-11-911-2011, 2011.
Ervens, B., Turpin, B. J., and Weber, R. J.: Secondary organic aerosol formation in cloud droplets and aqueous particles (aqSOA): a review of laboratory, field and model studies,
20
Atmos. Chem. Phys., 11, 11069–11102, doi:10.5194/acp-11-11069-2011, 2011.
Feingold, G.: Modeling of the first indirect effect: analysis of measurement requirements, Geo-phys. Res. Lett., 30, 1997, doi:10.1029/2003gl017967, 2003.
Gunthe, S. S., King, S. M., Rose, D., Chen, Q., Roldin, P., Farmer, D. K., Jimenez, J. L., Artaxo, P., Andreae, M. O., Martin, S. T., and Pöschl, U.: Cloud condensation nuclei in
25
pristine tropical rainforest air of Amazonia: size-resolved measurements and modeling of atmospheric aerosol composition and CCN activity, Atmos. Chem. Phys., 9, 7551–7575, doi:10.5194/acp-9-7551-2009, 2009.
Gysel, M., Weingartner, E., and Baltensperger, U.: Hygroscopicity of aerosol particles at low temperatures. 2. Theoretical and experimental hygroscopic properties of laboratory
gener-30
ACPD
14, 7469–7516, 2014Trends in particle phase liquid water
T. K. V. Nguyen et al.
Title Page
Abstract Introduction
Conclusions References
Tables Figures
◭ ◮
◭ ◮
Back Close
Full Screen / Esc
Printer-friendly Version Interactive Discussion
Discussion
P
a
per
|
D
iscussion
P
a
per
|
Discussion
P
a
per
|
Discuss
ion
P
a
per
|
Gysel, M., McFiggans, G. B., and Coe, H.: Inversion of tandem differential mobility analyser (TDMA) measurements, J. Aerosol Sci., 40, 134–151, doi:10.1016/j.jaerosci.2008.07.013, 2009.
Hallquist, M., Wenger, J. C., Baltensperger, U., Rudich, Y., Simpson, D., Claeys, M., Dom-men, J., Donahue, N. M., George, C., Goldstein, A. H., Hamilton, J. F., Herrmann, H., Hoff
-5
mann, T., Iinuma, Y., Jang, M., Jenkin, M. E., Jimenez, J. L., Kiendler-Scharr, A., Maen-haut, W., McFiggans, G., Mentel, Th. F., Monod, A., Prévôt, A. S. H., Seinfeld, J. H., Sur-ratt, J. D., Szmigielski, R., and Wildt, J.: The formation, properties and impact of sec-ondary organic aerosol: current and emerging issues, Atmos. Chem. Phys., 9, 5155–5236, doi:10.5194/acp-9-5155-2009, 2009.
10
Hatch, L. E., Creamean, J. M., Ault, A. P., Surratt, J. D., Chan, M. N., Seinfeld, J. H., Edgerton, E. S., Su, Y., and Prather, K. A.: Measurements of isoprene-derived organosul-fates in ambient aerosols by aerosol time-of-flight mass spectrometry – Part 1: Sin-gle particle atmospheric observations in Atlanta, Environ. Sci. Technol., 45, 5105–5111, doi:10.1021/es103944a, 2011.
15
Hatch, T. and Choate, S. P.: Statistical description of the size properties of non uniform particu-late substances, J. Frankl. Inst., 207, 369–387, doi:10.1016/S0016-0032(29)91451-4, 1929. Hegg, D. A., Covert, D. S., and Jonsson, H. H.: Measurements of size-resolved hygroscopicity
in the California coastal zone, Atmos. Chem. Phys., 8, 7193–7203, doi:10.5194/acp-8-7193-2008, 2008.
20
Hoyle, C. R., Boy, M., Donahue, N. M., Fry, J. L., Glasius, M., Guenther, A., Hallar, A. G., HuffHartz, K., Petters, M. D., Petäjä, T., Rosenoern, T., and Sullivan, A. P.: A review of the anthropogenic influence on biogenic secondary organic aerosol, Atmos. Chem. Phys., 11, 321–343, doi:10.5194/acp-11-321-2011, 2011.
Jaenicke, R.: Tropospheric aerosols, in: Aerosol-Cloud-Climate Interactions, edited by:
25
Hobbs, P. V., Academic Press, San Diego, CA, 1–31, 1993.
Jimenez, J. L., Canagaratna, M. R., Donahue, N. M., Prevot, A. S. H., Zhang, Q., Kroll, J. H., DeCarlo, P. F., Allan, J. D., Coe, H., Ng, N. L., Aiken, A. C., Docherty, K. S., Ulbrich, I. M., Grieshop, A. P., Robinson, A. L., Duplissy, J., Smith, J. D., Wilson, K. R., Lanz, V. A., Hueglin, C., Sun, Y. L., Tian, J., Laaksonen, A., Raatikainen, T., Rautiainen, J.,
Vaatto-30