UNIVERSIDADE FEDERAL DO CEARÁ CENTRO DE TECNOLOGIA
DEPARTAMENTO DE ENGENHARIA QUÍMICA
PROGRAMA DE PÓS-GRADUAÇÃO EM ENGENHARIA QUÍMICA
KLÉVER SANTIAGO SÁNCHEZ ZAMBRANO
MICROCALORIMETRIC STUDY OF FUNCTIONALIZED MESOPOROUS SILICAS FOR CO2 CAPTURE UNDER DRY CONDITIONS
MICROCALORIMETRIC STUDY OF FUNCTIONALIZED MESOPOROUS SILICAS
FOR CO2 CAPTURE UNDER DRY CONDITIONS
Dissertação apresentada ao Programa de Pós-Graduação em Engenharia Química da Universidade Federal do Ceará, como requisito parcial à obtenção do título de Mestre em Engenharia Química Área de concentração: Processos de separação químicos e bioquímicos.
Orientadora: Profª. Diana Cristina Silva de Azevedo
Coorientadora: Drª. Débora Aline Soares Maia Coorientador: Dr. Enrique Vilarrasa Garcia
MICROCALORIMETRIC STUDY OF FUNCTIONALIZED MESOPOROUS SILICAS
FOR CO2 CAPTURE UNDER DRY CONDITIONS
Dissertation submitted to Universidade Federal do Ceará as a requirement to obtain the Master’s Degree in Chemical Engineering. Concentration area: Chemical and biological separation processes.
Approved on 23 February 2018
________________________________________
Profª. Dra. Diana Cristina Silva de Azevedo Universidade Federal do Ceará
________________________________________
Prof. Dr. Célio Loureiro Calvacante Júnior Universidade Federal do Ceará
________________________________________
A mi familia y amigos en Ecuador, en especial para mi madre que siempre me apoyo en la decisión de viajar a Brasil y fue fuerte para afrontar momentos difíciles.
A la Organización de Estados Americanos (OEA) y al Conselho Nacional de Desenvolvimiento Científico e Tecnológico (CNPq), por la concesión de la beca otorgada que me permitió desenvolver este trabajo de conclusión de maestrado.
A la Universidad Federal de Ceará de manera especial al programa de post graduación en Ingeniería Química, a sus profesores por la formación en estos dos años de adquisición de nuevos conocimientos y habilidades para desarrollar este trabajo.
A la Profesora Dra. Diana Cristina Silva de Azevedo excelente académica de reconocimiento internacional por la gran confianza depositada y por su apoyo desde el inicio de este trabajo de grado como orientadora.
A los profesores Moisés y Eurico por su disposición ante dudas presentadas en el desarrollo de este trabajo.
A mis Co-orientadores Doctores Débora Soares y Enrique Vilarrasa además de a la Post doctoranda Karine Moura por toda las guías prestadas en la realización experimental y en la discusión de resultados.
A todos mis compañeros del Grupo de Pesquisa em Separações por Adsorção (GPSA) por la ayuda desde el momento que comencé, en especial para Enrique Vilarrasa que asumió mi Co-orientación de manera desinteresada y se portó como amigo brindándome ayuda y consejos cuando los necesite.
A la Universidad de Málaga y a la Universidad Estatal de Campinas por la ayuda en la realización de algunos experimentos valiosos para este trabajo.
“So now you'd better stop and rebuild all your ruins. For peace and trust can win the day despite of all your losing”
A adsorção de CO2 em sílica mesoporosa funcionalizada foi estudada usando microcalorimetria, a fim de investigar a influência do aumento da densidade de amina ancorada e do tipo de funcionalização no mecanismo de captura de CO2. Um microcalorímetro Tian-Calvet acoplado a um sistema manométrico foi utilizado para avaliar a distribuição de sítios energéticos de adsorção e calcular o parâmetro termocinético a partir das curvas de entalpia diferencial de adsorção. As isotermas de equilíbrio de adsorção de CO2 até 1 bar também foram medidas a 25 °C para todas as amostras conhecendo qual material funcionalizado tem a maior capacidade de adsorção de CO2 e comparando com uma amostra duplo funcionalizada no cenário pós-combustão. Além disso, ciclos de adsorção-dessorção foram realizados a 25 e 50 ° C e isotermas de mistura de CO2 / N2 a 50 e 75 ° C até 10 bar. O estudo microcalorimétrico sugere uma mudança na distribuição de sítios ativos à medida que aumenta a densidade de aminas ancorada. O parâmetro termocinético máximo foi calculado para as amostras; 471 segundos para a sílica pura em 30,7 kJmol-1sugere que fisissorção é o mecanismo dominante. Um comportamento diferente foi observado para as amostras ancoradas, que apresentaram valores de entalpia de adsorção maiores, correspondentes à formação de produtos intermédiários (CO2 quimissorvido), que dependem da densidade de amina ancorada e dos grupos silanóis disponíveis. Os resultados mostraram que a amostra MSG60, escolhida entre as amostras enxertadas, poderia ser regenerado com sucesso a 120 °C, mantendo uma capacidade de adsorção constante para 3 ciclos de adsorção-dessorção usando vácuo molecular a 50 °C. A amostra dupla funcionalizada apresentou as mesmas boas características e também apresentou o parâmetro API para o processo pós-combustão superior a amostra MSG60; portanto, esse tipo de funcionalização provavelmente seria mais apropriado para esse processo em condições de CO2 seca.
CO2 adsorption on functionalized mesoporous silica was studied by microcalorimetry in order to investigate the influence of increasing the density of grafted amine and the type of functionalization on the CO2 capture mechanism. A Tian-Calvet microcalorimeter coupled to a manometric setup was used to evaluate the energy distribution of adsorption sites and calculate the thermokinetic parameters from the differential adsorption enthalpy curves. CO2 equilibrium adsorption isotherms were also measured at 25 °C for all samples up to 1 bar in order to know which grafted material has the highest CO2 adsorption capacity at 25°C contrasting it with a sample double functionalized in post-combustion scenario. Besides that, adsorption-desorption cycles were performed at 25 and 50°C and binary CO2/N2 isotherms at 50 and 75°C up to 10 bar. The adsorption calorimetric study suggests a change in active sites distribution as the density of grafted amines increases. The maximum thermokinetic parameter was calculated for the samples; 471 seconds for the pure silica at 30.7 kJmol -1suggests that physisorption is the dominant binding mechanism. A different behavior occurs with the grafted samples, which have considerably higher enthalpy values corresponding to the formation of intermediate products (chemisorbed CO2), which depend on grafted amine density and available free surface silanols. The MSG60, chosen among the grafted samples, could be successfully regenerated at 120 °C, maintaining a constant adsorption capacity for 3 adsorption–desorption cycles using molecular vacuum at 50°C. The sample double functionalized presented these same good characteristics and also presented the API parameter for post-combustion process higher than MSG60; therefore, this type of functionalization probably would be more appropriate for this process under dry condition.
Figure 1 Shares of global anthropogenic GHG, 2010………..……15
Figure 2 Adsorption system components ………...19
Figure 3 Schematic diagram of an adsorption microcalorimeter….………24
Figure 4 Classification of calorimetric curves.……….………...26
Figure 5 Tian- Calvet calorimeter cell representation………..28
Figure 6 Thermogram with the representation of the noise level and base line…………...29
Figure 7 Amines density on functionalized samples and MTAC……….31
Figure 8 Schematic of primary, secondary, and tertiary amino-silane compounds impregnated on SBA-15 and their nomenclature……….………...33 Figure 9 Synthesis MSS flowchart …...……….. 36
Figure 10 Grafting and Impregnation process flowchart…..……….37
Figure 11 Chemical composition of silica surface.………..………..………72
Figure 12 Internal thermocouple configuration Internal thermocouple configuration …….43 Figure 13 Microcalorimeter and Manometric system configuration ………44
Figure 14 Thermogram example of the adsorption-desorption process ………48
Figure 15 Magnetic suspension balance ………50
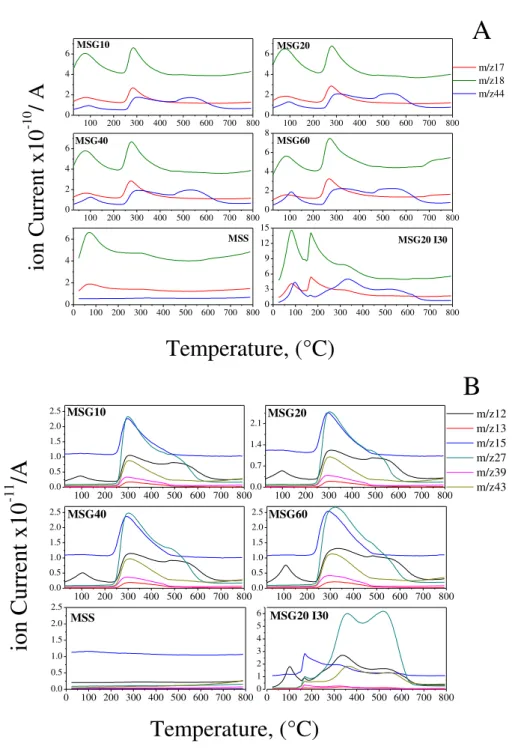
Figure 16 Thermogravimetric curves (A) TGA (B) DTGA………..……….53
Figure 17 Mass charge ratio distribution measured by TGA ………55
Figure 18 N2 Isotherms at -196°C, open symbols represent desorption branch………56
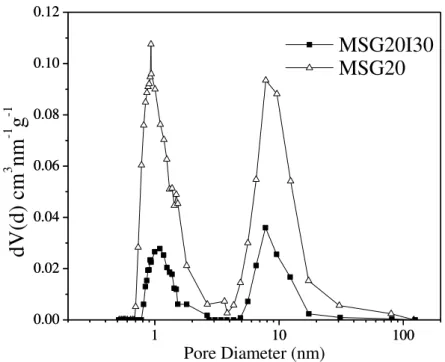
Figure 19 Pore Size Distributions (PSD's) to MSS and MSG materials………58
Figure 20 Pore size distributions (PSD's) to MSG20 and MSG20I30………..59
Figure 21 XRD patterns of all silica mesoporous samples………60
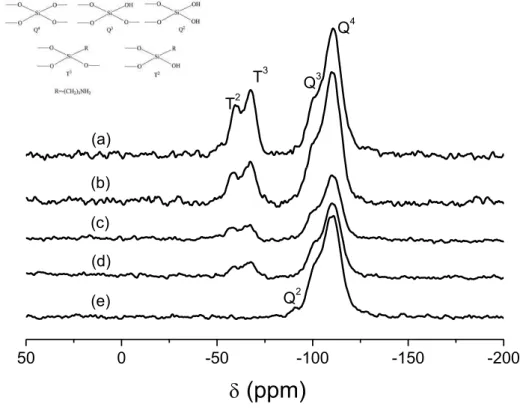
Figure 22 29Si Chemical Shift to (a) MSG60 (b) MSG40 (c) MSG20 (d) MSG10 and (e) MSS samples………..62
Figure 23 Deconvolution 29Si chemical shift signal to mesoporous silica studied………..63
Figure 24 Differential enthalpy of adsorption in function of CO2 uptake for mesoporous silica samples……….65
Figure 25 Energy site distribution plots for mesoporous silica samples………..66
function of amine density (1) propylammonium propylcarbamate, (2) H-bound carbamic acid to propylammonium propylcarbamate ion pair, (3) H-bound carbamic acid to surface silanols group (Q2, Q3), (4) H-bound carbamic acid to residual silanols group (T2), (5) silyl propylcarbamate on propylamine modified
silicas when subjected to dry CO2, (6) CO2/OH- interaction………..68
Figure 28 Thermokinetic Parameter as a function of adsorbed CO2………...…..69
Figure 29 Energy sites distribution for all samples studied……….…..70
Figure 30 CO2 isotherms at 25 °C for mesoporous materials………73
Figure 31 (a) thermogram (at 25 °C) for CO2 adsorption on MSG60 for four rounds.(b) Corresponding CO2 adsorption isotherms and (c) Differential enthalpies of CO2 adsorption (at 25 °C) for the four rounds of adsorption on the same MSG60 sample………75
Figure 32 (a) thermogram (at 25 °C) for CO2 adsorption on MSG20I30 for three rounds. (b) Corresponding CO2 adsorption isotherms and (c) Differential enthalpies of CO2 adsorption (at 25 °C) for the three rounds of adsorption on the same MSG20I30 sample………..75
Figure 33 (a) thermogram (at 50 °C) for CO2 adsorption on MSG60 for three rounds. (b) Corresponding CO2 adsorption isotherms and (c) Differential enthalpies of CO2 adsorption (at 50 °C) for the three rounds of adsorption on the same MSG60 sample………..76
Figure 34 (a) thermogram (at 50 °C) for CO2 adsorption on MSG20I30 for three rounds. (b) Corresponding CO2 adsorption isotherms and (c) Differential enthalpies of CO2 adsorption (at 50 °C) for the three rounds of adsorption on the same MSG20I30 sample……….76
Figure 35 CO2 Adsorption Isotherms with regeneration temperature in addition to molecular vacuum, for MSG60 at 80°C and MSG20I30 at 92°C………..………….77
Figure 36 Single CO2 and N2 isotherms at 50 and 75 °C for MSG 60………..….78
Figure 37 Single CO2 and N2 isotherms at 50 and 75 °C for MSG20I30….………...79
Figure 38 Binary Isotherms (0.15 CO2 and 0.85 N2) at 50°C for MSG60 and MSG20I30, continuous lines is the fitting with the dual site Langmuir extended model……..81
Table 1 Characteristics of the gases used as adsorbates………..…35
Table 2 Mass loss of all samples with increasing temperature………...53
Table 3 Mass charge (m/z), fragments and their corresponding molecular ions…………56
Table 4 Textural characteristic calculated from N2 isotherms………...57
Table 5 Comparison between surface area results after and before functionalization of some mesoporous silica………..58
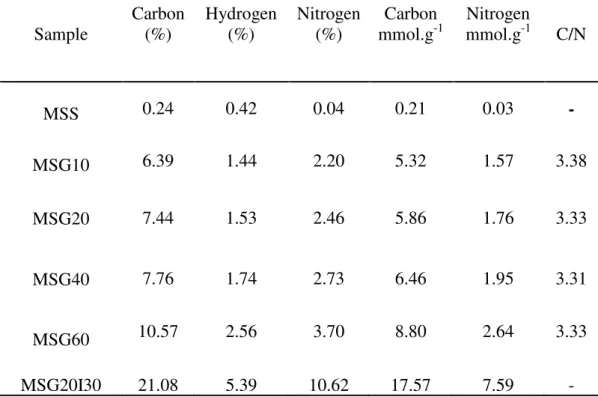
Table 6 Elemental analysis of the samples studied……….61
Table 7 Amines density on functionalized samples and MTAC……….61
Table 8 29Si MAS NMR peak integration for studied mesoporous silica………...63
Table 9 Molar percentages of silanols and R group contrast with the percentage of APTES coverage obtained from 29Si NMR analysis……….64
Table 10 Distribution of active sites and maximum thermokinetic parameter relate to percentage of APTES coverage……….71
Table 11 Outgassing heat requirement and required temperature with 2.5 hours of molecular vacuum at 25 °C………72
Table 12 DSL fitting parameters to the experimental data at 25 ° C………73
Table 13 Adsorption/desorption energy (overnight) at 25°C and calculated temperature to outgassing of MSG60 and MSG20I30………...77
Table 14 CO2 Dual site Langmuir model parameters for MSG60 and MSG20I30………..80
Table 15 N2 Langmuir model parameters for MSG60 and MSG20I30………80
Table 16 Comparison of adsorption capacity of MSG60 and MSG20I30 with others similar ones found in the literature……….81
Table 17 Adsorption Working Capacities (0.02—1 bar) for CO2……….83
API Adsorbent performance indicator APTES (3-Aminopropyl) triethoxysilane
BET Brunauer-Emmett-Teller method
BJH Barrett, Joyner and Halenda method
DR Dubinin-Radushkevich method
DSL Dual site Langmuir model
DTGA Derivative temperature gravimetric analysis
GHC Greenhouse gases
HCl Chlorhydric acid
IEA International Energy Agency
IR Infrared
LM Langmuir model
MAS NMR Magic-Angle Spinning Nuclear Magnetic resonance
MOF Metal-organic framework
MREL Multi region extended Lagmuir
MTAC Maximum theoretical adsorption capacity by chemisorption
PD 4-amino-2-hydroxy-6-methylpyrimidine
PEI Propyl Ethyl imine
PSA Pressure swing adsorption
PSD Pore size distribution
PZ Piperazine
P123 Pluronic 123
TEOS Tetraethylorthosilicate
TEPA Tetraethylenepentamine
TSA Temperature swing adsorption
VSA Vacuum swing adsorption
WC Working Capacity
1 INTRODUCTION ... 15
2 LITERATURE REVIEW ... 18
2.1 Fundaments of adsorption of gases ... 18
2.2 Adsorption microcalorimetry ... 20
2.2.1 Energy of Adsorption ... 21
2.2.2 Computation of enthalpy adsorption... 22
2.2.3 Classification of calorimetric curves.... 26
2.2.4 Tian-Calvet microcalorimeter ... 27
2.3 Ordered mesoporous silicas ... 30
2.3.1 SBA-15 family ... 30
3 EXPERIMENTAL... 35
3.1 Materials ... 35
3.1.1 Gases……….. ... 35
3.1.2 Adsorbents ... 35
3.1.2.1 Synthesis of mesoporous silica ... 35
3.1.2.2 Grafting with APTES ... 36
3.1.2.3 Impregnation with poly ethyl imine (PEI) ... 36
3.2 Methods ... 37
3.2.1 Adsorbents characterization ... 37
3.2.1.1 Textural Characterization ... 37
3.2.1.2 X-ray diffraction (XRD) ... 40
3.2.1.3 Elemental Analysis ... 40
3.2.1.4 29Si NMR Nuclear magnetic resonance ... 41
3.2.1.5 Thermogravimetric analysis ... 43
3.2.2 Adsorption Microcalorimetric experiments ... 43
3.2.2.3 Energy consumption between adsorption cycles ... 47
3.2.2.4 Sites Energy Distribution ... 48
3.2.3 Adsorption equilibrium ... 49
3.2.3.1 Equilibrium isotherms of gas mixture at high pressures ... 49
3.2.4 Equilibrium models ... 50
3.2.5 Selectivity... 51
3.2.6 Working capacity ... 52
3.2.7 Adsorbent Performance Indicator – API ... 52
4 RESULTS AND DISCUSSION ... 53
4.1 Thermogravimetric analysis ... 53
4.2 Textural Characterization ... 56
4.3 X-ray Diffraction (XRD) ... 59
4.4 Elemental Analysis ... 60
4.5 Resonance Magnetic Nuclear 29Si RMN ... 62
4.6 Adsorption Microcalorimetric Experiments ... 65
4.7 Stability and energy consumption between adsorption cycles ... 74
4.8 CO2 / N2 and binaryisotherms at high pressure ... 78
4.9 Selectivity ... 82
4.10 Working capacity ... 82
4.11 Adsorbent Performance Indicator – API ... 83
5 CONCLUSIONS ... 85
1. INTRODUCTION
In recent years, the concern for climate change has grown. Several factors like global warming and natural disasters have led governments to discuss this issue.
The causes of these changes have been extensively studied, mainly the so-called greenhouse effect. Kiehl and Trenberth1 studied the impact of all greenhouse gases in the atmosphere, and found that CO2 was the second gas with the highest impact in radiation force, only surpassed by water vapor.
The high share of fossil fuels in the world energy matrix has intensified the concentration of carbon dioxide in the atmosphere. The production of CO2 is one of the topics of most concern in the scientific community in the environmental field, especially in the production of energy, where alternative sources have had a significant development. According to the IEA (International Energy Agency), the 2015 report, entitled “CO2 Emissions from fuel combustion”, showed that the energy production is responsible for 68% of the total production of anthropogenic gases. CO2 accounts for 90% of this percentage as shown in the Figure 1
Figure 1 Shares of global anthropogenic GHG, 2010.
Source: IEA estimates for CO2 from fuel combustion, 20152.
specific functional groups without hindering CO2 diffusion and with high mechanic and thermal stability. Recently, these materials have been functionalized with amine groups, attracting the attention of scientists, due to enhanced CO2 adsorption capacity, lower heat capacity in contrast with amine liquids, as well as less equipment corrosion8. It means less energy required to outgas CO2. Thus, functionalized materials have gained attention in adsorption research.
Lately, adsorption microcalorimetry has been used to study catalysts surface and its adsorption properties, as well as the interaction mechanism between several solids and gases9–12. Adsorption microcalorimetry is a very helpful tool to evaluate the type and amount of available active sites and understand the process mechanism under dry or moist conditions.
Moreover, it is necessary to study the adsorption stability of these materials under post-combustion conditions. It means successive cycles of work, at temperatures around 50-80°C and under the pressures range of 0−1 bar. The results would aim to contrast between different strategies of functionalization to improve the synthesis and obtain better adsorption efficiency.
These studies have been complemented with Si 29NMR (Nuclear Magnetic Resonance), which allows us to determine the distribution of Si-OH groups on the solid surface. Such data provides important insights into the mechanisms involved during CO2 adsorption.
The results of this work may be used as a guide to synthesize more efficient adsorbents, while the collected data provides new understandings of the mechanism and kinetics of CO2 adsorption process at medium and high amine surface loadings.
1.1 Objectives
The main objective of this work is to evaluate mesoporous silica samples under different strategies of functionalization leading different densities of nitrogen surface groups and compare the two most promising materials for CO2 capture in a post-combustion scenario. Therefore, the specific objectives are:
a) Synthesize mesoporous silica and functionalize them with different loadings of amine groups, using APTES for grafting and PEI for impregnation;
functionalized materials respect to CO2 adsorption as compared to the pure sample and thus obtain information about the equilibrium, kinetics and adsorption mechanisms. From this point, select the two samples with better performance regarding the aforementioned properties;
d) Verify the reversibility in adsorption cycles with and without increase in temperature and estimate the energy consumption in post-combustion conditions for the two materials with highest CO2 uptakes;
e) Measure high pressure adsorption equilibrium data for pure components CO2 and N2 at 50 and 75 °C and for gas mixture consisting of CO2/ N2 (15/85 v/v) for the two previously selected materials;
2. LITERATURE REVIEW
2.1. Fundaments of adsorption of gases
Adsorption is a natural and exothermic phenomenon which takes place when molecules of a fluid are electrostatically attracted and retained on the surface of a solid when they are in contact. This phenomenon creates a film of molecules on the surface that are capable of generating force fields and attract molecules on its environs.
This phenomenon occurs whenever a solid surface is in contact with a fluid, and it is defined as the enrichment of material or increase in the density of the fluid in the zone of an interface13. Under certain conditions, there is a remarkable enhancement in the concentration of a particular component and the overall effect is then dependent on the extent of the interfacial area13. According to the nature of the forces that govern the phenomenon, we can classify it as physical (physisorption) or chemical (chemisorption). In physisorption the intermolecular forces involved are similar to the energy leading to the non-ideal behavior of gases and the condensation of vapors. In addition to the attractive dispersion forces and the short range repulsive forces, usually occur as a result of particular geometric and electronic properties of the fluid and solid14. In chemisorption, the intermolecular forces involved in the process lead to the formation of chemical bonds.
Currently, adsorption has been applied as a technological process of great importance. Thus, some adsorbents are commonly used as catalysts or catalyst supports, desiccants; others are used for the separation of light gases- in cases where adsorption has advantages over distillation15, in the purification of pollution industrial discharge and even in stages of biological mechanisms like enzymatic immobilization16.
Gas adsorption is now a widely used procedure for determining the surface area and pore size distribution of a diverse range of porous materials17. These data are determinant for the selection of type, size and number of adsorption columns at given gas feed, product specifications and environmental conditions, among others.
Figure 2 Adsorption system components
Source: Modified Keller and Staudt, 2005.18
Adsorptive is the fluid; gas or liquid which some molecules interact with the surface of the adsorbent without these being retained on the solid surface. Figure 2 shows an illustration of the adsorption phenomena on a porous solid in contact with a mixture of two adsorptive gases. The fluid is called adsorbate when its molecules are adsorbed on the surface of an (often porous) solid material18.
Porous solids possess various surface groups and irregularities (surface heterogeneity), as well as fine pores of different sizes and shapes (structural heterogeneity). Thus pores are classified according their width, which represents either the diameter of a cylindrical pore, or the distance between the sides of a slit-shaped pore. The International Union of Pure and Applied Chemistry (IUPAC) proposed the following classification: pores with widths exceeding about 50 nm (500 Å) are called macropores, pores of widths between 2 nm and 50 nm are called mesopores and pores with widths less than 2 nm are called micropores14.
In the procedures for synthesizing porous solids it is necessary to control the various process variables involved, such as carbonization, temperature, type and concentration of functional groups, these activation parameters determinant of the chemical and physical properties of adsorbents. Many research groups around the world like Bastos-Neto et al.19 Prauchner et al.20 Castrillon et al.21have been concerned in enhance of materials porous due to several applications that these may have.
pore diameter, pore size distribution, heats of adsorption are necessary to precisely determine the parameters that characterize these materials22.
Adsorption is described through isotherms, functions connecting the amount of adsorbate taken up by the adsorbent (or the change of any other physical parameter related to the adsorption of matter) with the adsorptive equilibrium pressure, the temperature and all parameters being constant23. It is like the fingerprint of the solid in interaction with the fluid in equilibrium. The result of this test is known as adsorption isotherm, and it represents the adsorption equilibrium which can be measured by different methods.
A novel classification of the adsorption isotherms was presented by Thommes et al,14 with new characteristic types of isotherms identified and found to be closely related to particular pore structures, compared to the last classification showed in 198517. For more details of this topic, the reader could consult this work.
2.2. Adsorption microcalorimetry
Adsorption microcalorimetry has its origin with Pierre Antoine Favre in 1854. He development a calorimeter to measure for first time adsorption heats of gases on solids. Nowadays, it has been applied to the study of adsorption and catalysis11,24.
The determination of heat of adsorption is essential in the description of gas solid energy interactions. The term “heat of adsorption” is discouraged since it does not correspond to any well-defined thermodynamic change of state, but several authors give that name to this energetic property, being commonly used the term “adsorption enthalpy” in the scientific community.
With this data one can get a better understanding of the behavior of the gas- solid interaction, and adsorption microcalorimetry is the technique that studies these thermal effects that can be simplified as heat.
The energetic information obtained provides supplementary resolution with respect to manometry adsorption and is complementary to other structural and/or diffusion studies28. It is a readily accepted fact that surface heterogeneity leads to a heterogeneous population of active sites on the surface of a solid adsorbent previously functionalized or a catalyst. Thanks to the improved sensitivity of calorimeters and to the development of refined data analysis techniques, adsorption calorimetry can make a significant contribution to the characterization of a solid surface.29 It is very often discussed but very seldom taken into account in practical cases, simply because there are very few tools with which to study the heterogeneity if active sites in solid.
The adsorption of at least one reactant is the first step of the mechanism of any catalytic reaction. This step is followed by surface interactions between adsorbed species or between a gaseous reactant and adsorbed species. In many cases, these interactions may be detected by the successive adsorptions of the reactants in different sequences. Heat-flow microcalorimetry can be used with profit for such studies.30
However the technique also has some limitations, it is often difficult to determine the nature of the adsorbed species, or even to distinguish between the different kinds of products formed for chemisorption from the calorimeter data. In many cases this technique fails to distinguish between cations and protonic sites due to the insufficient selectivity of the adsorption. For example in catalysis can make it difficult in some cases to discriminate Lewis and Brönsted sites solely by adsorption microcalorimetry because the different enthalpies of NH3 adsorption on these sites are relatively close to each other. Because no exact information can be obtained regarding the nature of the acid centers from calorimetry measurements, suitable IR, MAS NMR and/or XPS investigations are necessary to identify these sites.31
2.2.1. Energy of Adsorption
If we assume that the adsorption systems are well characterized and that the experimental measurements are made under carefully controlled conditions, energy of adsorption data can provide valuable information concerning the process mechanism whatever the nature of the interactions is: strong surface interactions (physisorption) or chemical interactions (chemisorption).
the adsorption energy was proposed by Barrer 32, at very low surface coverage in the form of the sum shown in Equation 1.
E0 = ED+ ER+ EP+ EFμ+ 𝐸𝐹𝑄̇ (1) In which: ED represents the dispersion energy characterized by London33 and ER represents the repulsion energy, both contributions known as non-specific and various type of additional specific interactions can contribute to the adsorption energy such as the polarization energy EP that takes place for every adsorbate/adsorbent system as a result of the proximity from electric field between adsorbent and the adsorbate -the dipole field EFμ- and the energy quadrupole gradient field 𝐸𝐹𝑄̇32and the adsorption energy is the sum of these energy terms taking place between all atoms of both adsorbate and adsorbent. There are a few adsorbents which give rise to essentially non-specific interactions with a wide range of different adsorptive in which polarity and specific contributions have a minimum effect. One of the most popular is the graphitized carbon black which is a non-porous adsorbent and its uniform state has a surface structure composed almost entirely of the graphitic basal planes. Several studies show a strong impact of the non-specific contributions. Already in 1990 results was obtained for Ludwing and Schmidt34, therefore there is evidence to confirm the essentially non-specific nature of the interactions between the surface of graphitized carbon and all types of gas molecules.
The scenario is different when a polar molecule is adsorbed on an ionic or a polar adsorbent surface. Studies with n-hexane and benzene demonstrated the effects of the specific contributions on the interaction energy at low surfaces for the benzene with ionic or polar surfaces, as did Kiselev35 evidencing it with hydroxylated silica and Belyakova et al.36 with barium sulphate as adsorbent materials; hence, the adsorption energy is directly dependent on the nature of the adsorbent/adsorbate system. Thus, to avoid confusion, we can rewrite as is shown in Equation 2 so that
E0 = ESC+ ENSC (2)
suggests that the differential enthalpy changes significantly with an increase in the surface coverage, whereas in other cases the change can be much smaller. In fact, the increase in the differential enthalpy of adsorption, usually observed for an energetically homogeneous adsorbent surface. It is likely due to the attractive interactions between adsorbed molecules which become more relevant when the population in the monolayer increases or when micropore filling approaches completion. According to the ideal Langmuir model the heat of adsorption should be independent of coverage, but this requirement is seldom fulfilled in real systems because the effects of surface heterogeneity and adsorbate-adsorbate interactions are generally significant15. The progressive decrease in the differential enthalpy is generally expected if the adsorbent surface is energetically heterogeneous as was studied by Furlong et al.37 andGrillet et al.38 with rutile and graphitized carbon respectively. A quasi plane profile for the differential enthalpy is often related to the interactions between the adsorbate and a mildly energetically heterogeneous adsorbent surface, the significant decrease in the adsorbent–adsorbate interactions being almost exactly balanced by an increase in the lateral adsorbate–adsorbate interactions13.
Adsorption is a spontaneous and exothermic process. The adsorption Gibbs energy and the adsorption enthalpy are then negative. As the molecules are adsorbed in micropores and bond to the solid by physical or chemical interactions, they lose degrees freedom. The adsorbate forms a phase, which is more ordered compared to the gas phase. Therefore the adsorption entropy is negative too. Thus the sign of the Gibbs energy depends on the enthalpic term which is always negative and the entropic term which is positive according Equation 3:
∆𝑟𝐺𝑎 = ∆𝑟𝐻𝑎− 𝑇∆𝑟𝑆𝑎 ((4))
where ∆𝑟𝐺𝑎 is the energy Gibbs in adsorption, ∆
𝑟𝐻𝑎 is the adsorption enthalpy and ∆𝑟𝑆𝑎 the entropy adsorption to constant temperature T.
Complementary studies of the energetics of physisorption can be explored using considerations in molecular simulations that, with the aid of fast computing facilities, are nowadays intensively employed as numerical experiments to clarify, together with the microcalorimetric profile, the forecasts of the adsorption mechanism at the microscopic scale or the adsorption properties of a wide range of solids. The latter point is very helpful for narrowing down the choices of promising adsorbents for some adsorption/separation applications, which will need further experimental investigations.
2.2.2 Computation of enthalpy adsorption
In this section we present the thermodynamic models39 that help us process and interpret the calorimetric data. The isosteric method, in which the adsorption enthalpies are calculated from information, obtained of at least three adsorption isotherms at different temperatures, so that this is an indirect method. Furthermore, there are the direct methods that make use of a manometric system adapted to a calorimeter to measure the generated heat in a continuous or discontinuous procedure. The latter is the principal calculation method currently used at adsorption calorimetry20.
Discontinuous Procedure
Currently, the most common calorimetric procedure is the discontinuous one where the adsorptive is introduced in successive steps. The calorimetric cell with its contents (adsorbent and adsorptive) is considered an open system as can be seen in the Figure 3:
Figure 3 Schematic diagram of an adsorption microcalorimeter.
Source: Llewellyn and Maurin, 2005.40
Under these conditions, and taking into account the internal energy contribution by the gaseous adsorptive, we can write as Equation 413:
𝑑𝑈 = 𝑑𝑄𝑟𝑒𝑣+ 𝑑𝑊𝑟𝑒𝑣+ 𝑢𝑇𝑔𝑑𝑛 (4)
where 𝑑𝑄𝑟𝑒𝑣 is the reversible heat exchange with the surroundings at T temperature, 𝑑𝑊𝑟𝑒𝑣 is the reversible work done by the gas against the external pressure, 𝑢𝑇𝑔 is the molar internal energy of the adsorbable gas at temperature T and 𝑑𝑛 is the amount of adsorbable gas introduced during a given gas injection.
The calculation of 𝑑𝑊𝑟𝑒𝑣 can easily be done if one notionally splits the volume of the whole adsorption system into two parts13; VA external to the calorimetric cell, but in contact with the thermostat and VC located within the calorimetric cell. If we assume a reversible compression of an ideal gas by reduction of volume VA, the whole system exchanges work with the surroundings according to Equation 5:
𝑑𝑊𝑟𝑒𝑣(𝐴 + 𝐶) = 𝑅𝑇𝑑𝑛𝜎+ (𝑉𝐴 + 𝑉𝐶)𝑑𝑝 (5)
where 𝑑𝑛𝜎represents the amount adsorbed during the compression of the gas. The work received for the calorimetric cell is presented in Equation 6:
𝑑𝑊𝑟𝑒𝑣(𝐶) = 𝑅𝑇𝑑𝑛𝜎+ (𝑉𝐶)𝑑𝑝 (6)
Combining the last equations it gets the expression in Equation 7:
𝑑(𝑛𝑔𝑢𝑔+ 𝑛𝜎𝑢𝜎)
𝑇,𝑉,𝐴 = 𝑑𝑄𝑟𝑒𝑣+ 𝑅𝑇𝑑𝑛𝜎+ 𝑉𝐶𝑑𝑝 + 𝑢𝑔(𝑑𝑛𝑔 + 𝑑𝑛𝜎) (7)
And reorganizing, the Equation 8 is found
(𝑑𝑄𝑟𝑒𝑣
𝑑𝑛𝜎 )𝑇,𝐴+ 𝑉𝐶(
𝑑𝑝
𝑑𝑛𝜎)𝑇,𝐴 = [(
𝑑𝑈𝜎
𝑑𝑛𝜎) − 𝑢𝑔− 𝑅𝑇] = Δℎ𝑎𝑑𝑠,𝑇,𝑛
where, 𝑉𝐶 in this equation is the dead space volume of the sample cell within the calorimeter itself (thermopile). The term 𝑉𝐶𝑑𝑝 can be obtained via blank experiments, a process that will be later explained.
2.2.3. Classification of calorimetric curves.
The nature of the interaction between adsorbent and adsorbate-adsorbate affects the shape of the interaction energy curve relative to the coverage of the adsorbent. Filling mechanism and phase transitions of several adsorbates can be distinguish aside from structural changes of the adsorbent. Llewellyn28 proposed in the Handbook of thermal analysis and calorimetry the following classification:
Figure 4 Classification of calorimetric curves.
Source: Modified from Llewellyn, 2000.28
Figure 4, shows the three different hypothetical breakdowns of calorimetric curves due to various interactions during the adsorption of simple gases; (a) interactions between adsorbate molecules, (b) adsorbate-homogeneous adsorbent and finally (c) adsorbate–heterogeneous adsorbent
The curve (c) shows that for adsorbents that are energetically heterogeneous due to a pore size distribution and/or a varying surface chemistry (defects, functionalization, cations, etc), exhibit a decrease in heat of adsorption with gas loading due to its characteristic of highly heterogeneous adsorbents, with a wide distribution of gas-solid interaction energies.41
constant plateau. In such cases, to describe the change in the adsorption heats with coverage, another approach is to plot energy site distribution: assuming that the variation in the adsorption enthalpies coincides with energy distributions, one may wish to measure the number of sites with the same energy, i.e. sites that give rise to the same differential heat. This is achieved upon plotting – dn/dΔHdiff as a function of ΔHdiff. The area below the curve included between ΔHdiff and ΔHdiff + dΔHdiff represents the population of sites of identical strength estimated via ΔHdiff. The validity of energy distributions derived from heats of adsorption has been examined in the literature42 and it has been commonly used in the study of heterogeneous on catalyst. Thus for example, Bennici et al.43 studied by calorimetry two series of binary oxide catalysts (CuGa/SA and CuSn/SA) containing CuO coupled with Ga2O3 or SnO2 were prepared by dispersing the metal phases onto a high surface area acidic silica-alumina (SA) support by an adsorption method. They found that the acid strength of the surfaces, moderate acidity was associated with the Cu sites (100 kJ.mol-1< qdiff <150kJ.mol-1) whereas the most acidic fraction of the sites (qdiff <150kJ.mol-1) increased with the presence of Ga and Sn. Auroux44 studied the effect of proton exchange level, or sodium content on strong acid sites of zeolites by calorimetry. The energy site distribution clearly showed that, at low exchange levels, most of the acid sites are rather weak. While this population of stronger sites remained almost constant with the exchange level, the population of stronger sites increased progressively up to the point where, for extensively exchange samples, the strongest sites became predominant.
2.2.4. Tian-Calvet microcalorimeter
A Tian-Calvet heat-flux microcalorimeter is used for measurement of heats of adsorption and reaction on solid surfaces. Heat-flux signals are measured in transducer assemblies consisting of several hundred Seebeck-effect (production of differential voltage caused by temperature difference), thermo elements connected in series and arranged in a thimble configuration. These transducers surround calorimeter cells connected to a high-vacuum manometric adsorption system. The sensitivity of the microcalorimeter can be calibrated with a Joule-effect device45 or by measurement of heats of adsorption for known processes. Measurement of the heat flux is possible for a mean ΔT smaller than 10-6 K.
also introduced the differential assembly. Since then this has become a tool for different applications.
Figure 5. Tian- Calvet calorimeter cell representation
Source: Modified of Calvet and Prat, 1963 46
In Figure 5 most of the heat produced in A is conducted to the external jacket C by the bank of thermocouples surrounding the calorimeter container. The electromotive force produced in the thermoelectric pile or in the bank of thermocouples is proportional to the calorific power transferred.46
If the main way of heat transfer is conduction, the thermal characteristics necessary for constructing a useful core unit are straightforward, to deliver the unknown sample heat signal as efficiently and rapidly as possible to the heat-flux transducers and insure that the transducer elements deliver this heat flow to a sinking element held in perfectly isothermal conditions.45 The main characteristic of this device is the presence of two calorimetric cells, as a twin arrangement46. In this, one of the twin elements acts as reference-element, and is thoroughly maintained at the thermostat temperature, whilst in the second or measurement-element. The heat of the process under investigation is internally compensated by Peltier cooling or by Joule heating.
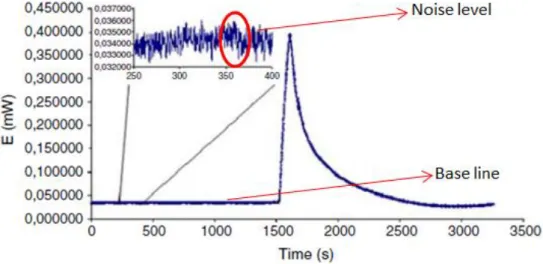
so that it is important to keep it low in order to have trustworthy results and to be able to reproduce the experiment. In this work the noise level is approximately 1μW, represented in Figure 6.
Figure 6 Thermogram with the representation of the noise level and base line
Source: García-Cuello et al. 48
This is a fast process resulting in decrease of equilibrium time, which reaches a value close to the time constant of the calorimeter. In this way they can difference between strong and weak adsorption can be done.
2.3. Ordered mesoporous silicas
The development of mesoporous materials as adsorbent solids began 25 years ago with researches presented by Beck et al.53 and Kresge et al.54, leading to an extensive amount of works related to this kind of solids. Ordered mesoporous materials where first developed when studying the hexagonally arranged MCM-41 and subsequently the cubic MCM- 48 and layered MCM-50, collectively known as the M41S family. Other works that followed exhibit the possibility to prepare materials using non-ionic surfactants with notably materials such as well-known members SBA-15 (hexagonal) and SBA-16 (cubic) 55,56.
The adsorption on these mesoporous materials can be physical or chemical in relation to the capture of CO2, depending on the synthesis condition and its functionalization with organic molecules incorporated on their porous walls, as it is explained below.
2.3.1 SBA-15 family
SBA-15 consists of a 2D hexagonal mesopore structure (P6mn space group) (Zhao et al., 1998 a9,b10). The pore size can vary depending of the use of block co-polymers of different sizes. The pore geometry is an arrangement of cylinders and it can be considered as a model to understand capillary condensation13 phenomena much like MCM-41. However, depending on the synthesis conditions -especially the temperature-, there is a possibility of the block copolymer chains to be occluded in the silica walls, which, when it was removed, leads to the possibility of materials having a certain degree of microporosity55–58. It is also possible to influence on the degree of microporosity and the formation of several silanols types by varying the calcination temperature59.
Due to the reactivity existing between carbon dioxide and amino groups,61,62 ithas focused on the functionalization of mesostructured materials with amino-containing molecules in order to obtain highly selective adsorbents.
Grafting process, based on the chemical reaction between surface silanol groups and organo - alkoxy molecules63, has been employed to incorporate amine organo silanes into a wide range of silica supports.
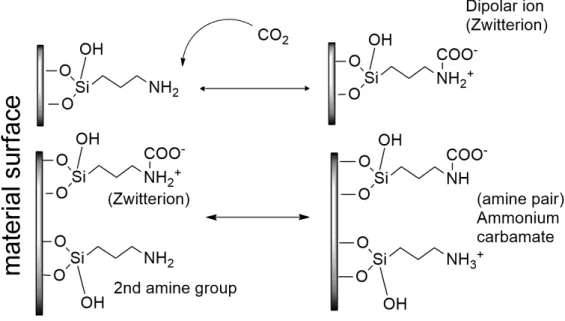
The CO2/N ratio for these materials is usually close to 0.50 mol CO2/ mol N, which is the maximum value for CO2 capture under dry conditions, taking into account the reaction stoichiometry as seen in Figure 7.
Figure 7 Reaction scheme between CO2 and grafted amino groups
Source: Our authorship
Chang et al.64 examined the adsorption of CO2 on amine-grafted mesoporous silica. MCM-41, SBA-15 and pore-expanded MCM-41 were modified by mono-, di- and tri-aminosilanes to make hybrid adsorbents for CO2 capture. SBA-15 was found to be a better support than MCM- 41 or pore-expanded SBA-15 for grafting amine moieties for the adsorption of CO2. The tri-amine-grafted SBA-15 exhibited a CO2 adsorption capacity of 2.4 mmol/gads at 60°C under anhydrous gas flow.
toluene. The performance of the materials for CO2 sorption at low and high-pressure was evaluated. The amine functionalized silica SBA-15 exhibited good CO2 adsorption capacity: 0.7– 1.5 mmol g-1 at ambient pressure and 8–12 mmol g-1 at 40bar. These values indicate the great potential of the amine functionalized silica obtained in scCO2 for carbon capture technology.
The reuse and recycling of amine-silica materials as CO2 adsorbents were investigated for understanding their industrial viability in a novel study presented by Sanz-Pérez et al.66 CO2 adsorbents were obtained by grafting of diethylenetriamine (DT) or impregnation of polyethyleneimine (PEI) onto SBA-15 silica. The results showed for the grafting materials adsorbed 1.90 mmol g-1 at 45°C at 1 bar and for the impregnating material 1.72 mmol g-1 at the same temperature-pressure conditions, moreover CO
2 desorption conditions were evaluated, optimizing the time and temperature to reduce energy costs. In all cases, conditions as mild as 90°C and 90 min were enough to completely remove all CO2 adsorbed.
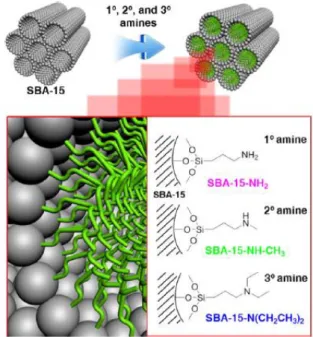
The total nitrogen content incorporated into the support is restricted by the amount of silanol groups present in the surface. In order to overcome the limitation previously mentioned and to incorporate a higher quantity of amino groups, the impregnation method is used. This procedure consists of the physical incorporation of organic molecules into the porous structure (Figure 8), so that the whole pore volume can be filled with no restrictions apart from the organic molecule size relative to the pore entrance space. Impregnation leads to the incorporation of high amounts of large molecules providing a noticeable amount of amino groups in the resulting adsorbent.8
Sanz et al.63development a functionalization method based on the impregnation of previously grafted pore-expanded SBA-15. The combination of tethered and mobile amino groups has led to a synergic effect, yielding samples with CO2 uptakes up to 5.34 mmol CO2 g-1 at 45°C and 0.15 bar CO2 and high adsorption efficiencies showing the advantages of this method of functionalization.
prepared by impregnating PEI in the same commercial silica support, to give PEI/silica. The adsorption experiments showed that these new adsorbents offered both high adsorption capacity and improved adsorption kinetics compared to the conventional PEI/silica adsorbent. The modified PEI samples, A-PEI/silica and T-PEI/silica, also presented higher decomposition temperatures compared to the standard PEI/silica, resulting in hybrid adsorbents with enhanced thermal stability over multiple temperature swing cycles. The adsorption capacity at 25°C shown values of 2.26 mmol g-1 for A-PEI/silica, 2.19 mmol g-1 for T-PEI/silica and 2.36 mmol g-1 for PEI/silica CO2 g-1 in atmospheric pressure.
Figure 8 Schematic of primary, secondary, and tertiary amino-silane compounds impregnated on SBA-15 and their nomenclature
Source: Modified of Ko et al.68
3 EXPERIMENTAL 3.1. Materials
3.1.1. Gases
The gases used as adsorbates during the adsorption capacity and microcalorimetric studies were helium, carbon dioxide and nitrogen (White Martins Praxair, Inc., Brazil). Nitrogen was also used to determine the textural properties from isotherms at -196 °C. Helium was used for calibration procedures. The specifications of the gases are presented in Table 1:
Table 1 Characteristics of the gases used as adsorbates
Gases Concentration (%) Impurities
Helium 99.999 THC*<0.5 ppm, CO2, O2<1 ppm, N2<5 ppm
Carbon dioxide 99.800 -
Nitrogen 99.999 THC*<0.5 ppm, CO2, O2<1 ppm, H2O<2 ppm
* THC: Total hydrocarbon content
Source: White Martins Praxair, Inc., Brazil.
3.1.2. Adsorbents
3.1.2.1.Synthesis of mesoporous silica
The synthesis of pure mesoporous silica (MSS) was performed using a hydrothermal route as described by Fulvio et al72, with some minor modifications attempting to obtain SBA-15. So, 5.7 gof P123 (Sigma Aldrich, Brazil) was used as structure-directing agent and0.065 g of NH4F (Sigma Aldrich, Brazil) as a swelling agent to reduce the length of the channels73 moreover is known that this substance changes the molecular arrangement of a conventional sba-15, making it more suitable for the grafting step. They were mixed in 200 mL HCl solution (1.3 M) (Labsynth, Brazil) and stirred at room temperature until the complete dissolution of the surfactant. Then, 12.2 g of TEOS (Sigma Aldrich, Brazil) was added as a silica source under stirring for 24h at room temperature. The solution was then transferred to a teflon lined reactor and heated at 100 °C for 48 h.
Figure 9 Synthesis MSS flowchart
Source: Own authorship
3.1.2.2. Grafting with APTES
APTES grafting on pure mesoporous silica (MSS) was carried out following the methodology described by Hiyoshi et al.74 . The pure mesoporous silica (2.0g), previously dried at 110 °C, was introduced into a three neck flask and soaked with 10%, 20%, 40% and 60% v/v APTES (Sigma Aldrich, Brazil) solution in dry toluene. The solution was heated overnight under reflux at 110 °C under N2 atmosphere. The different grafted silicas were filtered, washed with pure toluene(Labsynth, Brazil) and dried at 100 °C. The samples were named as MSG10, MSG20, MSG40 and MSG60. The numbers in these labels represent the
different volume/volume ratios of APTES to toluene in the grafting step (see Figure 10).
3.1.2.3.Impregnation with poly ethyl imine (PEI)
In this step, the grafting and impregnation methods were combined to obtain a higher nitrogen incorporation (as compared to MSG materials) and a higher mobility of amino groups.63
3.6 g of methanol (Labsynth, Brazil) for about 15 min. Then 0.45 g of MSG20 was added to the solution, maintaining a proportion of 8 g of methanol per gram of MSG20 sample.
The resultant slurry was continuously stirred for about 30 min and the solid was dried at room temperature overnight.71
The as-prepared adsorbent was denoted as MSG20I30, where “30” represents the loading of PEI as weight percentage of the sample. A process flowchart is presented in the Figure 10.
Figure 10 Grafting and Impregnation process flowchart
Source: Own authorship. 3.2.Methods
3.2.1. Adsorbents characterization
All samples were characterized using the methods and techniques presented in the following sections.
3.2.1.1. Textural Characterization
vacuum (10-6 bar) during 4 hours before the beginning of the experiment in order to ensure a clean solid surface for the test.
SPECIFIC SURFACE AREA:
The specific surface area of all materials was calculated using the Brunauer-Emmett-Teller (BET) 76 equation. The model equation is generally applied in a linearized form as in Equation 9.
By plotting 𝑃⁄𝑃𝑂 𝑛(1−𝑃 𝑃⁄ )𝑜
vs. 𝑃 𝑃 𝑂
⁄ in a relative pressure range from 0.05 to 0.35, a straight line is expected with slope (𝐶 − 1) 𝑛⁄ 𝑚and an intercept equal to 1 𝑛⁄ 𝑚𝐶. Since 𝑛𝑚 is the number of moles required to cover a monolayer, and the cross section of the nitrogen molecule (𝜎) is a known value13 equal to 0.162 nm2.
It is possible to estimate the surface area (𝐴B𝐸𝑇) using Equation 10, where the Avogadro Number (AN) equals to 6.023∙1023𝑚𝑜𝑙−1.
TOTAL PORE VOLUME
The total pore volume was estimated using Equation 10, where 𝑛m is the amount adsorbed at a relative pressure of 0.985. For this relative pressure, it is assumed that all pores are filled with liquid adsorbate14.
where, MM and 𝜌𝑁2 are the molar mass and the density of liquid N2, respectively. 𝑃
𝑃𝑂
⁄
𝑛 (1 − 𝑃 𝑃⁄ )𝑜
=𝑛1
𝑚𝐶 + 𝐶 − 1
𝑛𝑚 (
𝑃
𝑃𝑂) (9)
𝐴𝐵𝐸𝑇 = 𝑛𝑚𝐴𝑁𝜎 (10)
MICROPORE VOLUME
The micropore volume was calculated using the Dubinin-Radushkevich (DR) equation13, which is based on the potential theory of Polanyi13.The essential parameter (Polanyi adsorption parameter) A is defined by Equation 11, which is related to the affinity of adsorption.
where R is the gas constant and T is temperature.
The characteristic curve is Usually expressed as shown in Equation 12.
where V is the volume that can be adsorbed in a given relative pressure value, Vo is the maximum volume that can be adsorbed and E is a characteristic energy of the system.
By combining equations 11 and 12, one can obtain the DR equation shown as Equation 13.
where D is the DR (Dubinin–Radushkevich) constant.
Equation 13 can be written in terms of adsorbed moles, thus it is rewritten as in Equation 14:
where 𝑛(𝑝𝑜) are the adsorbed moles for a given relative pressure value, and 𝑛(𝑝𝑜)(𝑚𝑖𝑐) is the amount of moles that can be adsorbed in the micropores.
𝐴 = 𝑅𝑇𝑙𝑛𝑃𝑃𝑜 (4)
𝑉
𝑉𝑜= 𝑒
(−𝐴 𝐸⁄ )2 (5)
𝑙𝑜𝑔 (𝑉𝑉
𝑜) = −𝐷𝑙𝑜𝑔10
2 (𝑃𝑜
𝑃 ) (6)
𝑛(𝑝𝑜)(𝑚𝑖𝑐) may then be estimated from the intercept of the straight line obtained by plotting 𝑙𝑜𝑔10(𝑛(𝑝𝑜)) vs 𝑙𝑜𝑔102 (𝑃𝑜
𝑃) for a relative pressure range of 10
-5 to 0.4. Finally, Equation 15 was used to obtain the micropores volume.
PORE SIZE DISTRIBUTION
The pore size distribution (PSD) of each sample was obtained using the BJH method from the nitrogen isotherms at -196.15°C applied to the desorption branch. This method was developed by Barrett, Joyner and Halenda.77 They used the concepts of capillary condensation and formation of superficial layer in mesoporous solids. The PSD is one of the main properties of a solid adsorbent for gas separation/purification and storage, and it is necessary for molecular simulation and development of new materials.
3.2.1.2.X-ray diffraction (XRD)
In this work, an automatic diffractometer model X’Pert Pro MPD (PANalytical , Netherlands) was used, with a X’Celerator detector operating under continuous scan conditions. The measurements were obtained for 2θ between 1 and 10°. This technique was used to identify the possible semi-crystalline phases of the mesoporous silica materials in low angle and compare them to the typical structural arrangement of SBA-15.
3.2.1.3.Elemental Analysis
The elemental analysis of carbon, hydrogen and nitrogen (C, O, N) was performed using a CHNS/O Analyzer 2400, Series II (Perkin Elmer. USA) This technique was used to determine the nitrogen groups that were effectively incorporated to the silica samples.
In order to do this, approximately 10 mg were used. This technique consists in the combustion of the sample under inert atmosphere, obtaining simple gases such as CO2, H2O and N2, which can be analyzed by gas chromatography.
The density of amino groups, ø-NH2 [Amine molecules/nm2], was calculated by means of the nitrogen concentration, using Equation 16:
𝑉̂𝑝𝑜(𝑚𝑖𝑐) = 𝑛(𝑝𝑜)(𝑚𝑖𝑐)𝑀𝑀𝜌𝑁2
where Nc is the nitrogen concentration (mol g-1), NA the Avogadro number and ABET is the specific surface area (m2 g-1).
The literature63,78,79 mentions the fact that, theoretically, two moles of N are required to capture one CO2 mole to generate an ammonium carbamate. Therefore, the maximum theoretical adsorption capacity of CO2 by chemisorption (MTAC) could be calculated.
3.2.1.4.29Si NMR Nuclear magnetic resonance
The nuclear magnetic resonance spectra of 29Si for grafted the mesoporous silicas (MSG) and the pure sample (MSS) were obtained using a Bruker Avance II + 400, at room temperature. The measurements were made at a resonance frequency of 79.5 MHz, employing a spectra decoupling of protons with a pulse repetition time of 60 s and pulse angle of 90°. For the pure sample, this technique was used to determine the concentration of silanol groups on the surface available to react with APTES (Equation 17). For MSG samples, it represents the percentage of -OH groups that do not react after the grafting named (%−𝑂𝐻(𝑄)) as Si Q type from equation 10.80 In addition, these values are used to calculate the APTES coverage percentage on the MSG surfaces using Equation 18, which illustrates the relation between the occupied silanol groups with the initial groups on the MSS sample.
where Q2, Q3 and Q4 represent the different types of silicon bound to oxygen on solid silica in molar percentage (see Figure 11).
Figure 11 Chemical composition of silica surface
∅−𝑁𝐻2 =𝐴𝑁𝑐. 𝑁𝐴
𝐵𝐸𝑇. 1018 (9)
%−𝑂𝐻(𝑄)= 2𝑄 2+ 𝑄3
Source: Own authorship.
Equation 19 was used to compute the total of hydroxyl groups after the grafting process.
where T2 and T3 represent the different types of silicon bound to carbon in molar percentage, as well as oxygen on solid silica (see Figure 11).
Equation 20 calculates the density of the silanols group (∅−𝑂𝐻) in –OH molecules per nm2. This property is very important because it provides an idea of distribution of these groups on the surface and how they interact with free and adsorbed CO2.
where 60.08 is the molecular mass of silica and 1020 is an unit conversion factor.
Equation 21 was used to compute the molar percentage of APTES after grafting process.
%𝐴𝑃𝑇𝐸𝑆 𝑠𝑢𝑟𝑓𝑎𝑐𝑒 𝑐𝑜𝑣𝑒𝑟𝑎𝑔𝑒 =%−𝑂𝐻𝑀𝑆𝑆(𝑄)% − %−𝑂𝐻𝑀𝑆𝐺(𝑄)
−𝑂𝐻𝑀𝑆𝑆(𝑄)
(11)
%−𝑂𝐻(𝑡𝑜𝑡𝑎𝑙) = 2𝑄
2 + 𝑄3+ 𝑇2
𝑄2+ 𝑄3+ 𝑄4+ 𝑇2 + 𝑇3 (12)
∅−𝑂𝐻 =60.08𝑥𝐴%−𝑂𝐻(𝑡𝑜𝑡𝑎𝑙)𝑥𝑁𝐴
3.2.1.5.Thermogravimetric analysis
In order to identify the volatile components of the material and analyze the mass loss events with increasing temperature, thermal analysis was performed for all samples. TGA-QMS equipment model STA 409 CD/403/5/G SKIMMER (Netzsch, Germany), coupled with a mass spectrometer was used. In these experiments, approximately 20 mg of material was weighted and the sample was heated to 800 °C with a heating rate of 10 °C min-1 under air flow (20 mL min-1).
3.2.2. Adsorption Microcalorimetric experiments
For the adsorption microcalorimetric experiments, instrument Setaram C80, a Tian-Calvet microcalorimeter developed by Setaram Inc. (France) was used. It was coupled to a manometric system to measure simultaneously the CO2 adsorption capacities and the amount of gas injected to the microcalorimeter under isothermal conditions. The microcalorimeter is internally composed of an array of thermocouples (9 rings of 19 thermocouples each, 19 inner and 19 outer ones, see Figure 12) that totally surround the sample and reference parts. The reference and sample cells have each volume of 12 cm3 and are made of stainless steel. All heat that flows from the sample is captured and measured through a heat DSC sensor (3D) with 0.12 μW resolution. It also has a thermostat that allows for experiments ranging from ambient temperatures up to 300°C maintaining adiabatic conditions, if required. A power module receives command signals from a controller and provides the heating power for the thermostat and for the cooling fan command.81
The manometric system consists of seven valves forming a manifold, which is connected to the gas input. A pressure transducer P-30 model (WIKA, Germany) is also connected to the manifold with a precision of ≤ 0.1% and operating absolute pressure from 0 up to 1 bar. This is coupled to a digital multimeter of 6 ½ digits, 34401A model (Agilent, USA), in order to measure the injection and equilibrium pressures.
Figure 12. Internal thermocouple configuration
Source: Setaram C80, Commissioning.81
A vacuum pump model TC110 (Pfeiffer, Germany) is incorporated to the manifold to outgas the sample. Room temperature was monitored with a digital thermometer JProlab with operating range of -50°C up to 300°C and resolution of 0.1°C.
The complete system scheme is presented in Figure 13, valve 7 is the injection valve connected to the calorimeter and to the manometric system.
Figure 13 Microcalorimeter and Manometric system configuration
Approximately 0.2 - 0.3 g of adsorbent was used for the experiments in this system. The silica samples were previously outgassed at 120 °C, for about 4 h under vacuum at pressures (10-6 bar) to ensure a clean surface required for the adsorption tests. The isotherms were measured up to 1 bar at 25 °C for all samples, plus 50°C for MSG60 and MSG20I30 with 3 regeneration cycles using vacuum and vacuum/temperature.
In order to calculate the adsorbed amount of gas, the initial moles injected in the cell and the equilibrium pressures are needed. Then, the following equations82 was apply assuming ideal gas (low pressures).
where pi and peqrepresent the initial and equilibrium pressures, VDOS the dosed volume, nDOS the dosed moles, TDOS and Teq the temperature of dosification and equilibrium, Vd the dead volume, ni and ne arethe initial and equilibrium mole in the gas phase.
Then, equation 25 is used to compute the amount of gas that was adsorbed (𝑛𝑎𝑑𝑠), which is one of the points in the equilibrium adsorption isotherm.
For the first data point, 𝑛𝑖 is zero; for the next point, valve 7 (Figure 13) is closed and the last procedure is repeated for all points of the isotherm. An additional amount is then adsorbed, again according to equation 25. The complete isotherm representation 𝑛𝑎𝑑𝑠 per adsorbent mass vs 𝑝𝑒𝑞 is obtained with successive increments(i) from 𝑛1 to 𝑛𝑖.82
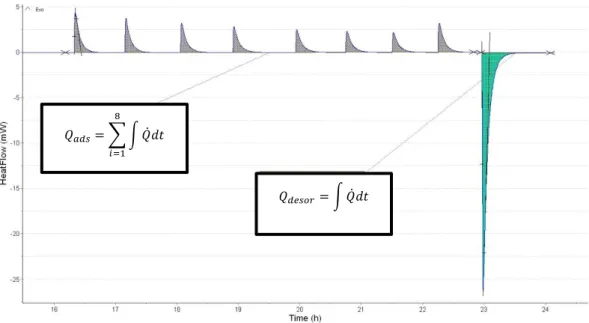
3.2.2.1.Thermokinetic Parameter
The calorimetric signal (heat flow) decreases exponentially with the adsorption
𝑛𝐷𝑂𝑆 =𝑝𝑖𝑅𝑇𝑉𝐷𝑂𝑆
𝐷𝑂𝑆 (15)
𝑛𝑒 =𝑝𝑒𝑞(𝑉𝑅𝑇𝐷𝑂𝑆+𝑉𝑑)
𝑒𝑞 (16)
𝑛𝑖 = 𝑝𝑅𝑇𝑒𝑞𝑉𝑑
𝑒𝑞 (17)
time after the maximum of each adsorption peak, according to equation 26:
where D and Dm are the deviation and the maximum deviation of the heat signal respectively. In equation 27, the thermokinetic parameter τ, or time constant, can be calculated as the inverse of the slope of the straight line obtained upon plotting log D as a function of time as shown by equation 33.49 However, this thermokinetic parameter is not constant and varies as the adsorbent surface is filled.
3.2.2.2.Differential Enthalpy of Adsorption
Before starting the calorimetric experiments, all samples were outgassed at 120°C for 4 h under vacuum (10-6 bar), in order to have a clean surface and eliminate impurities adsorbed from atmospheric air that could interfere with the equilibrium adsorbent-adsorbate.
Using the discontinuous method13, currently the most common calorimetric procedure, it is possible to compute the differential adsorption enthalpy. The adsorptive is introduced in successive steps by means of the manometric system coupled with the Setaram C80 previosly described. This is done in order to determine the adsorbed amount for a given injection and use this value to calculate the adsorption enthalpy, as shown in equation 28:
Δℎ𝑎𝑑𝑠,𝑇,𝑛 = (𝑑𝑄𝑑𝑛𝑟𝑒𝑣𝜎 )
𝑇,𝐴 + 𝑉𝑑( 𝑑𝑝
𝑑𝑛𝜎)𝑇,𝐴
(21)
The term 𝑑𝑄𝑟𝑒𝑣 of equation 21 is the result of the integration of the peak area detected by the calorimeter sensors, when 𝑑𝑛 moles are injected. The difference between the injection and equilibrium pressures is shown in the equation as 𝑑𝑝. The microcalorimetric data is treated using the Calisto® Software (v1.043 AKTS-Setaram, France). The
D = 𝐷𝑚𝑒−𝑡 𝜏⁄ (19)