Amino acid reference intervals by high
performance liquid chromatography in
plasma sample of Brazilian children
Valores de referência de aminoácidos por cromatografia líquida de alta
eficiência em amostras de plasma de crianças brasileiras
Ana F. Cruz1; Tatiana Maria C. C. Barbosa2; Talita Émile R. Adelino3; William P. Lima2; Magda O. Mendes2; Eugênia R. Valadares3
1. Hospital das Clínicas da Universidade Federal de Minas Gerais (UFMG), Minas Gerais, Brasil. 2. Laboratório Hermes Pardini, Minas Gerais, Brasil. 3. UFMG, Minas Gerais, Brasil.
First submission on 28/03/15; last submission on 03/12/15; accepted for publication on 03/12/15; published on 20/04/16
aBStraCt
Introduction: The high performance liquid chromatography is a technique used for quantiication of amino acids in plasma. The deinition of reference intervals in the population is very important for the diagnosis and monitoring of individuals with amino acid disorders. Objectives: The objectives of this study were to validate a method for amino acids quantiication and deine reference intervals in Brazilian children. Results: Good chromatographic separation was achieved using C18 solid-core column. The method showed satisfactory linearity, limits of detection and quantiication, precision and accuracy. The reference ranges for aspartate, glutamate, asparagine, histidine, serine, glutamine, arginine, tyrosine, alanine, tryptophan, methionine, valine, phenylalanine, isoleucine and leucine were deined in a group of 60 healthy individuals aged 2 to 14 years. Conclusion: The presented technique can be applied in clinical practice. Each laboratory should preferably establish its own reference intervals. If that is not possible, it is recommended the use of the reference intervals described in this study for the diagnosis and monitoring of Brazilian children in this age group.
Key words: liquid chromatography; inborn errors of metabolism; amino acids; reference values.
introDuCtion
Inborn errors of metabolism constitutes a diverse group of individually rare disorders, that group correspond to 10% of the genetic diseases described(1). They all occur due to enzyme defects
that cause disruption of speciic metabolic pathways(2). Within this
group, the amino acids disorders stand out as serious diseases, whose symptoms are caused by acute or chronic poisoning by the accumulation of amino acids and other toxic metabolites, which might damage the brain, kidneys and liver(1, 3). Their relative rarity
and nonspeciic presentation may contribute to the delay or the dificulty to diagnosis, which leads, sometimes, to irreparable consequences on child development(4-6).
Thereby, quantitative analysis of amino acids in blood and urine are tests especially indicated for patients suspected of amino acid disorders and organic acidemia. These exams can also be
applied in the management of patients with these diseases that make use of dietary formulas restricted in amino acids and also for therapeutic decisions during decompensation and crisis(7, 8).
A decrease or mild elevation of amino acids level can only be detected in blood, and morning fasting blood specimens are preferred. High performance liquid chromatography (HPLC) with derivatization is widely used for the diagnosis of most amino acid disorders.
Amino acids levels must be cautiously interpreted, since the levels of these substances in the blood are inluenced by a number of factors, such as age, physiological changes, nutritional status, illnesses, medications and toxins. Furthermore, there are no well-established reference intervals in our population, and data from
international literature are traditionally used(9-12). The aim of this
study was, therefore, to validate a technique of measurement of amino acids in plasma using HPLC with luorometric detector and solid-core column, as well as deine reference ranges for serum amino acids for the pediatric group from the population studied.
MatEriaL anD MEthoD
Equipment
The equipment used was the HPLC Alliance HT Waters® 2695
(Milford, USA) equipped with quaternary pump, thermostat, automatic injector, degasser and luorometric detector multivariable model 2475. The system was controlled by Empower 2.0 software.
Standards, chemicals and reagents
The standards and chemicals utilized in the methodology were purchased from Sigma Aldrich® (St. Louis, USA) and included:
L-aspartic acid, L-glutamic acid, L-asparagine, L-histidine, L-serine, L-glutamine, L-arginine, L-glycine, L-threonine, L-tyrosine, L-alanine, L-tryptophan, L-methionine, L-valine, L-phenylalanine, L-isoleucine, L-leucine, mercaptoethanol (analytical grade) and ortho-phthalaldehyde (OPA) (analytical grade). The others chemicals and reagents utilized were from Merck® (Darmstadt,
Germany) and include: acetonitrile (HPLC grade), formic acid (analytical grade), methanol (HPLC grade), sodium hydroxide (analytical grade), ethanol (analytical grade), sodium phosphate monobasic dihydrate (analytical grade), sodium phosphate dibasic (analytical grade), orthophosphoric acid (analytical grade) and boric acid (analytical grade). The deionized water used was from the water puriication system of Millipore® (Millipore, Bedford, MA,
USA) with resistivity of 18.2 megaohms.cm-1.
Solutions
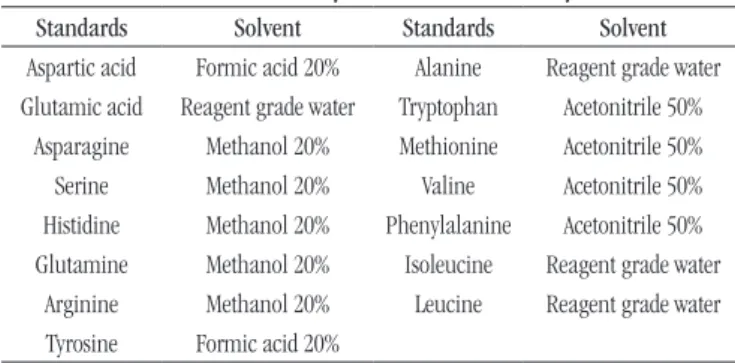
The derivatization solution was formed by OPA (0.02 g) prepared with mercaptoethanol (20 µl), ethanol (100 µl) and 0.4 M borate buffer in alkaline environment (pH 9.5 to 1 ml). Solutions of 20% formic acid, 20% methanol and 50% acetonitrile were utilized to prepare stock solutions of each amino acid
(Table 1). The intermediary solutions and solutions used were prepared with reagent grade water.
Preparation of mobile phase and
chromatographic conditions
The gradient mode (Table 2) was used for better separation of amino acids and two mobile phases were prepared. The mobile phase A composition was phosphate buffer, methanol and water (57/33/30% v/v) with pH 6.5 and mobile phase B composition was methanol and phosphate buffer (47/53 v/v%) with pH 8.5. The wash solution was constituted by methanol 10%. The solid-core column AccuCORE C18 (150 mm × 4.6 mm, particle size 2.6 mM) of Thermo Scientiic® (Waltham, USA) was used to achieve
separation of the amino acids. The wavelength of the detector was
lex = 330 nm and lem = 418 nm.
Validation methods
After method optimization, statistical tools were applied using the software Statistical Package of the Social Sciences 12.0® (SPSS).
Linearity
The concentrations of aspartate (100, 200, 300 and 400 nmol/ml), glutamate (150, 600, 1050 and 1500 nmol/ml), asparagine (150, 600, 1050 and 1500 nmol/ml), histidine (100, 250, 400 and 550 nnmol/ml), serine (150, 600, 1050 and 1500 nmol/ml), glutamine (150, 600, 1050 and 1500 nmol/ml), arginine (100, 250, 400 and 550 nmol/ml), tyrosine (150, 600, 1050 and 1500 nmol/ml), alanine (150, 400, 750 and 1050 nmol/ml), tryptophan (150, 600, 1050 and 1500 nmol/ml), methionine (100, 200, 300 and 400 nmol/ml), valine (150, 600, 1050 and 1500 nmol/ml), phenylalanine (150, 600, 1050 and 1500 nmol/ml), isoleucine (150, 600, 1050 and 1500 nmol/ml) and leucine (150, 600, 1050 and 1500 nmol/ml) were prepared for linearity study. These solutions were processed as described in the topic “Sample collection and processing”, injected in triplicate on the same day of analysis.
The linearity was studied in four concentration levels. The analytical curves and the coeficient of determination (r2) were
obtained and the method was considered linear when r2 was
greater than 0.99.
taBLE 1 − Solubility of the amino acids analyzed
Standards Solvent Standards Solvent Aspartic acid Formic acid 20% Alanine Reagent grade water
Glutamic acid Reagent grade water Tryptophan Acetonitrile 50% Asparagine Methanol 20% Methionine Acetonitrile 50%
Serine Methanol 20% Valine Acetonitrile 50% Histidine Methanol 20% Phenylalanine Acetonitrile 50%
Glutamine Methanol 20% Isoleucine Reagent grade water
Arginine Methanol 20% Leucine Reagent grade water
Tyrosine Formic acid 20%
taBLE 2 − Mobile phase gradient established by amino acid analysis
Time (min) Flush % Mobile phase A % Mobile phase B
0 0.2 100 0
25 0.2 100 0
26 0.2 32 68
61 0.3 0 100
80 0.3 0 100
Limit of detection (LOD) and quantification (LQ)
To evaluate the LOD and LQ of the method, 10 independent replicates were prepared from the white plasma pool. The solutions were processed as described in the topic “Sample collection and processing”. A signal-to-noise ratio of 3:1 was used to determine the LOD and a ratio of 10:1 was used to determine the LQ of the method.
Precision and accuracy
The different concentrations of aspartate (10, 100 and 350 nmol/ml), glutamate (250, 350 and 1050 nmol/ml), asparagine (25, 250 and 1050 nmol/ml), histidine (100, 150 and 350 nmol/ml), serine (140, 180 and 1050 nmol/ml), glutamine (180, 350 and 1050 nmol/ml), arginine (120, 150 and 400 nmol/ml), tyrosine (80, 180 and 1050 nmol/ml), alanine (350, 550 and 1050 nmol/ml), tryptophan (70, 150 and 400 nmol/ml), methionine (35, 100 and 350 nmol/ml), valine (150, 250 and 1050 nmol/ml), phenylalanine (70, 180 and 1050 nmol/ml), isoleucine (100, 180, and 1050 nmol/ml) and leucine (150, 250 and 1050 nmol/ml) were prepared in triplicate for the study of precision and accuracy. These concentrations were processed as described in the topic “Sample collection and processing”.
For precision, the solutions were analyzed by chromatography on the same day of preparation (intra-assay precision) and on three consecutive days (inter-assay precision). The intra-assay and inter-assay precision were expressed by the coeficient of variation. The accuracy of the method was veriied by triplicate analysis of each amino acid and the recovery percentage was calculated.
Ethical aspects
This study was approved by the Research Ethics Committee of the Universidade Federal de Minas Gerais (UFMG) under registration number 08169212.2.0000.5149 and all participants and/or guardians signed the informed consent form.
Population
A cross sectional study was carried on with individuals selected in the Hospital das Clínicas of the UFMG, among children from primary and secondary care units linked to the institution. The group was formed by 60 individuals aged between 2 and 14 years, of both genders. The sampling was done considering the exclusion and inclusion criteria and the period of two months available for the study, characterizing a convenience sampling. All children in this age group who attended in central laboratory for blood collection were interviewed for the identiication of any exclusion criteria.
Inclusion criteria
Healthy children who attended the Hospital for performing routine checkups were included. All subjects responded to a questionnaire on date of birth, previous diseases, use of medications, fasting time, and presence of vomiting.
Exclusion criteria
Children with history of short stature or insuficient weight gain, who presented fasting or vomiting lasting more than a day or who were in use of interfering substances during the collection period, such as ascorbic acid, aspartame, aspirin, sulfamethoxazole/trimethoprim, glucose, indomethacin, progesterone, testosterone and valproate were excluded. Patient in pre or post-transplant, with liver or kidney disease, type 1 diabetes, sickle cell anemia, leukemia and other cancers, cystic ibrosis, genetic syndromes and dysmorphisms, acquired immunodeiciency syndrome (Aids), syphilis, visceral and hematological alterations under investigation, autoimmune diseases, endocrine and hormonal disorders were also excluded(13). Younger children, especially under one year, were
not included in the group, because blood levels of amino acids present greater variation in these children compared with the age group studied(13, 14).
Sample collection and processing
The sample collection was performed after fasting of 8-12 hours. For each patient were collected 4 ml of venous blood in a Vacutainer ethylenediaminetetraacetic acid (EDTA) blood collection tube. The sample were centrifuged at 2,000 rpm for 5 minutes to separate plasma and immediately frozen at a temperature of -20ºC until the time of analysis, which was carried out in a maximum period of 15 days.
Sample preparation consisted of adding 20 µl of plasma to an Eppendorf and 100 µl of the derivatizing solution previously described. The solution was homogenized with the aid of a pipette and transferred into an insert. After 1 minute, 1 μl of the solution was injected into the chromatograph.
Statistical analysis
For deinition of the reference ranges, statistical analysis was performed using the software Medcalc®. The detection of
probable outliers was tested by Reed’s method(15). The reference
according to Kolmogorov-Smirnov test(16). For data that did not
show parametric distribution, even after transformation, non-parametric methodology was used to calculate the lower limit, which corresponds to 2.5 percentile. The upper limit was calculated by the robust method, according to the method described by Horn and Pesce (2005)(17). Conidence intervals of 90% for the lower
and upper limits of each interval were generated, except when the non-parametric method was applied, because n < 120(16). The
Student’s t test and Wilcoxon test were applied to comparison with
the literature.
rESuLtS
Method validation
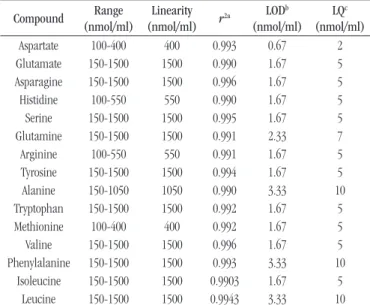
After optimization, the run time was 90 minutes and the gradient established allowed a good chromatographic separation of the validated amino acids (Figure 1). The amino acids glycine and threonine showed analytical signal amongst amino acids arginine and tyrosine, but did not provide good chromatographic separation and were not included in this validation. Linear responses were found with r2 > 0.99 for all amino acids (Table 3).
The values for LOD and LQ are described in Table 3. The results of accuracy, intra and inter-assay obtained in the three different concentrations are described in Table 4. The recovery presented values between (87.9 ± 5.6)% and (112.3 ± 6.1)%. The results were reported in Table 5.
Determination of reference intervals
Figure 2 illustrates the distribution of the control group by
gender and age. Table 6 shows the reference ranges calculated for
all amino acids studied.
DiSCuSSion
Method validation
The sample preparation is simple and fast, but should not be reinjected into the chromatograph since the reaction of amino acids with OPA is rather unstable and these compounds can be rapidly converted into non-luorescent degradation products(18).
The disadvantage of using OPA consists in the instability of the luorescent product and in its restriction of only reacting with primary amino acids. This is counterbalanced by the fact that its use allows high sensitivity and reproducible analysis(19) and
its relatively low cost, making OPA a widely used derivatization reagent for the analysis of amino acid(18, 20).
The procedure was considered long for a laboratory routine. That occurs because, although the use of solid core column allowed excellent separation and good durability, when it is introduced into HPLC it requires a lower low rate for not reaching high pressures.
The amino acids glycine and threonine were not included in the validation since they do not have good chromatographic separation. This can be explained by the fact that the retention time of both amino acids were subjected to the gradient of mobile phases A (32.0%) and B (68.0%).
Under the conditions tested, the gradient, that it is a mixture of mobile phases of different compositions, provided the coelution of threonine and glycine, favored the time for the chromatographic run and did not impair the determination and the reliability of other validated amino acids.
The results of the linearity limits of detection and quantiication method were satisfactory.
The greatest variation found in the intra-assay (12.3%) was attributed to aspartate and can be explained by the lower concentration level for this amino acid (10 µmol/l). Comparing the results obtained in the intra-assay precision with the biological
variation(21) described in Table 4, it is observed that all variations
found in this study were lower than the established biological
variation.
In the inter-assay, glutamine showed the greatest variation (15.2%-concentration of 180 µmol/l). This variation found was even higher than the within-subject biologic variation(21) described
in Table 4. The variability attributed to glutamine may be connected to the gradient that starts exactly at the retention time of the glutamine, thus inluencing the increased variability. Fekkes (1996) assessed the inter-assay precision (n = 12) using HPLC and OPA-derivatization, the author also noted that the amino acid glutamine presented the greatest variation (25%) in the study.
For other amino acids, all variations in the inter-assay precision were less than the biological variation contained in Table 4.
Determination of reference intervals
The number of individuals included in control group is similar to other studies that established reference intervals for plasma amino acids in children, such as Gregory et al. (1986)(9),
taBLE 3 − Linearity, limit of detection and quantiication of the method
Compound Range (nmol/ml)
Linearity (nmol/ml) r
2a LOD
b
(nmol/ml) LQc
(nmol/ml)
Aspartate 100-400 400 0.993 0.67 2
Glutamate 150-1500 1500 0.990 1.67 5
Asparagine 150-1500 1500 0.996 1.67 5
Histidine 100-550 550 0.990 1.67 5
Serine 150-1500 1500 0.995 1.67 5
Glutamine 150-1500 1500 0.991 2.33 7
Arginine 100-550 550 0.991 1.67 5
Tyrosine 150-1500 1500 0.994 1.67 5
Alanine 150-1050 1050 0.990 3.33 10
Tryptophan 150-1500 1500 0.992 1.67 5
Methionine 100-400 400 0.992 1.67 5
Valine 150-1500 1500 0.996 1.67 5
Phenylalanine 150-1500 1500 0.993 3.33 10
Isoleucine 150-1500 1500 0.9903 1.67 5
Leucine 150-1500 1500 0.9943 3.33 10
r2a: coefficient of determination; LODb: limit of detection; LQc: limit of quantification.
taBLE 4 − Precision of the method
CVa (%) Biological variation (%)
Compound Precision Concentration 1 Concentration 2 Concentration 3 CVid CVge
Aspartate Intrab 12.3 4.84 5.1 31.2 55.1
Interc 10.6 5.45 11.9
Glutamate IntraInter 4.577.1 6.134.8 6.134.9 46.4 79.9
Asparagine IntraInter 4.675.45 4.816.22 7.946.92 12.3 28
Histidine Intra 7.42 4.76 6.85 9.7 22.7
Inter 8.95 6.46 7.21
Serine Intra 5.1 4.7 6.51 12.8 42.8
Inter 6.24 4.36 9.73
Glutamine IntraInter 5.0415.2 5.675.1 10.354.62 12.1 22
Arginine IntraInter 10.7910.56 6.068.04 6.656.04 19.3 34.1
Tyrosine Intra 2.93 4.38 5.32 10.5 61
Inter 5.62 3.21 10.22
Alanine Intra 9.16 5.64 6.98 14.7 55.8
Inter 9.21 4.51 11.29
Tryptophan IntraInter 3.344.04 5.073.35 3.426.16 22.7 152.6
Methionine Intra 3.58 4.42 4.74 14.7 43.4
Inter 6.89 3.5 9.71
Valine Intra 1.52 3.66 4.98 17.4 25.4
Inter 5.04 5.19 9.48
Phenylalanine IntraInter 4.576.57 3.813.89 4.967.04 9.5 40.6
Isoleucine IntraInter 3.515.17 3.594.76 7.896.41 15.5 45.5
Leucine Intra 2.14 2.89 4.56 14.4 44
Inter 5.87 3.23 7.98
aCV: coefficient of variation; bIntra: intra-assay (n = 3); cInter: inter-assay (n = 3 days; n = 3 replicates); dCVi: coefficient of variation within-subject biological variation(21); eCVg: coefficient of variation between-subject biological variation(21).
figurE 1 − Determination of amino acids in aqueous matrix by HPLC
Aspartate (100 nmol/ml), glutamate (250 nmol/ml), asparagine (25 nmol/ml), histidine (100 nmol/ml), serine (140 nmol/ml), glutamine (350 nmol/ml) arginine (150 nmol/ml), tyrosine (180 nmol/ml), alanine (350 nmol/ml), tryptophan (150 nmol/ml), methionine (100 nmol/ml), valine (250 nmol/ml), phenylalanine (180 nmol/ml), isoleucine (180 nmol/ml) and leucine (250 nmol/ml).
HPLC: high performance liquid chromatography.
Leucine 79.89
3.800 3.600 3.400 3.200 3.000 2.800 2.600 2.400 2.200 2.000 1.800 1.600 1.400 1.200 1.000 800 600 400 200 0
Fluorescence
0 10 20 30 40 50 60 70 80 90
Minutes
Aspartate 10.55
Glutamate 14.54
Asparagine 18.20
Histidine 21.78
Serine 24.34
Glutamine 26.42
Arginine 33.23
Tyrosine 40.79
Alanine 41.75
Tryptophan 50.27 Methionine 53.33
V
aline 56.05
taBLE 5 − Recovery
Compound *Recovery %
Concentration 1 Concentration 2 Concentration 3 Aspartate 94.3 ± 9.8 104.8 ± 5.1 99 ± 10.3
Glutamate 103.7 ± 7.9 98.8 ± 3.5 108.6 ± 2.1 Asparagine 107.8 ± 5.9 87.9 ± 5.6 105.2 ± 5.5
Histidine 91.1 ± 8.4 104.4 ± 2.3 109.7 ± 6.3
Serine 105.1 ± 6.8 90.2 ± 3.3 97.7 ± 9.4
Glutamine 101.7 ± 6.9 104.6 ± 4.3 104.9 ± 6.3
Arginine 106.3 ± 5.4 112.3 ± 6.1 103.2 ± 5.8 Tyrosine 99.8 ± 6.1 95.8 ± 1.5 100.8 ± 10.9
Alanine 101 ± 8.8 106.9 ± 2.3 96.3 ± 8.6 Tryptophan 85.8 ± 3.4 93.1 ± 0.8 97.1 ± 6.3
Methionine 104.7 ± 7.9 99.1 ± 1.7 95.6 ± 9.8 Valine 104.6 ± 5.9 105.3 ± 5.4 106.7 ± 7.5
Phenylalanine 103.8 ± 7.2 98.9 ± 3.2 102.6 ± 7.2 Isoleucine 100.8 ± 5.6 97.6 ± 4.8 96.6 ± 4.9 Leucine 106.8 ± 7 98.4 ± 3.1 106.1 ± 8.8 *n = 3.
taBLE 6 − Reference ranges for plasma amino acids
Amino acids (nmol/ml) Reference intervals
Lower limit (CI 90%) Upper limit (CI 90%)
Aspartatea 3 (3-4) 20 (16-24)
Glutamatea 55 (47-65) 341 (294-397)
Asparagine 17 (12-24) 95 (87-102)
Histidine 38 (26-50) 158 (144-170)
Serine 56 (47-65) 166 (155-175)
Glutamineb 367 1252 (1103-1363)
Arginine 35 (28-43) 129 (120-137)
Tyrosine 32 (25-38) 106 (97-114)
Alaninea 167 (152-186) 604 (533-669)
Tryptophana 34 (30-38) 102 (90-115)
Methionine 13 (11-15) 31 (29-33)
Valine 125 (112-140) 280 (265-295)
Phenylalanine 36 (32-40) 78 (73-82)
Isoleucine 35 (32-39) 79 (75-83)
Leucineb 70 (62-78) 160 (150-168)
CI: confidence interval; a: interval by robust method calculated after logarithmic
transformation; b: interval calculated by Horn and Pesce method (2005)(17).
Using the method of Reed to identify outliers, a unique value for histidine was considered suspect. The Clinical and Laboratory Standards Institute (CLSI)(16) recommends that, unless it is a
clinically aberrant observation, the value should be kept in the sample and, therefore, this data was not excluded in the analysis.
The data obtained was compared with the control group values published by Strauss et al. (2010)(12). In this work the authors
utilized a group of 51 healthy Mennonites children to establish reference intervals and to monitor children with maple syrup urine disease, an inborn error of metabolism disorder of branched-chain amino acids. The study was chosen for comparison because it used similar analytical technique and sample size. Nevertheless, statistically signiicant differences in seven out nine amino acids analyzed were found (Table 7). These indings can be explained by differences in population and exclusion criteria, since the authors only excluded children with organic acidemia, and other metabolic diseases were probably included. However it is more likely that the statistical differences are related to analytical method. According to Shih (2003)(13), serum amino acids can
demonstrate important variations between laboratories, even when similar analysis tools are used and, therefore, the establishment of own reference intervals by each laboratory is indicated. This procedure results in tests with greater reliability and eliminated biases that might interfere with the analysis of the results of clinical research. If such study is not possible, it is recommended the use of revalidation techniques of reference ranges from other laboratories, but with greater caution in interpreting the results(16).
The comparison with literature data was limited by the fact that
in the study of Strauss et al. (2010)(12) the amino acids aspartate,
glutamate, asparagine, serine, arginine and alanine were not analyzed. The study of Gregory et al. (1986)(9) was not utilized for
statistical analysis because it does not present similar analytical
Age (years)
Frequency Male
Female
2 3 4 5 6 7 8 9 10 11 12 13 14
10 9 8 7 6 5 4 3 2 1 0 1 1 1 1 1 1 1 3 3 3 3
3 3 3
4 5 5 2 2 2 2 2 2 2 2 2
figurE 2 − Distribution of individuals according to their gender and age groups. The heights of the bars represent the frequencies of children for each gender
taBLE 7 − Comparison of amino acids values with international literature data
Amino acids Measures of Central tendency (DP/min-max) p value Present study Strauss et al. (2010)(18)
Histidine 100 (29) 87 (29)a 0.001
Glutamine 627 (335-1415) 527 (146)b 0.000
Tyrosine 72 (18) 63 (24)a 0.000
Tryptophan 61 (17) 50 (19)a 0.000
Methionine 22 (5) 31 (10)a 0.000
Valine 204 (38) 207 (65)a 0.517
Phenylalanine 58 (10) 55 (18)a 0.027
Isoleucine 57 (11) 65 (25)a 0.000
Leucine 113 (80-177) 119 (38)b 0.204
methodology. The same occurred with the study of Lepage et al.
(1997)(10) due to lack of descriptive data, such as normality test,
mean, median, minimum and maximum, necessary to statistical analysis. No appropriate study describing reference intervals for amino acids in children was found in national literature to comparison.
ConCLuSion
The validated method demonstrated satisfactory linearity, precision, recovery, limits of quantiication and detection, and it can be applied in the routine clinical practice. The study suggests that each laboratory should adopt its own reference intervals for amino acids in plasma. Even so, if this is not possible, the described reference
rEfErEnCES
1. Jimenez-Sanchez G, Childs B, Valle D. The effect of mendelian disease on human health. In: Scriver CR, Beaudet AL, Valle D, et al., editors. The metabolic and molecular bases of inherited disease. 8 ed. New York: McGraw-Hill; 2001. p. 67-174.
2. Araújo APQC. Psychiatric features of metabolic disorders. Rev Psiq Clin. 2004; 31(6): 285-9.
3. Saudubray JM, Sedel F, Walter JH. Clinical approach to treatable inborn metabolic diseases: an introduction. J Inherit Metab Dis. 2006; 29(2): 261-74.
4. Fernandes J, Saudubray JM, Tada K. Inborn metabolic diseases. Berlin: Springer-Verlag; 1990.
5. Green A. Guide to diagnosis of inborn errors of metabolism in district general hospitals. J Clin Pathol. 1989; 42(1): 84-91.
6. Suskind RM, Lewinter-Suskind L. Textbook of pediatric nutrition. New York: Raven Press; 1993.
intervals should be use in the Brazilian population in substitution to the international reference values, in order to eliminate the population bias. Once the early diagnosis is very important for better outcomes, reference intervals for plasma amino acids in Brazilian children aged between 0 and 2 years should also be established.
aCknowLEDgMEntS
The authors thank to the Fundação de Amparo à Pesquisa do Estado de Minas Gerais (FAPEMIG) for the inancial support and master degree scholarship and to Hermes Pardini laboratory for
the partnership in method development and amino acids analysis of the children included in this study.
rESuMo
Introdução: A cromatografia líquida de alta eficiência é uma técnica utilizada para quantificação de aminoácidos no plasma. A definição de intervalos de referência na população é importante para o diagnóstico e o monitoramento de indivíduos com aminoacidopatias. Objetivos:
Os objetivos do presente estudo foram validar um método de quantificação de aminoácidos e definir intervalos de referência em crianças brasileiras. Resultados: Boa separação cromatográfica foi obtida utilizando uma coluna de núcleo sólido C18. O método apresentou linearidade, limites de detecção e quantificação, precisão e acurácia satisfatórios. Os intervalos de referência para aspartato, glutamato, asparagina, histidina, serina, glutamina, arginina, tirosina, alanina, triptofano, metionina, valina, fenilalanina, isoleucina e leucina foram definidos em um grupo de 60 indivíduos sadios com idade entre 2 e 14 anos. Conclusão: A técnica apresentada pode ser aplicada na prática clínica. Cada laboratório deve, preferencialmente, estabelecer os próprios intervalos de referência. Se não for possível, recomenda-se a utilização dos intervalos de referência descritos neste estudo para o diagnóstico e o monitoramento de crianças brasileiras nessa faixa etária.
Unitermos: cromatografia líquida; erros inatos do metabolismo; aminoácidos; valores de referência.
7. Fekkes D. State-of-the art of high performance liquid chromatographic analysis of amino acids in physiological samples. J Chromat B. 1996; 682(1): 3-22.
8. Zschocke J, Hoffmann GF. Vademecum metabolicum. Friedrichsdorf: Milupa GmbH&Co. KG; 2004.
9. Gregory DM, Sovetts D, Clow CL, Scriver CR. Plasma free amino acid values in normal children and adolescents. Metabolism. 1986; 35(10): 967-9. 10. Lepage N, McDonald N, Dallaire L, Lambert M. Age-speciic distribution of plasma amino acid concentrations in a healthy pediatric population. Clin Chem. 1997; 43(12): 2397-402.
11. Shapira E, Blitzer MG, Miller JB, Africk DK. Biochemical genetics: a laboratory manual. 1 ed. Oxford: Oxford University Press; 1989. 12. Strauss KA, Wardley B, Robinson D, et al. Classical maple syrup urine disease and brain development: principles of management and formula design. Mol Genet Metab. 2010; 99(4): 333-45.
14. Bremer HJ, Duran M, Kamerlingh JP, Przyrembel H, Wadman SK. Disturbances of amino acid metabolism: clinical chemistry and diagnosis. Baltimore: Urban and Schwarzemberg; 1981.
15. Reed AH, Henry RJ, Mason Wb. Inluence of statistical method used on the resulting estimate of normal range. Clin Chem. 1971; 17: 275-84. 16. Clinical and Laboratory Standards Institute (CLSI). Deining, establishing, and verifying reference intervals in the clinical laboratory. Pennsylvania: Clinical and Laboratory Standards Institute; 2008. 17. Horn P, Pesce AJ. Reference intervals – a user’s guide. Washington: AACC Press; 2005.
18. Lindroth P, Hamberger A, Sandberg M. Liquid chromatographic determination of amino acids after precolumn fluorescence derivatization. In: Boulton AA, Baker GB, Wood J. Neuromethods. Humana Press; 1986. p. 97-116.
19. Molnár-Perl I. Advancement in the derivatizations of the amino groups with the o-phthaldehyde-thiol and with the 9-luorenylmethyloxycarbonyl chloride reagents. J Chromat B. 2011; 879(17): 1241-69.
20. Liu H. Measurement of blood plasma amino acids in ultrailtrates by high-performance liquid chromatography with automatic precolumn o-phthaldialdehyde derivatization. In: Cooper C. Amino acid analysis protocols (Methods in Molecular Biology). New Jersey: Humana Press Inc; 2001. p. 123-40.
21. Minchinela J, Ricós C, Perico C, et al. Base de datos de los componentes de variación biológica, con las especiicaciones de la calidad analítica (deseable, mínima y óptima) [Internet]. 2014. Available in: http:// www.seqc.es/es/Comisiones/18/9/102/Base_de_datos_de_Variacion_ biologica_%7C_Comision_de_Calidad_Analitica_%7C_Comite_ Cientiico/#usos.
CorrESPonDing author
Ana Facury da Cruz