Unraveling Brazilian Indian population prostate good health:
clinical, anthropometric and genetic features
_______________________________________________
Mario M. de Lima Junior
1, Leonardo O. Reis
1, Ubirajara Ferreira
1, Ulieme Oliveira Cardoso
1, Raquel
Bueno Barbieri
1, Gustavo B. de Mendonça
1, Laura S. Ward
11 Departments of Genetics and Urology, School of Medical Sciences, University of Campinas, UNICAMP,
Campinas, São Paulo, Brazil
ABSTRACT
ARTICLE
INFO
______________________________________________________________ ______________________
Purpose: To compare dietary, lifestyle, clinical, anthropometric, genetic and prostatic features of Brazilian Indians and non-Indians (Amazon).
Methods: 315 men, 228 Indians and 89 non-Indians, ≥40 years old were submitted to digital rectal examination, serum prostate specific antigen (PSA), testosterone, TP53 and GSTP1 genotyping, anthropometric, lifestyle, dietary, personal and familial medi-cal history. Prostatic symptoms were evaluated with the International Prostate Symp-tom Score (IPSS).
Results: Macuxis and Yanomamis represented 43.6% and 14.5% of Indians respectively who spontaneously referred no prostate symptoms. Mean IPSS was 7, range 3-19, with only 15% of moderate symptoms (score 8-19); Mean age was 54.7 years, waist circu-mference 86.6 cm, BMI 23.9 kg/m2. Yanomamis presented both lower BMI (21.4 versus 24.8 and 23.3, p=0,001) and prostate volume than Macuxis and “other ethnic groups” (15 versus 20, p=0.001). Testosterone (414 versus 502 and 512, p=0.207) and PSA (0.48
versus 0.6 and 0.41, p=0.349) were similar with progressive PSA increase with aging. Val/Val correlated with lower PSA (p=0.0361).
Indians compared to control population presented: - TP53 super representation of Arg/ Arg haplotype, 74.5% versus 42.5%, p<0.0001. -GSTP1 Ile/Ile 35.3% versus 60.9%; Ile/ Val 45.9% versus 28.7%; Val/Val 18.8% versus 10.3%; p=0.0003.
Conclusions: Observed specific dietary, lifestyle, anthropometric and genetic profile for
TP53 and GSTP1 may contribute to Brazilian Indian population prostate good health.
Key words:
Prostatic Diseases; Neoplasms; Tumor Suppressor Protein p53; GSTP1 protein, human [Supplementary Concept]; Testosterone; Genetic Therapy; Polymorphism, Genetic
Int Braz J Urol. 2015; 41: 344-52
_____________________
Submitted for publication: April 22, 2014
_____________________
Accepted after revision: September 05, 2014
INTRODUCTION
The Indian populations in Brazil and in other countries worldwide are not well studied, with rare published reports. The study of culturally distinct indigenous populations, as well as their contact with and influence of non-indigenous groups in relation to their behavior and merging of new habits as risk factors for prostate diseases is intriguing.
Age, black race and familial history of cancer are well stablished factors for high risk of prostate cancer (1). Most studies suggest that the ingestion of fatty food, cooked food, selenium, ex-posure to pesticides and fertilizers, physical activity and socio-economic status are factors that can con-tribute to observed differences in many countries, regions or eventually races (3).
Variations of frequency of PCa among Cau-casians, native Alaskans and Indians are well do-cumented in the USA (4, 5). However, in the indige-nous population of Brazil, data regarding incidence, prevalence and risk factors for prostate disease are rare and only a few studies addressed clinical and anthropometric data in that population (6-8).
In view of scarce information about the profile of male health of indigenous populations of extreme North of Brazil, we decided to analyze
GSTP1 and TP53 polymorphisms, PSA and tes-tosterone serum values and digital rectal exam, correlating the results with anthropometric cha-racteristics, lifestyle, and especially dietary habits in order to elucidate the interaction of genetic ba-ckground and environmental exposure in relation to prostatic diseases.
MATERIALS AND METHODS
From March, 2010, to March, 2011, a to-tal of 315 healthy men with 40 or more years old were prospectively evaluated by the same exa-miner, after signing a written consent form. 228 Indians were admitted to Indian House of Health in Boa Vista, Roraima, Brazil (CASAI/RR), through a campaign, and 87 non-indigenous healthy men that donated blood were included in the control group. They resided in the Boa Vista Region, Bra-zil. Those who presented a personal or family his-tory of prostate cancer were excluded.
Polymorphisms of codon 72 of TP53 and
GSTP1 were analyzed; they are involved in the detoxification and repair of DNA (9) (Figure-1). The data were correlated to anthropometric va-lues, lifestyle habits, serum PSA and testosterone and digital rectal exam (DR) of the indigenous po-pulations of northern Brazil. Prostatic symptoms were evaluated with the IPSS (International Pros-tate Symptom Score) questionnaire validated to Portuguese (10).
Genomic DNA was extracted using the standard protocol of phenol-chlorophorm,
adap-Gene Repair of
cellular death Environment
Carcinogens Metabolism DNA ligation
Repair of cellular death - TP 53
Genetic damages
Cancer Detoxification
Excretion Metabolism
Detoxification CYP1A1 m1
CYP1A2*F
GSTP1 NAT2
ted from the Cancer Genetic Molecular Laboratory of the University of Campinas-Unicamp, Brazil. In order to verity the DNA purity and quality of the extract, the samples were quantified using the UV--spectrophotometer Picodrop Limited (Cambrid-geshire, UK).
Genotyping of the two proposed poly-morphisms GSTP1 codon 105 (rs1695) and TP53 codon 72 (rs1042522) was conducted using Ta-qMan® SNP Genotyping (7500 Real Time PCR Systems) essay.
In order to understand the impact of the introduction of new dietary habits, lifestyle and behaviors from the non-indigenous population, we identified and compared two different ethnic groups, with bigger and smaller distance from the urban centers, with consequent greater of smaller contact and merging of habits of non-indigenous people: respectively, Macuxis and Yanomamis.
All local authorities were officially notified (FUNASA and CASAI), and agreed with this research.
Statistical analysis
Categorical variables were compared using the exact Fisher test of Chi-square test, as appropria-ted. Non-normally distributed numerical variables were compared using the Mann-Whitney test (two groups) or Kruskal-Wallis (three of more groups).
The analysis of allelic and genotypic fre-quencies was made using the laws of equilibrium of Hardy-Weinberb. Values with P<0.05 were con-sidered statistically significant.
RESULTS
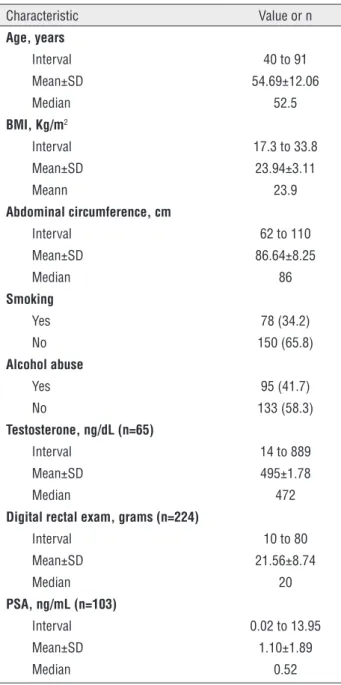
No Indian reported prostatic symptoms; median age was 54.7 years, abdominal circu-mference was 86.6 cm and BMI was 23.9 kg/ m2; 64.8% had normal BMI (18.5 to 25,0 kg/m2),
29.5% overweight (25,0 to 30 kg/m2), 3.5%
obesi-ty (≥30.0 kg/m2) and 2.2% low weight (<18.5 kg/
m2). Median PSA was 0.52 with values ≤2.5 ng/
mL in 91.3%, >2.5 ng/mL in 9 cases (8.7%), and 5.8% with PSA ≥4 ng/mL (Table-1). Control group is described at Table-2.
83 Indians completed the question form; mean age was 53 years. Most informed absence of
Table 1 - Clinical and laboratory characteristics of Indians (n=228).
Characteristic Value or n Age, years
Interval 40 to 91
Mean±SD 54.69±12.06
Median 52.5
BMI, Kg/m2
Interval 17.3 to 33.8
Mean±SD 23.94±3.11
Meann 23.9
Abdominal circumference, cm
Interval 62 to 110
Mean±SD 86.64±8.25
Median 86
Smoking
Yes 78 (34.2)
No 150 (65.8)
Alcohol abuse
Yes 95 (41.7)
No 133 (58.3)
Testosterone, ng/dL (n=65)
Interval 14 to 889
Mean±SD 495±1.78
Median 472
Digital rectal exam, grams (n=224)
Interval 10 to 80
Mean±SD 21.56±8.74
Median 20
PSA, ng/mL (n=103)
Interval 0.02 to 13.95
Mean±SD 1.10±1.89
Median 0.52
symptoms or light symptoms (score ≤7) and only 15% moderate symptoms (score 8-19); IPSS varied from 3 to 19, median 7.
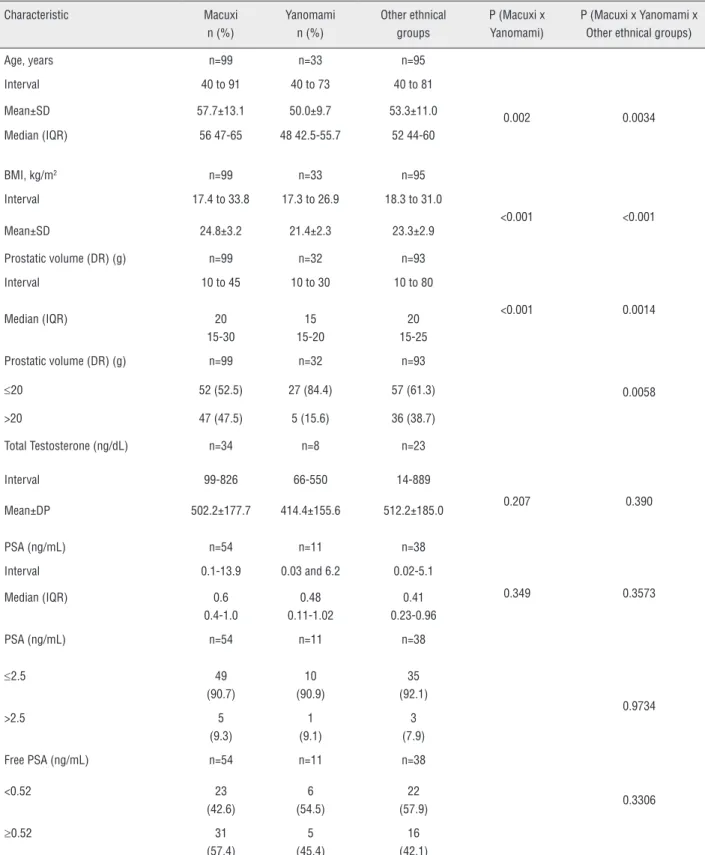
When the ethnic groups were compared, the Yanomamis were younger with lower values of BMI and lower prostate volume at DR. There were no differences between testosterone and PSA levels, and PSA increased with age (Table-3).
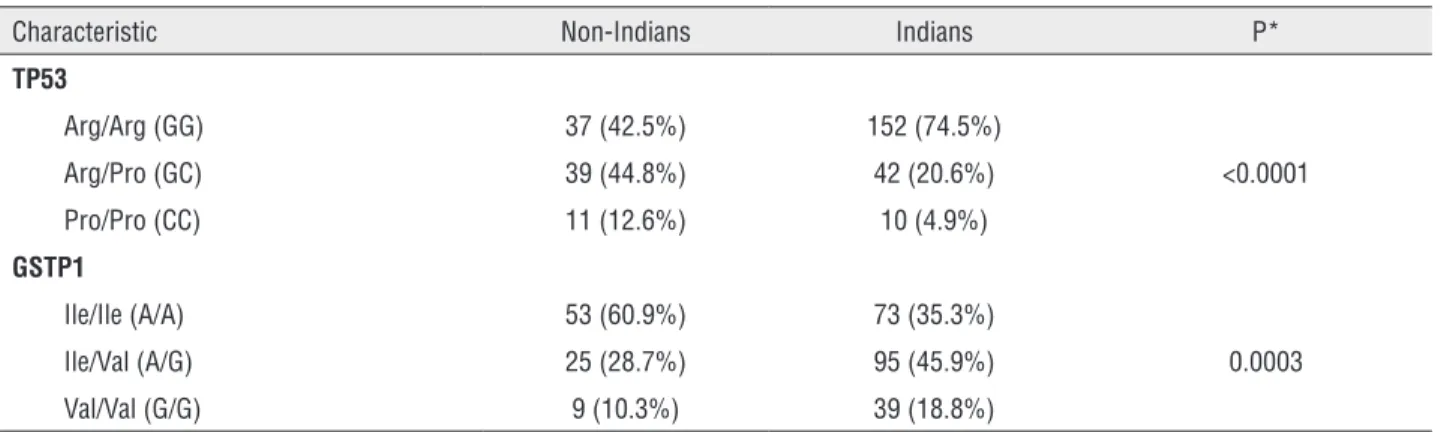
Indian and non-indigenous showed super--representation of haplotype Arg/Arg, 74.5% ver-sus 42.5%, p<0.0001, polymorphism TP53 and Ile/Ile 35.3% versus 60.9%; Ile/Val 45.9% ver-sus 28.7% and Val/Val 18.8% verver-sus 10.3%, for GSTP1, p=0.0003, respectively (Table-4).
We observed an association of GSTP1 ge-notype and serum PSA, with predominance of polymorphic homozygous genotype Val/Val in in-dividuals with lower PSA levels (p=0.0361).
Tables 5 and 6 show demographic and cli-nical characteristics, according to variants of TP53 and GSTP1, respectively.
DISCUSSION
Our data show that the indigenous popu-lation presents low prostate volume, BMI close to normality and healthy dietary habits, different from the Brazilian population. Also, Indians pre-sent lower incidence of prostatic symptoms (ac-cording to IPSS, only 15% moderate) in relation to non-indigenous Brazilians with same age eva-luated in a screening program of prostate cancer
(29%, with 24% of moderate symptoms and 5% with severe symptoms (11).
Among the ethnic groups, the Yanomamis were younger, with lower values of BMI and pros-tatic volume, although with similar serum values of PSA and testosterone.
The analysis of polymorphism of TP53 co-don 72 and GSTP1 demonstrated significant diffe-rences between Indians and non-indigenous and the homozigous polymorphic genotype Val/Val was related to significant lowers levels of serum PSA.
These differences may be related to age di-fferences, but also due to behavior and dietary ha-bits between the ethnic groups, although without clinical significant difference of age in regard to prostatic evaluation. The greater contact of the Macuxi population with non-indigenous popula-tions may have merged new behavior and dietary habits similar to non-Indians.
In contrast, the greater geographic dis-tance from urban centers may have contributed to preservation of dietary habits and lifestyle of the Yanomamis. In this group, all participants ate animal hunt meat and fish, none reported ingestion of bovine meat and only two reported chicken ingestion.
Also, genetic differences associated to ra-cial and ethnical factors have influence on the predisposition to prostatic diseases. Recently our group identified genetic polymorphisms related to the metabolism of carcinogens that can distin-guish patients with high or low risk of PCa or be-nign prostatic hyperplasia (12).
The incidence of prostate cancer in the Brazilian Indian population is unknown. At “Hos-pital Geral de Roraima (Saúde Indígena Hospita-lar)”, reference to this ethnical group, there were 10 cases per year (median) in the last 5 years.
Several studies have demonstrated that American Indians present low risk for PCa (13-15). In one of the first studies that described the epidemiological profile of Indians compared to white Americans, Dunham et al. (1973) identified similar prevalence of PCa among groups (5). On the contrary, Gilland et al. (1998) found different patterns of incidence and mortality of PCa among American Indians, blacks, Hispanics from New
Table 2 - Demographic characteristic of non-Indians (controls).
Characteristic n (%)
Age, years (n=87)
Interval 18 to 86
Mean±SD 41.1±15.3
Median (IQR) 39 (30-51)
Ethnical group (n=87)
White 66 (75.9%)
Non-white 21 (24.1%)
Smoking (n=45)
Yes 9 (20.0%)
No 36 (80.0%)
Table 3 - Demographic and clinical characteristic of Macuxis, Yanomamis and “others ethnical groups”.
Characteristic Macuxi n (%)
Yanomami n (%)
Other ethnical groups
P (Macuxi x Yanomami)
P (Macuxi x Yanomami x Other ethnical groups)
Age, years n=99 n=33 n=95
Interval 40 to 91 40 to 73 40 to 81
0.002 0.0034
Mean±SD 57.7±13.1 50.0±9.7 53.3±11.0
Median (IQR) 56 47-65 48 42.5-55.7 52 44-60
BMI, kg/m2 n=99 n=33 n=95
Interval 17.4 to 33.8 17.3 to 26.9 18.3 to 31.0
<0.001 <0.001
Mean±SD 24.8±3.2 21.4±2.3 23.3±2.9
Prostatic volume (DR) (g) n=99 n=32 n=93
Interval 10 to 45 10 to 30 10 to 80
<0.001 0.0014
Median (IQR) 20
15-30
15 15-20
20 15-25
Prostatic volume (DR) (g) n=99 n=32 n=93
≤20 52 (52.5) 27 (84.4) 57 (61.3) 0.0058
>20 47 (47.5) 5 (15.6) 36 (38.7)
Total Testosterone (ng/dL) n=34 n=8 n=23
Interval 99-826 66-550 14-889
0.207 0.390
Mean±DP 502.2±177.7 414.4±155.6 512.2±185.0
PSA (ng/mL) n=54 n=11 n=38
Interval 0.1-13.9 0.03 and 6.2 0.02-5.1
0.349 0.3573
Median (IQR) 0.6
0.4-1.0
0.48 0.11-1.02
0.41 0.23-0.96
PSA (ng/mL) n=54 n=11 n=38
≤2.5 49
(90.7)
10 (90.9)
35 (92.1)
0.9734
>2.5 5
(9.3)
1 (9.1)
3 (7.9)
Free PSA (ng/mL) n=54 n=11 n=38
<0.52 23
(42.6)
6 (54.5)
22
(57.9) 0.3306
≥0.52 31
(57.4)
5 (45.4)
16 (42.1)
Table 4 - Frequency of variants TP53 and GSTP1 in non-Indians and Indias.
Characteristic Non-Indians Indians P*
TP53
Arg/Arg (GG) 37 (42.5%) 152 (74.5%)
Arg/Pro (GC) 39 (44.8%) 42 (20.6%) <0.0001
Pro/Pro (CC) 11 (12.6%) 10 (4.9%)
GSTP1
Ile/Ile (A/A) 53 (60.9%) 73 (35.3%)
Ile/Val (A/G) 25 (28.7%) 95 (45.9%) 0.0003
Val/Val (G/G) 9 (10.3%) 39 (18.8%)
A=Adenin; Arg=Arginin; C=Citosine; G=Guanine; Ile=Isoleucin; Pro=Proline; Val=Valin.
*Chi-square
Table 5 - Demographic and clinical characteristics according to P53 variant.
Factors Arg/Arg
n (%)
Arg/Pro n (%)
Pro/Pro n (%)
P
Ethnical group n=151 n=42 n=10
Macuxi 70 (46.4) 13 (30.9) 2 (20)
Yanomami 21 (13.9) 7 (16.7) 0 0.0637*
Other ethnical groups 60 (39.7) 22 (52.4) 8 (80)
Smoking n=152 n=42 n=10
No 55 (38.7) 15 (35.7) 4 (40.0) 0.9674*
Yes 97 (63.8) 27 (64.3) 6 (60.0)
Alcohol abuse n=152 n=42 n=10
No 65 (42.8) 16 (38.1) 7 (70) 0.1840*
Yes 87 (57.2) 26 (61.9) 3 (30)
Age, years n=152 n=42 n=10
Interval 40.0 a 91.0 40.0 a 81.0 40.0 a 78.0
Median (IIQ) 52.0 (44.0-63.0) 54.5 (45.0-61.0) 56.0 (47.0-68.0) 0.7303**
IIQ=interval interquartil; Arg=Arginin; Pro=Prolin.
*Chi-square; **Kruskal-Wallis.
Mexico and non-hispanic whites, with the lower incidence among Indians (1).
Although different incidences of PCa among ethnic groups exist due to different scre-ening methods and access to health care (13), se-veral exogenous risk factors may contribute to the disparity of risks, including dietary habits, lifesty-le and genetic predisposition (16).
The association of prostate cancer, inges-tion of saturated fat, BMI and physical activity was observed in many ethnic groups (14), along with the association of the size of body, in particu-lar waist-hip, with PCa in Chinese men (17).
increa-Table 6 - Demographic and clinical characteristic, according to GSTP1 variant.
Fatores Ile/Ile
n (%)
Ile/Val n (%)
Val/Val n (%)
P
Ethnical group n=73 n=94 n=39
Macuxi 29 (39.7) 42 (44.7) 16 (41.0) 0.6513*
Yanomami 12 (16.4) 14 (14.9) 3 (7.7)
Other ethnical groups 32 (43.8) 38 (40.4) 20 (51.3)
Smoking n=73 n=95 n=39
No 27 (37.0) 33 (34.7) 14 (35.9) 0.9553*
Yes 46 (63.0) 62 (65.3) 25 (64.1)
Alcohol abuse n=73 n=95 n=39
No 37 (50.7) 38 (40.0) 15 (38.5) 0.2997*
Yes 36 (49.3) 57 (60.0) 24 (61.5)
Age, years
Interval 40.0 a 88.0 40.0 a 91.0 40.0-84.0 0.3975**
Median (IIQ) 50.0 (44.0-63.0) 53.0 (45.0-62.0) 55.0 (45.2-64.7)
IIQ=interval interquartil; Ile=Isoleucin; Val=Valin.
*Chi-square: **Kruskal-Wallis
sing three to seven times the incidence of PCa in first generation of American Japanese and Chine-se, whose fathers migrated to USA (18, 19). Ho-wever, the impact of diet is still controversial and data related to Indian nutritional status are rare.
In men, testosterone is the main circu-lating androgen, with major role in male phy-siology, in particular prostate. We observed that Yanomamis present lower levels of testosterone (414 ng/dL) in relation to other ethnic groups (502/512 ng/dL), but still within normal limits (350-1000 ng/dL).
We have also observed a particular diffe-rence of size and consistency of prostate during DR in Indians in relation to non-indigenous pa-tients. It was observed a “minimum” gland with a more fibroelastic consistency, sometimes not de-tectable during digital rectal exam in the Indian population. We think that, more than isolated hor-monal factors, the ingestion of several plants and the genetic background are the principal causes of this characteristic of physical exam of Indians.
The analysis of serum PSA using
diffe-had total PSA≥4.0 ng/mL and 8.7% >2.5 ng/mL. In accordance to other studies (20-23), we have observed a rise of PSA levels with age in our po-pulation, indicating that the rise of PSA with age of Brazilian Indians is in accordance to general population.
In our casuistic abdominal circumference (90 cm is the threshold value) did not correlated to lower urinary tract symptoms (obstructive and/or irritative), as well as to prostatic cancer, in accor-dance do European results (24, 25).
Genetically, our data show that none pa-tients of Yanomami group presented the genotype Pro/Pro of p53, compared to 2.02% of Macuxi, 8.3% in other ethnic groups and 12.6% in the con-trol group, highlighting the miscegenation of the genotype Pro/Pro of p53.
Genotypic divergence of Yanomami po-pulation may be explained by intercrossing of consanguineous marriages, and the genes being transmitted from only one ancestral. Another aspect is the subdivision of population in iso-lated groups, separated by geographic, political, socioeconomic, religious and cultural barriers, preventing the exchange of genes by interethnic marriages (29).
When we evaluated the genotypic profile results of GSTP1, again we observed difference between Indians and non-Indians. The frequency of variant genotypes Ile/Val and Val/Val is lower among Indians, raising again the hypothesis of the above factors for p53 being related to such genotypic profile. Among the Yanomami studied, the homozygous genotype Val/Val was observed in only three cases (7.7%).
A meta-analysis study of genotypes GSTM1, GSTT and GSTP1 including 11 studies (2.528 patients and 3.076 controls) concluded that these three polymorphisms are not important fac-tors for the susceptibility to PCa (30) but Indian populations were not represented.
In our sample, the number of participants per ethnic group is relatively small and the es-timates of race, ethnic group and comparison among groups were restricted to Macuxis, Yano-mamis and “other ethnic groups” as a third group. On the other hand, this study so far is one with the biggest casuistic of Amazon Indians eva-luated urologically, anthropometrically and gene-tically (P53 codon 72 and GSTP1). Although with a restrict number of controls (n=87), the results suggest differences of the genetic profile of In-dians, maybe related to risk-protection patterns that explain the low prostate volume and the rela-tively low incidence of prostatic diseases in these populations.
Limits of the study: although we had not compared dietary details with the ingestion of sa-tured fat or industrial products among ethnical groups, it is evident that hunt meat is the basis of Indian diet; although the detailed comparison between ethnical groups more or less culturalized was obtained, the comparison with the control group of non-indigenous individuals was limited to genetic, age and tobacco use.
New Indian population studies are necessa-ry to measure and follow the epidemiological mo-difications due to contact among Indians and non--Indians, in order to stablish health care guidelines, in particular preventive ones, directed to the new reality of the studied population. These new studies may reveal the impact of inheritance of detoxifica-tion genes as polymorphisms of GSTP1 and TP53, along with the recognition and elimination of toxic dietary products related to prostatic diseases.
CONCLUSIONS
Indians, in particular Yanomamis, present low prostatic volume, lower BMI and different geno-typic profile of GSTP1 and TP53 codon 72, althou-gh with similar PSA and testosterone levels to other ethnic groups. These aspects may be related to good prostatic health of the studied indigenous population.
CONFLICT OF INTEREST
None declared.
REFERENCES
1. Gilliland, FD, Key, CR. Prostate cancer in American Indians, New Mexico 1969 to 1994. J Urol. 1998;159:893-7.
2. Nelson WG, De Marzo AM, Isaacs WB: Prostate cancer. NEJM. 2003; 349: 366-81.
3. Schulman CC, Ekane S, Zlotta RA: Nutrition and cancer prostate: Evidence or Suspicion? Urology. 2001. 58:318-34. 4. Byers, T. Nutrition and cancer among American Indians and
Alaska Natives. Cancer.1996; 78:1612-6.
5. Dunham, LJ, Bailar JC, 3rd Laguer, GL. Histologically diagnosed cancers in 693 Indians of the United States, 1950-65. J Natl Cancer Inst.1973; 50:1119-27.
6. Arruda, HO, Vieira Filho, JPB, Ortiz, V et al.: PSA and anthopometric measurements among Amazon Indians: an evaluation of the Parkatejê community. Rev Saúde Pública. 2003;37:624-8.
7. Rocha AKS, Bós AJG, Huttner E, Machado DC. Prevalência da síndrome metabólica em Indígenas com mais de 40 anos no Rio Grande do Sul, Brasil. Rev. Panam. Salud Publica. 2011; 29:41-5.
9. Reis LO, Simão AF, Baracat J, Denardi F, Gugliotta A. Digital rectal examination standardization for inexperienced hands: teaching medical students. Adv Urol. 2013; 2013:797096. 10. Berger M, Junior L, Silva PN, Walter K. Statistical validation
of the international prostatic symptom score (I-PSS) in portuguese. J Bras Urol. 1999;25:225-34.
11. Zamuner M, Laranja WW, Alonso JC, Simões FA, Rejowski RF, Reis LO. Is metabolic syndrome truly a risk factor for male lower urinary tract symptoms or just an epiphenomenon? Adv Urol. 2014; 2014:203854.
12. de Lima Junior MM, Reis LO, Guilhen AC, Granja F, de Lima Oliveira MN, Ferreira U, Cunha LL, Ward LS. N-acetyltransferase-2 gene polymorphisms and prostate cancer susceptibility in Latin American patients. Med Oncol. 2012;29:2889-94.
13. Gilliland FD, Becker TM, Key CR et al. Contrasting trends of prostate cancer incidence and mortality in New Mexico’s Hispanics, non-Hispanic whites, American Indians and blacks. Cancer. 1994; 73:2192-9.
14. Whitmore AS, Kolonel LN, Wu AH et al. Prostate cancer in relation to diet, physical activity and body size in blacks, whites and Asians in the United States and Canada. J Natl Cancer Inst.1995; 87:652-61.
15. Henderson JA, Espery DK, Jim MA et al. Prostate cancer incidence among American Indian and Alaska Native men 1999-2004. Cancer. 2008; 113:1203-12.
16. Bostwick DG, Burke HB, Djakiew D, Euling S, Ho SM, Landolph J et al. Human prostate cancer risk factors. Cancer. 2004; 101:2371-490.
17. Hsing AW, Deng J, Sesterhenn IA. Body size and prostate cancer: a population-based case-control study in China. Cancer Epidemiol Biomarkers Prev. 2000; 9:1335-41. 18. Kolonel LN. Fat, Meat and Prostate Cancer. In: Johns Hopkins
University Bloomberg School of Public Health Vol. 23, No. 1; USA; 2001.
19. Crawford ED. Understanding the epidemiology, natural history and key pathways involved in prostate cancer. Urology.2009; 73:S4-10.
20. Collis GN, Lee RJ, McKelvie GB, Rogers AC, Hehir M. Relationship between prostate specific antigen,prostate volume and age in the benign prostate. Br J Urol. 1993;71:445-50.
21. Dalkin BL, Ahmann FR, Kopp JB. Prostate specific antigen levels in men older than 50 years without clinical evidence of prostatic carcinoma. J Urol.1993;150:1837-9.
22. Mettlin C, Murphy GP,Lee F, Littrup PJ, Chesley A, Babaian R, et al. Characteristics of prostate detected in the American Cancer Society-National Prostate Cancer Detection Project. J Urol.1994;152:1737-40.
23. Oesterling JE, Jacobsen SJ,Cooner WH.The use of age-specific reference ranges for serum prostate age-specific antigen in men 60 years old or older.J Urol.1995;153:1160-3. 24. Mehdad A, McBride E, Monteiro Grillo I, Camilo M, and
Ravasco P. Nutritional status and eating pattern in prostate cancer patients. Nutr Hosp. 2010; 25:422-427.
25. Tai, BC. RNASEL gene polymorphisms and the risk of prostate cancer: a meta-analysis Clin Can Res. 2006; 12:5713-9. 26. Wu HC, Chang CH, Chen HY, Tsai FJ, Tsai JJ, Chen WC. p53
gene codon 72 polymorphism but not tumor necrosis factor-alpha gene is associated with prostate cancer. Urol Int. 2004; 73:41-46.
27. Quiñones LA, Irarrázabal CE, Rojas CR, Orellana CE, Acevedo C, Huidobro C et al. Joint effect among p53, CYP1A1, GSTM1 polymorphism combinations and smoking on prostate cancer risk: an exploratory genotype-environment interaction study. Asin J Aandrol. 2006; 8:349-55.
28. Henner WD, Evans AJ, Hough KM, Harris EL, et al. Association of codon 72 polymorphism of p53 with lower prostate cancer risk. Prostate. 2001;49:263-6.
29. Beiguelman B. In: Genética de populações humanas. Bernardo Beiguelman. Ribeirão Preto: SBG, 2008; pp. 235. 30. Ntais SC, Polycarpou A, Ioannidis JP. Association of
GSTM1, GSTT1 and GSTP1 gene polymorphisms with the risk of prostate cancer: a meta-analysis. Cancer Epidemiol Biomarkers Prev. 2005; 14:176-81.