Physical Fitness, Age and Nutritional Status of Military Personnel
Clarissa Stefani Teixeira
1e Érico Felden Pereira
2Universidade Federal de Santa Catarina1, Florianópolis, SC; Universidade Federal do Paraná2, Curitiba, PR - Brazil
Mailing address: Érico Felden Pereira •
Rua Otacílio Chaves, 253 - Nossa Senhora do Perpétuo Socorro - 97045-360
- Santa Maria, RS - Brazil
E-mail: [email protected], [email protected] Manuscript received December 08, 2008; revised manuscript received December 08, 2008; accepted October 01, 2009.
Abstract
Background: Although there is a trend toward the decrease in levels of physical fitness, the intensity of this decrease due to the aging process and the nutritional status in adult male individuals is not well-known, especially in the Brazilian population.
Objective: To analyze the levels of physical fitness according to age and the nutritional status in adult male individuals.
Methods: Aerobic and muscular endurance tests as well as flexibility tests and nutritional status assessment were carried out in 1,011 male individuals. Analyses of correlation, covariance and prevalence ratio were performed through Poisson regression.
Results: The individuals presented a moderate performance at the physical fitness tests. A decrease in the levels of physical performance according to the aging process was verified, considering all age ranges analyzed. The analysis of covariance corrected by age showed differences (p<0.001) for all tests comparing normal individuals and those with overweight/obesity. The prevalence ratios showed a strong trend toward the decrease in the physical fitness from 18 to 54 years. Individuals aged 41 to 54 years presented prevalences of low VO2max index that were 3.22-fold higher when
compared to those aged 18 to 20 and 1.40-fold higher when compared to individuals aged 21 to 25 years. There was a decrease in the VO2max scores in the 18 to 20 age range, when compared to the 41 to 54 age range, of 11.45% in the normal group and 20.91% in the group with overweight and obesity.
Conclusion: Age and the nutritional status have a strong influence on the decreased physical performance scores, mainly after 30 years of age. (Arq Bras Cardiol 2010; 94(4):412-417)
Key words: Physical fitness; age; nutritional status.
of low physical fitness, as well as lack of data regarding the adult population, with studies focusing mainly on the physical performance of adolescents and schoolchildren7-9.
Age and the nutritional status can be indicated as the main factors for physical performance and the levels of physical fitness decrease with age, as well as in those individuals with overweight and obesity9,10.
In spite of that, a more detailed assessment of how this process occurs and its velocity during the transition from adolescence to older age can reveal vital points of intervention, as well as collaborating to a better understanding of the different biological mechanisms related to human development. Therefore, the aim of this study was to describe and discuss the associations between age and body mass index (BMI) in the physical performance of adult military men.
Methods
A total of 1,011 male individuals from the Brazilian Air Force stationed at a base in southern Brazil were studied. All participants who presented physical and/or medical restrictions were excluded from the study. The individuals
mean age was 28.32 ± 8.73 years, 95%CI (27.28-28.86 years)
and had a mean body mass index (BMI) and height of 76.27
Introduction
Adequate levels of physical fitness and physical activity have been shown to be protective factors against several diseases and to promote good quality of life1-3.
In spite of that, there is a complex context that encompasses aspects of genetic constitution, age, sex, psychomotor maturity, social, cultural and ethnic differences of the demographic groups and populations that determine the physical performance of the individuals at each phase of life4. In
general terms, a decrease in the levels of physical fitness and involvement with regular sports activities has been identified during the adult phase and insertion in the work market5.
A classic study6 showed that the low level of physical fitness
± 11.48 kg, 95% CI (75.55 - 76.97 kg) and 174.16 ± 7.91 cm, 95%CI (173.67 - 174.65 cm), respectively.
The study was approved by the Human Research Ethics Committee of the institution, project protocol #
23081.002290/2007-53.
The Air Force Physical Fitness Tests11,12 were considered
for the analysis. The Flexitest was used to evaluate flexibility according to the Araujo procotol13, considering the
measurement of the joint range of motion of the shoulder, trunk and hip, in which five movements (extension with shoulder posterior adduction, posterior adduction with 180° of shoulder abduction with flexed elbows, trunk flexion and hip abduction) considering the final score the sum of the scores obtained for the movements.
The arm muscular endurance (AMB) was used to evaluate the arm and shoulder girdle resistance and the trunk flexion test (modified abdominal test) was used to evaluate the endurance of the abdominal trunk muscular endurance (TME), according to the protocols of Johnson and Nelson14. The 12-minute run
test aimed at measuring the cardiorespiratory resistance and followed the recommendations by Cooper15 and Johnson and
Nelson14, with the maximal oxygen consumption (VO 2max)
being estimated through the following equation: VO2max =
(distance walked/miles - 0.3138)/0.0278).
The following ranges were adopted for the age variable, in
years: 18 to 20, 21 to 25, 26 to 30, 31 to 35, 36 to 40 and 41 to 54. For the BMI, we considered a normal nutritional status
when BMI was up to 24.99 and overweight/obesity when BMI
was > 25. For the analysis of prevalence ratios, the scores below
the mean general performance of the group for each physical test were considered as low level of physical fitness.
Descriptive statistical analyses were carried out considering means, standard deviations, confidence intervals and low physical fitness prevalences. The normality of the data was confirmed by the Kolmogorov-Smirnov test. To verify possible associations among the variables, Pearson’s correlation tests were applied for continuous variables and Spearman’s correlations tests were used for interval-like variables. The criteria used by Malina16 were used for the analysis of the
correlations, which describe a low correlation for a value < 0.30, a moderate correlation for values between 0.30 and 0.60 and high correlation for values > 0.60. The analysis of covariance (ANCOVA) was used to verify possible differences between physical performance means at different nutritional status, adjusted by age. Poisson regression analysis was used to estimate the prevalence ratios considering the low physical
fitness as the dependent variable, as the outcomes present high prevalence values17. The level of statistical significance
was set at 5% for all analyses.
Results
The mean BMI of the sample was 25.08 kg.m2 with a
standard deviation of 3.38 kg.m2. Table 1 shows the results
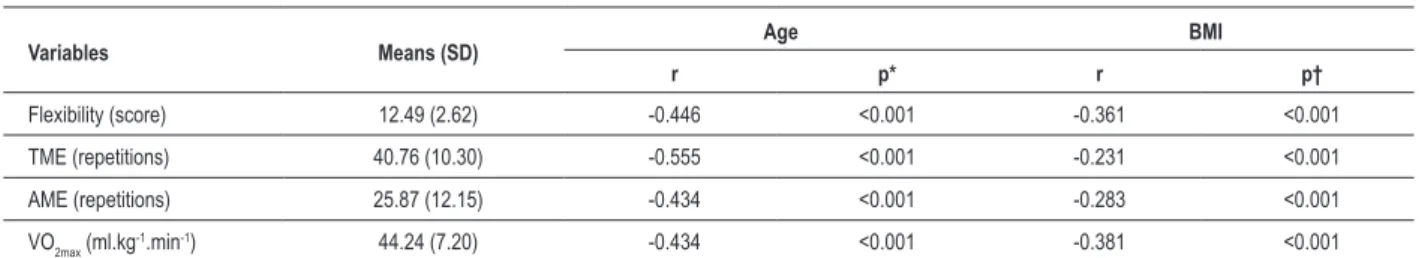
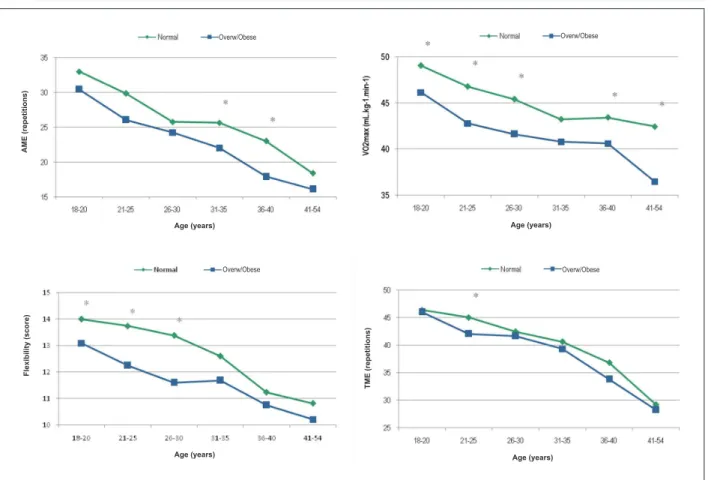
of the correlations between the performance at the physical fitness tests and age and BMI, which showed moderate correlations at all variables and higher ones when considering age. Figure 1 shows the performance at the tests according to the established age ranges and it is possible to observe a linear decrease in the performance scores with age. The decrease in VO2max from the first to the last age range was 20.96%.
When stratified according to the nutritional status, the percentage of decrease considering the mean VO2max performancebetween the first and the last age range was
11.45% in the normal group, increasing to 20.91% in the
overweight/obesity group. Regarding flexibility, the decrease was 24.23% in the general group and similar in the normal (22.71%) and the overweight/obesity group (20.96%). At the TME assessment these values were 38.33% in the
general group; 37.02% in the normal group; and 38.56%
in the overweight/obesity group. At the RMB assessment, the decrease was 47.98% in the general group and, when considering the nutritional status, 44.19% for the normal group and 47.02% in the overweight/obesity group.
Table 2 shows the differences in performance according to the nutritional status which, considering the adjustment by age, showed significant differences for all physical capacities that were investigated.
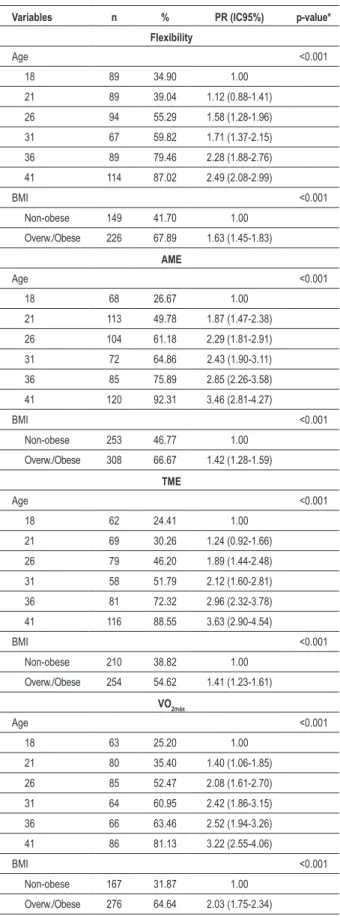
The prevalence ratios presented in Table 3 show a strong trend toward the decrease in physical fitness for older ages and for overweight and obesity. Considering the nutritional status, the highest prevalence ratio was observed for the evaluation of cardiorespiratory resistance and the obese individuals presented prevalences of low physical fitness that were 1.41-fold higher when compared with the individuals with normal nutritional status. Although a strong trend toward the decrease in physical fitness was observed with age, flexibility was the physical quality that presented less evident prevalences of low physical fitness when compared with other physical capacities that were investigated. The prevalence ratios showed a similar behavior when the performance at the arm and trunk muscular endurance tests was analyzed. The prevalences of low physical
Table 1 - Means, standard deviations and correlations (r) of the physical itness test performance with age and BMI
Variables Means (SD) Age BMI
r p* r p†
Flexibility (score) 12.49 (2.62) -0.446 <0.001 -0.361 <0.001
TME (repetitions) 40.76 (10.30) -0.555 <0.001 -0.231 <0.001
AME (repetitions) 25.87 (12.15) -0.434 <0.001 -0.283 <0.001
VO2max (ml.kg
-1.min-1) 44.24 (7.20) -0.434 <0.001 -0.381 <0.001
Table 2 - Analysis of covariance of the physical itness variables according to the nutritional status adjusted by age
Variables Normal Overw./Obese ANCOVA
F p
Flexibility (points) 13.27 (2.52) 11.58 (2.45) 157.36 <0.001
TME (repetitions) 28.49 (13.33) 22.78 (9.74) 227.48 <0.001
AME (repetitions) 42.92 (9.35) 38.25 (10.80) 125.09 <0.001
VO2max (ml.kg
-1.min-1) 46.46 (6.68) 41.50 (6.88) 149.28 <0.001
AME - arm muscular endurance; TME - trunk muscular endurance.
Figure 1 - Distribution of performance frequencies according to age ranges and the nutritional status. * Student’s t test probability.
A
ME
(r
e
p
e
ti
ti
o
n
s
)
Age (years) Age (years)
Age (years) Age (years)
Overw/Obese Overw/Obese
Overw/Obese Overw/Obese
F
le
x
ib
il
ity
(s
c
o
re
)
T
ME
(r
e
p
e
ti
ti
o
n
s
)
fitness were higher considering the age, in comparison with the nutritional status.
Discussion
The present study analyzed the results of the assessment
of the physical performance of 1,011 men aged 18 to 54
years and the association of this performance with age and nutritional status. The mean BMI was slightly higher than the one observed in a study9 carried out with military personnel
from 36 different garrisons of the Brazilian Army, as well as in the study18 that assessed 121 military individuals from the
Brazilian Army from a military garrison at Porto Alegre, state of Rio Grande do Sul, Brazil.
In the present study, age showed stronger correlations than BMI results (Table 1), although both factors had a strong effect on the physical fitness tests, in accordance with associations identified in a longitudinal study with Finnish military personnel5. In addition to the associations with age,
it has been verified that the indicators of the nutritional status worsen as the individuals rise in their careers19.
High prevalences of overweight and obesity in adult men have been identified20-22 and are directly associated with the
aging process, mainly at the age range of 27 to 37 years. National investigations21 identified that approximately 8% of
Table 3 - Prevalences and prevalence ratios for low physical itness according to age and BMI
Variables n % PR (IC95%) p-value*
Flexibility
Age <0.001
18 89 34.90 1.00
21 89 39.04 1.12 (0.88-1.41)
26 94 55.29 1.58 (1.28-1.96)
31 67 59.82 1.71 (1.37-2.15)
36 89 79.46 2.28 (1.88-2.76)
41 114 87.02 2.49 (2.08-2.99)
BMI <0.001
Non-obese 149 41.70 1.00
Overw./Obese 226 67.89 1.63 (1.45-1.83)
AME
Age <0.001
18 68 26.67 1.00
21 113 49.78 1.87 (1.47-2.38)
26 104 61.18 2.29 (1.81-2.91)
31 72 64.86 2.43 (1.90-3.11)
36 85 75.89 2.85 (2.26-3.58)
41 120 92.31 3.46 (2.81-4.27)
BMI <0.001
Non-obese 253 46.77 1.00
Overw./Obese 308 66.67 1.42 (1.28-1.59)
TME
Age <0.001
18 62 24.41 1.00
21 69 30.26 1.24 (0.92-1.66)
26 79 46.20 1.89 (1.44-2.48)
31 58 51.79 2.12 (1.60-2.81)
36 81 72.32 2.96 (2.32-3.78)
41 116 88.55 3.63 (2.90-4.54)
BMI <0.001
Non-obese 210 38.82 1.00
Overw./Obese 254 54.62 1.41 (1.23-1.61)
VO2máx
Age <0.001
18 63 25.20 1.00
21 80 35.40 1.40 (1.06-1.85)
26 85 52.47 2.08 (1.61-2.70)
31 64 60.95 2.42 (1.86-3.15)
36 66 63.46 2.52 (1.94-3.26)
41 86 81.13 3.22 (2.55-4.06)
BMI <0.001
Non-obese 167 31.87 1.00
Overw./Obese 276 64.64 2.03 (1.75-2.34)
(*) non-adjusted p value (Chi-square p value).
A more marked decrease in performance (Figure 1) was identified soon after 30 years of age and, in some cases, performance stability was observed between 20 and 30 years of age. The third decade of life is indicated23 as a period of
stabilization in lung function that tends to decrease gradually. This decrease follows an age-related pattern; however, the
decrease between 40 and 50 years of age tends to be associated
with factors such as increase in body weight, instead of being associated with actual tissue alterations. Regarding the physical fitness variables19, a decrease of approximately 10 to 15% in
aerobic power is estimated for each decade of life as individuals approach their 3rd decade. However, it seems that the loss can be
as little as 5% to 7% per decade in highly trained individuals24.
The studied Brazilian sample showed a decrease in VO2max that was slightly higher than the one in the Finnish study5,
when similar age intervals were compared. The absolute values presented by the Brazilian military personnel at the analysis of the VO2max were classified as presenting a good level15.
Nevertheless, a study with a similar sample10 identified low
cardiorespiratory fitness among the studied military personnel. The cardiorespiratory fitness9 is considered a protective factor
against health risks attributed to obesity and reflects the need for a more active lifestyle, in the sense of preventing and controlling chronic-degenerative diseases and metabolic syndromes.
Analyses of the decrease in the percentage of fitness considering the nutritional status for a similar population were not found in the literature. In the studied individuals, the VO2max decrease from the first to the last age range was
11.45% in the normal group and 20.91% in the overweight/
obesity group, which shows a strong influence of the nutritional status in the long term. Although cross-sectional data cannot reveal a cause-effect association, these results are in agreement with those by Santilla et al5 in a longitudinal
follow-up of a similar sample. In spite of this important percentage difference according to the nutritional status for the VO2max,the decrease in the performance scores was more
significant in the assessments of localized muscular resistance, reaching a decrease of more than 40% at the age ranges of
18 to 20 and 41 to 54 years.
Similar results were presented in the literature9,
identifying that, even after adjusted for age, the individuals with higher waist circumferences presented lower cardiorespiratory fitness.
The results of the correlations (Table 1) and the analysis of covariance (Table 2), which showed the differences in performance according to the nutritional status corrected by age, indicated the need for nutritional interventions at all age ranges and have confirmed the results of an epidemiological study25 that showed that sedentary young individuals have a
higher chance of becoming sedentary adults. Additionally, the lack of alternatives for the practice of physical exercises by adults, especially after their insertion in the work market, is pointed out as one of the causes for the low physical fitness26.
References
1. Fulton JE, Garg M, Galuska DA, Rattay KT, Caspersen CJ. Public health and clinical recommendations for physical activity and physical fitness: special
focus on overweight youth. Sports Med. 2004; 34 (9): 581-99.
2. Barnett TA, Gauvin L, Craig CL, Katzmarzyk PT. Distinct trajectories of leisure time physical activity and predictors of trajectory class membership: a 22 year
cohort study. Int J Behav Nutr Phys Act. 2008; 5 (1): 57.
3. Rocha CRGS, Freitas CR, Comerlato M. Relação entre nível de atividade física e desempenho no teste de avaliação física de militares. Revista de Educação Física. 2008; 142: 19-27.
4. Maskatova AK. Fisiologia: seleção de talentos e prognóstico das capacidades motoras. Jundiaí: Ápice; 1997.
5. Santilla M, Kyrolainen H, Vasankari T, Tiainen S, Palvalin K, Hakkinen A, et al. Physical fitness profiles in young Finnish men during the years 1975–2004.
Med Sci Sports Exerc. 2006; 38(11): 1990-4.
6. Blair SN, Kohl HW 3rd, Paffenbarger RS Jr, Clark DG, Cooper KH, Gibbons LW. Physical fitness and all-cause mortality: a prospective study of healthy
men and women. JAMA. 1989; 262 (17): 2395-401.
7. Pereira EF, Teixeira CS. Proposta de valores normativos para avaliação da aptidão física em militares da Aeronáutica. Rev bras Educ Fis Esp. 2006; 20
(4): 249-56.
8. Watkins JA, Christie C, Chally P. Relationship between body image and body
mass index in college men. J Am Coll Health. 2008; 57 (1): 95-100.
9. Oliveira EAM, Anjos LA. Medidas antropométricas segundo aptidão cardiorrespiratória em militares da ativa, Brasil. Rev Saúde Pública. 2008; 42 (2): 217-23.
10. Leite Júnior AB, Brito APC, Girardi CEB, Coutinho CAC, Pinheiro CMA, Cadorin EJ, et al. Associação entre aptidão cardiorrespiratória e acúmulo de componentes da síndrome metabólica em militares do sexo masculino do exército brasileiro. Revista de Educação Física. 2007; 138 (3): 23-30.
11. Brasil. Ministério da Defesa. Base Aérea de Santa Maria. Teste de aptidão do condicionamento da Aeronáutica: flexiteste. Santa Maria; 2003.
12. Oliveira EAM. Validade do teste de aptidão física do exército brasileiro como instrumento para a determinação das valências necessárias ao militar. Revista
de Educação Física. 2005; 131 (2): 30-7.
13. Araújo CGS. Flexiteste: uma nova versão dos mapas de avaliação. Kinesis.
1986; 2 (2): 251-67.
14. Johnson BL, Nelson JK. Practical measurements for evaluation in physical education. 4th ed. Edina: Burgerss; 1986.
15. Cooper KH. A means of assessing maximal oxygen intake: correlation
between field and treadmill testing. JAMA. 1968; 203 (3): 201-4.
16. Malina RM. Tracking of physical activity and physical fitness across the
lifespan. Res Q Exerc Sport. 1996; 67 (3S): 48-57.
17. Barros AJ, Hirakata VN. Alternatives for logistical regression in cross-sectional studies: an empirical comparison of models that directly estimate the prevalence ratio. BMC Med Res Methodol. 2003; 3 (1): 21.
18. Rocha CRGS, Freitas CR, Comerlato M. Relação entre nível de atividade física e desempenho no teste de avaliação física de militares. Revista de Educação Física. 2008; 142 (3): 19-27.
19. Jacobina DS, Souza DFX, Nunes JPS, Curto LB, Aguiar LFM, Vasconcelos LFC, et al. Comparação do estado nutricional e do nível de condicionamento físico de oficiais combatentes do exército brasileiro nos cursos de formação, aperfeiçoamento e comando e estado-maior. Revista de Educação Física.
2007; 137 (2): 41-55.
20. Instituto Brasileiro de Geografia e Estatística (IBGE). Análise da disponibilidade domiciliar de alimentos e do estado nutricional no Brasil: pesquisa de orçamentos familiares 2002-2003. Rio de Janeiro; 2004.
21. Ministério da Saúde. Normas e manuais técnicos. Cadernos de Atenção
Básica n. 12 / Série A. [acesso 2007 jul 15 ]. Disponível em http://dtr2004.
saude.gov.br/nutricao/documentos /doc_obesidade.pdf
22. Neves EB. Prevalência de sobrepeso e obesidade em militares do exército brasileiro: associação com a hipertensão arterial. Cienc saúde coletiva. 2008;
13 (5): 1661-8.
23. Gallahue D, Ozmun J. Compreendendo o desenvolvimento motor: bebês, crianças, adolescentes e adultos. São Paulo: Phorte; 2001.
24. Trappe SW, Costill DL, Vukovich MD, Jones J, Melham T. Ageing among elite
The behavior of the results of the flexibility assessment is in agreement with the norms27 proposed in relation to age. In
spite of that, the flexibility showed to be the physical quality that is least influenced by age, according to the calculated prevalence ratios (Table 3).
The indexes in the localized muscular strength assessment
for the trunk flexion test are between the 25th and the 50th
percentiles28; at the arm flexion test, they showed indexes
at the 55th percentile14, which imply in a moderate to poor
performance. However similar values have been verified in samples of military athletes29.
A non-linear decrease in localized muscle resistance in both arm flexions and abdominal exercises at the adult phase has been previously reported19 and decreases in muscular
strength30 have been reported from the third and fourth
decades of life, with a decrease of 8 to 15% per decade, which
demonstrates the need for establishing strategies to promote functional health, especially at the adult phase, when there is a higher rate of insertion in the work market.
Conclusion
Age and nutritional status have a strong influence on the
decreased scores of physical performance. A more marked decrease was observed after 30 years of age. The decrease in the physical performance considering the age ranges was higher in the overweight and obesity group, especially regarding the localized muscle strength performance. It is necessary to adopt measures aimed at improving physical fitness, as well as controlling overweight and obesity at all age ranges, due to the possible negative effects, at mid and long term, on several health outcomes.
Potential Conflict of Interest
No potential conflict of interest relevant to this article was reported.
Sources of Funding
There were no external funding sources for this study.
Study Association
distance runners: a 22-year longitudinal study. J Appl Physiol. 1996; 80 (1):
285-90.
25. Azevedo MR, Araujo CL, Silva MC, Hallal PC. Tracking of physical activity from
adolescence to adulthood: a population-based study. Rev Saúde Pública.
2007; 41 (1): 69-75.
26. Mota CB, Pereira EF, Teixeira CS. Práticas esportivas e o serviço militar. Revista Mineira de Educação Física. 2006; 14 (1): 7-18.
27. Araújo CGS. Avaliação da flexibilidade: valores normativos do flexiteste dos
5 aos 91 anos de idade. Arq Bras Cardiol. 2008; 90 (4): 280-7.
28. AAHPERD. Physical best: a physical fitness education & assessment program. Reston; 1988.
29. Etchepare LS, Pereira EF, Villis JMC, Zinn JL. Perfil físico de atletas de
orientação. Revista da Educação Física/UEM. 2003; 14 (2): 65-71.
30. Backman E, Johansson V, Hagger B, Sjoblom P, Henriksson KG. Isometric muscle strength and muscular endurance in normal person age between 17