ABSTRACT
http://dx.doi.org/10.1590/1678-7757201302312
with different surface characteristics
1, Phillip MÜLLER2, Thomas ATTIN3, Marco WIELAND 5, Bernhard
6
1- PD Dr. med. dent., Head of Periodontology, Clinic of Preventive Dentistry, Periodontology and Cariology, Center of Dental Medicine, University of Zurich, Zurich, Switzerland.
2- Dr. med. dent., Research Assistant, Clinic of Preventive Dentistry, Periodontology and Cariology, Center of Dental Medicine, University of Zurich, Zurich, Switzerland.
3- Prof. Dr. med. dent., Chairman, Clinic of Preventive Dentistry, Periodontology and Cariology, Center of Dental Medicine, University of Zurich, Zurich, Switzerland. 4- PhD, MyoPowers Medical Technologies SA, Lausanne, Switzerland before Institute Straumann AG, Basel, Switzerland.
5- RDH, BS, EdM, CAS, Research Associate, Clinic of Preventive Dentistry, Periodontology and Cariology, Center of Dental Medicine, University of Zurich, Zurich, Switzerland.
6- Prof. em., Former Head of Department, Institute for Oral Biology, Section for Oral Microbiology and General Immunology, Center of Dental Medicine, University of Zurich, Zurich, Switzerland.
!"#$#%$$!!& Patrick R. Schmidlin - Center of Dental Medicine, Plattenstrasse 11, 8032 - Zurich, Switzerland - Phone: +41 44 634 34 17 - Fax +41 44 634 43 08 - e-mail: [email protected]
'($&)"*+4;<+;=$>$&?(;;;<+;=) "$&@#'CF;<+F
O
!"# were formed anaerobically on 5-mm-diameter sterilized, saliva-preconditioned titanium discs. Material surfaces used were either machined, stained, acid-etched or sandblasted/ acid-etched (SLA). Samples of the latter two materials were also provided in a chemically $% % ! angles of all materials were determined. The discs were then incubated anaerobically for up to 16.5 h. Initial microbial adherence was evaluated after 20 min incubation and further colonization after 2, 4, 8, and 16.5 h using non-selective and selective culture techniques. Results at different time points were compared using ANOVA and Scheffé post hoc analysis.
& '*% %+3739:;<=>?@7$!B> exhibited the highest values for colonization (6.9±0.2 log CFU, p<0.05) but increasing growth was observed on all test surfaces over time. Discrepancies among bacterial strains on the differently crafted titanium surfaces were very similar to those described for total log CFU. F. nucleatum was below the detection limit on all surfaces after 4 h. Conclusion:
Within the limitations of this in vitro$ J
$%%J " !B> % for bacterial colonization.
Key words:KP! Q
INTRODUCTION
The use of dental implants has become a routine procedure in dentistry to replace one or more missing teeth. Given implant survival as the main criteria for success, the majority of clinical studies show high success rates for dental implants4. However, there is also evidence of
J$9@Z#[Z$ in soft and hard tissues neighboring implants12,15,
and is commonly observed about ten years after implantation19. These pathologic conditions termed
J12. Numerous studies have
shown a bacterial etiology with a similar spectrum of putative pathogens13 and a high concordance
of bacterial species14,16. It is noteworthy that the
colonization of “pristine” peri-implant pockets with periodontal disease associated bacteria has been shown to occur within 2 weeks17 and that some of
these bacteria were found to be present as early as 30 min after insertion8. P
implant surfaces is therefore similar in composition and mechanisms known from teeth17, but may be
J # macroscopic design features.
Implants with smooth surfaces have been shown to exhibit a higher incidence of early failure, whereas implants with rougher surfaces display a lower incidence of early failure, but show increased failure rates over time8. Rough implant
# % formation and osseointegration - have thus been generally considered to enhance initial adhesion and the subsequent colonization of oral bacteria18.
Interactive energy effects, e.g. substratum hydrophobicity, surface-free energy and charge, however, must also be taken into consideration5.
This in vitro study assessed the extent of early
biofilm colonization up to 16.5 h on titanium surfaces with different surface roughness and wetting characteristics. The hypothesis tested was that there would be no or only minute differences ^^ time. In this context, changes below 1 log step were considered to be irrelevant.
MATERIAL AND METHODS
Disc preparation
Round test specimens (5 mm diameter and 1 mm thickness) were manufactured from commercially
pure (c.p.) grade 2 titanium (Straumann AG, CH-4002, Basel, Switzerland) according to one of seven procedures, as described in Figure 1. Visual details of the microstructure of each surface are depicted ;' +`!B>{ `>{= and were stored in glass ampoules containing the storage liquid, whereas all other samples were kept in air at room temperature. All specimens displayed different surface characteristics, i.e. surface roughness and wetting potentials, which were assessed as described below.
Measurement of surface roughness and wetting ability
Surface topography and roughness were analyzed by scanning electron microscopy (SEM) and white light confocal microscopy, respectively. Samples for SEM (Leo 1430, LEO Elektronenmikroskopie GmbH, Oberkochen, Germany) were sputter coated (BAL-TEC SCD 050, BAL-TEC AG, Balzers, Liechtenstein) by a thin Au-Pd layer and examined at an accelerating voltage of 20 kV. The confocal three-dimensional (3D) white light microscope (μSurf, NanoFocus AG, Oberhausen, Germany) was used for surface topography measurements. An area of 798 μm x 770 μm was measured to calculate the 3D roughness parameter Sa (arithmetic mean deviation of the surface) using a moving average ~ % # % * μm. Five samples from each surface type were investigated.
Contact angle hysteresis was tensiometrically examined by the Wilhelmy method by means of an electrobalance (Sigma 70; KSV Instruments, Ltd., Helsinki, Finland). Dynamic contact angle analysis (DCA) was described in detail elsewhere20,21. The
immersion velocity was set to 10 mm/min for all experiments; the immersion depth was 15 mm. All
'V ($> #
Machined Sa>0.2 μm Mechanically polished samples were prepared by using SiC gringing paper
Mechanically polished samples were prepared by using SiC gringing paper
PT !
!" #$$%&'(
A Acid-etching with a hot solution of HCl/H2SO4 according to a proprietary process of Institut Straumann AG
ModA New developed A surface. A surface will be rinsed under nitrogen protection and then stored in a sealed glass tube containing isotonic NaCl solution at pH 4 to 6
SLA Alumina blasting with a large grit particles (average particle size 250 μm) and subsequent acid-etching with a hot solution of HCl/H2SO4 according to a proprietary process of Institut Straumann AG
ModSLA Further development of SLA surface. SLA will be rinsed under nitrogen protection and then stored in a sealed glass tube containing isotonic NaCl solution at pH 4 to 6
multi-loop experiments have been repeated at least fourfold at room temperature. Five samples from each surface type were investigated.
%LR¿OPSUHSDUDWLRQ
The experiments were repeated 3 times in triplicates for each surface, resulting in a sample size of 9 specimens per group.
Actinomyces oris OMZ 745, Veillonella dispar
ATCC 17748T (OMZ 493), Fusobacterium nucleatum
KP-F2 (OMZ 596), Streptococcus sobrinus OMZ 176, Streptococcus oralis SK248 (OMZ 607), and Candida
albicans ??*%
formation10,22,24. In brief, all microorganisms were
grown to the mid logarithmic phase using a strictly controlled incubation period for each species. In numerous preliminary experiments, growth curves of all microorganisms using culture techniques and optical density measurements were made. Thus, the incubation time of each strain of consortium to reach the mid logarithmic phase could be determined. The density of aliquots of the cultures was measured and adjusted to an absorption of ?*+ 77*= % adjusted accordingly and 1 mL of each culture was
10. The inoculum
contained reproducibly 107-108 microorganisms
of each species per P % %
24-well polystyrene cell culture plates25. For this
purpose, discs were preconditioned (pellicle-coated) in processed whole unstimulated pooled human saliva and were cultured as shown in Figure 3. The collection of saliva and the preconditioning of discs have been previously described10. Whole,
un-stimulated saliva was obtained over several days from volunteers (with informed consent) at least 1.5 h after eating, drinking, or tooth cleaning. Saliva samples, collected in sterile 50 mL polypropylene tubes chilled in an ice bath, were frozen at -20°C. When a total of ca. 500 mL saliva had been collected, it was pooled and centrifuged (30 min, 4°C, 27,000 xg), and the supernatant was pasteurized (60°C, 30 min) and re-centrifuged in sterile bottles; the resulting supernatant was dispensed into sterile 50-mL polypropylene tubes '*: was assessed by plating processed saliva samples onto CBA; after 72 h at 37°C, no colony forming units (CFU) were observed on either aerobically or anaerobically incubated plates.
To allow formation of a salivary pellicle, titanium disc were incubated in sterile 24-well polystyrene cell culture plates (NuncA/S, Roskilde, Denmark), with processed saliva (for 4 h, gently shaken, at room temperature). Saliva was aspirated from each well and replaced with 800 mL saliva and 800 mL mFUM medium containing 0.15% glucose and 0.15% sucrose. The wells were inoculated with the
Figure 2- Scanning electron microscopy images of the '''9'$<=?JKQ and 1,000x (E-G), respectively. A: machined Sa>0.2 μm; WX Y &X Y X J Y KX # ! J =[?Q 9 ' differ in their microscopic surface characteristics. Details 9 ' &JK ; \X stained PT; G: acid-etched and H: SLA
Figure 3- Schematic timeline of the experimental conditions (F represents 45 min feeding periods with saliva/mFUM 30/70). Between feedings, the discs were incubated in saliva
pooled oral microbiota (200 mL) for 20 min. Following an initial adherence period of 20 min, % % 45 min and again after 4 and 8 h incubation. After each feeding, the discs were 3x dip-washed in saline to remove non-adhering microorganisms. During $% P%'*$'$9 and 16.5 h (Figure 4).
+DUYHVWLQJDQGH[DPLQDWLRQRIWKHELR¿OP microbiota
To harvest adherent microorganisms, each disc was transferred to a sterile 50 ml polypropylene tube containing physiological saline (1 mL, room temperature) and vortexed vigorously for 2 min. The suspensions were then transferred to sterile @#7* W. Serial dilutions (10-2-10-5= %
prepared in physiological saline and aliquots (50 mL) were spirally plated (Spiral System, Model D, Spiral Systems, Inc., Cincinnati, USA) onto CBA plates (Columbia Blood Agar, Oxoid, CM 331 + 5% whole human blood) for assessing total CFU and as
well for identifying and counting A.naeslundi and
V.dispar. F.nucleatum was counted using ;
[Fastidious Anaerobe Agar (lab m, UK, BAG, 7621)] supplemented with erythromycin (1 mg/L) Sigma, E-6376/dissolved in distilled H2O, vancomycin (4 mg/L) Lilly, 657/dissolved in distilled H2O and
J" +?B=!$#[9[* absolute ethanol. S. sobrinus and S. oralis colonies were assessed on MS agar (Mitis-Salivarius agar, Difco 0298-17-2, Heidelberg, Germany) and C. albicans on Biggy-Agar (Difco 0635-17-4). After 72
h incubation, CFUs were counted with the assistance of a stereomicroscope.
Data presentation and statistical analysis
Statistical analysis was performed with a commercially available program (StatView, Version 5, Abacus Concepts Inc., Berkeley, USA). For the determination of the surface roughness (Sa, μm) and contact angle (q, °) measurements, mean values and standard deviations were calculated.
; $ corresponding 95% confidence intervals (95% CI) were calculated. To determine the differences
Roughness Parameter
Machined Sa>0.2 μm
Machined Sa>0.2 μm
Stained Acid-etched $>$) $=
etched
SLA $>$
SLA
Sa 0.3±0.06 0.1±0.02 0.4±0.07 0.6±0.01 0.6±0.02 1.3±0.06 1.2±0.09
q (°) 92±5 92±5 93±5 121±4 0 134±5 0
Table 1- Arithmetic mean deviation of the surface (Sa, μm) types and respective contact angle values (q, °). SLA: Sandblasted/acid-etched
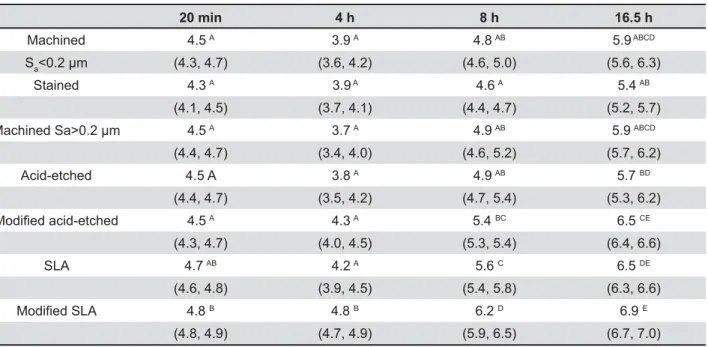
20 min 8 h 16.5 h
Machined 4.5 A 3.9 A 4.8 AB 5.9 ABCD
Sa (4.3, 4.7) (3.6, 4.2) (4.6, 5.0) (5.6, 6.3)
Stained 4.3 A 3.9 A 4.6 A 5.4 AB
(4.1, 4.5) (3.7, 4.1) (4.4, 4.7) (5.2, 5.7)
Machined Sa>0.2 μm 4.5 A 3.7 A 4.9 AB 5.9 ABCD
(4.4, 4.7) (3.4, 4.0) (4.6, 5.2) (5.7, 6.2)
Acid-etched 4.5 A 3.8 A 4.9 AB 5.7 BD
(4.4, 4.7) (3.5, 4.2) (4.7, 5.4) (5.3, 6.2)
9 J 4.5 A 4.3 A 5.4 BC 6.5 CE
(4.3, 4.7) (4.0, 4.5) (5.3, 5.4) (6.4, 6.6)
SLA 4.7 AB 4.2 A 5.6 C 6.5 DE
(4.6, 4.8) (3.9, 4.5) (5.4, 5.8) (6.3, 6.6)
9 [? 4.8 B 4.8 B 6.2 D 6.9 E
(4.8, 4.9) (4.7, 4.9) (5.9, 6.5) (6.7, 7.0)
Table 2-`###'=&\jQ=;# {$9 ;#Y|}{per group)
on the various surfaces at the given time points
between smooth and rough surfaces at respective $ # % used. One-way analysis of variance (ANOVA),
together with the post hoc Scheffé test, was applied to establish the differences between the different %[7Z
20 min 8 h 16.5 h
A. naeslundii Sa 3.1 (2.8; 3.4) 1.3 (1.2; 1.5) 2.5 (2.2; 2.8) 2.3 (2.3; 2.4)
Stained 3.1 (2.9; 3.2) 2.0 (1.4; 2.7) 2.2 (1.8; 2.7) 2.4 (2.2; 2.6) Sa>0.2μm 2.9 (2.8; 3.0) - 2.5 (2.3; 2.7) 2.4 (2.2; 2.7) acid-etched 3.3 (3.2; 3.5) 1.5 (1.3; 1.8) 2.2 (1.6; 2.8) 2.4 (2.2; 2.7) mod. acid-etched
SLA
3.4 (3.3; 3.6) 1.8 (1.3; 2.3) 2.8 (2.4; 3.2) 3.4 (3.3; 3.6)
SLA 3.7 (3.6; 3.9) 1.7 (1.4; 2.0) 3.2 (2.9; 3.6) 3.6 (3.2; 3.9) mod. SLA 3.9 (3.7; 4.0) 2.1 (1.7; 2.6) 3.7 (3.5; 4.0) 4.2 (3.7; 4.7)
V. dispar Sa 4.4 (4.2; 4.6) 3.8 (3.5; 4.1) 4.3 (4.2; 4.5) 5.9 (5.6; 6.3)
Stained 4.2 (4.0; 4.4) 3.8 (3.7; 4.0) 4.1 (4.0; 4.3) 5.4 (5.1; 5.6) Sa>0.2 μm 4.2 (3.9; 4.6) 3.5 (3.1; 4.0) 4.6 (4.3; 4.9) 5.9 (5.6; 6.2) acid-etched 4.4 (4.2; 4.6) 3.7 (3.4; 4.0) 4.4 (4.1; 4.7) 5.7 (5.2; 6.1) mod. acid-etched
SLA
4.5 (4.2; 4.7) 4.2 (3.9; 4.4) 4.9 (4.7; 5.2) 6.5 (6.3; 6.6)
SLA 4.5 (4.3; 4.7) 4.0 (3.8; 4.3) 5.3 (5.1; 5.5) 6.5 (6.3; 6.6) mod. SLA 4.6 (4.6; 4.7) 4.7 (4.5; 4.8) 5.9 (5.7; 6.1) 6.8 (6.5; 7.0)
F. nucleatum Sa 1.4 (1.2; 1.6) - -
-Stained 1.4 (1.3; 1.5) - -
-Sa>0.2μm - - -
-acid-etched 1.7 (1.2; 2.1) - -
-mod. acid-etched SLA
1.5 (1.3; 1.7) - -
-SLA 1.5 (1.2; 1.7) 1.5 (1.3; 1.7) -
-mod. SLA 1.7 (1.2; 2.1) - -
-S. sobrinus Sa 2.1 (1.6; 2.5) 2.3 (2.0; 2.7) 4.3 (3.8; 4.8) 4.4 (4.1; 4.7)
Stained 1.6 (1.4; 1.8) 2.2 (1.6; 2.7) 4.0 (3.7; 4.4) 4.0 (3.8; 4.2) Sa>0.2 μm 1.7 (1.5; 2.0) 2.1 (1.8; 2.4) 4.3(3.7; 4.9) 4.3 (4.1; 4.5) acid-etched 1.9 (1.6; 2.2) 2.6 (2.0; 3.2) 4.3 (3.4; 5.3) 4.5 (4.0; 4.9) mod. acid-etched
SLA
2.0 (1.6; 2.3) 3.1 (2.6; 3.6) 4.6 (4.0; 5.1) 4.8 (4.5; 5.1)
SLA 2.2 (1.9; 2.5) 3.1 (2.5; 3.7) 5.0 (4.4; 5.6) 5.1 (4.8; 5.4) mod. SLA 2.6 (2.3; 2.9) 3.5 (2.8; 4.2) 5.5 (5.0; 5.9) 5.6 (5.4; 5.9)
S. oralis Sa 2.0 (1.8; 2.3) 2.1
(1.9; 2.3)
2.1 (1.9; 2.3) 2.9 (2.6; 3.2) 3.9 (3.6; 4.2)
Stained 2.0 (1.7; 2.3) 2.1 (1.6; 2.5) 2.6 (2.2; 3.0) 3.4 (3.0; 3.7) Sa>0.2 μm 2.1 (1.9; 2.3) 1.9 (1.5; 2.2) 3.1 (2.7; 3.4) 3.6 (3.3; 3.8) acid-etched 2.0 (1.8; 2.6) 2.6 (2.3; 2.8) 3.3 (2.9; 3.6) 3.7 (3.4; 4.0) mod. acid-etched
SLA
2.6 (2.0; 3.2) 2.5 (2.2; 2.9) 3.5 (3.1; 3.8) 4.0 (3.8; 4.2)
SLA 2.4 (2.2; 2.5) 2.6 (2.1; 3.0) 3.7 (3.4; 4.0) 4.2 (4.0; 4.4) mod. SLA 2.5 (2.2; 2.9) 4.2 (4.0; 4.4) 4.7 (4.4; 5.1)
C. albicans Sa 3.0 (2.6; 3.3) 1.8 (1.6; 2.1) 2.4 (2.0; 2.7) 2.3 (2.1; 2.5)
Stained 3.1 (2.9; 3.2) 2.4 (2.0; 2.8) 2.2 (2.0; 2.4) 2.1 (1.8; 2.4) Sa>0.2 μm 3.2 (3.0; 3.4) 2.0 (1.7; 2.4) 2.7 (2.4; 2.9) 2.1 (1.7; 2.4) acid-etched 3.6 (3.3; 3.9) 2.0 (1.6; 2.5) 2.0 (1.6; 2.4) 2.0 (1.7; 2.3) mod. acid-etched
SLA
3.2 (3.1; 3.4) 2.3 (1.8; 2.9) 2.3 (1.9; 2.8) 2.4 (2.1; 2.7)
SLA 3.9 (3.8; 4.0) 3.1 (2.7; 3.5) 3.5 (3.1; 3.9) 3.0 (2.8; 3.1) mod. SLA 3.9 (3.8; 4.0) 3.6 (3.4; 3.9) 3.7 (3.5; 4.0) 3.2 (3.2; 3.3)
Table 3-&#'=#&\j;# {$9 ;#Q' ''
RESULTS
Surface roughness and wetting ability
The measured values are presented and summarized in Table 1.
Sa values >1 μm were only obtained for the SLA surfaces. The acid-etched surfaces had mean
Sa*@
% difference as compared to their un-activated counterparts. All other samples showed a mean surface roughness below 0.5 μm, with the more polished surface reaching mean Sa values of 0.1 μm.
With regard to the contact angle measurements, it can be summarize that the best wetting ability was achieved by the modified (i.e. activated) +^?*=^# # and SLA surfaces were the highest, with values of 121 and 134, respectively. This indicates very low surface wetting characteristics. The results of the polished and stained surfaces ranged between 92° and 93°.
%LR¿OPIRUPDWLRQ
summarized in Tables 2 and 3.
Figure 3A shows a SLA surface after incubation. A strong microbial colonization was evident after 16.5 h of incubation.
The mean number of microorganisms adhering to the discs after 20 min showed only minor differences between the groups and ranged between 4.5 to 4.8 log10 CFU. The highest initial adherence %!B> +**?=
>+3 =$ there was no growth on all surfaces observed. In contrast, all test groups showed a colonization decrease of 0.2 to 0.7 log steps, with the exception !B>$ adherence phase.
After 8 h, the particular pattern of microbial colonization on the different titanium surfaces persisted, however, at this time point there was % surfaces. In the following time period up to 16.5 h, growth continued further with a low but material +'=
Regarding the number of initially adhering microorganisms (Table 3), V. dispar showed by far
the strongest adherence to these titanium surfaces
+3=S. oralis and C. albicans exhibited
a one log step lower adherence.
After 4 h incubation, the microbial composition of
V. dispar remained
at the level of initial adherence. The numbers of S. oralis and C. albicans decreased dramatically while S. sobrinus, started to increase. F. nucleatum fell,
with one exception (SLA), below detection level.
>9 $% again: V. dispar increased by approx. 1 log step
reaching a level of log 5; S. sobrinus continued
to grow, almost attaining the level of V. dispar;
and S. oralis continued to grow, albeit at a lower
growth rate. The colonization density of C. albicans
remained unchanged.
From the 8 h reading to the end of the experiment at 16.5 h, microbial density continued to increase, but at a slower rate. It was evident that
V. dispar was primarily responsible for this increase,
produced by the streptococci as an energy source. Both streptococcal species only showed minute changes. The other species remained stagnant. F. nucleatum colonized during the entire experimental
period near or below detection level.
DISCUSSION
The results of this study support the hypothesis that regardless of the titanium’s surface roughness % properties, bacterial colonization was quite similar on all implant materials over time. The differences between the different colonization mass was within the range of one log step. That rough and smooth machined surface values showed quite comparable colonization in this study is in contrast to the existing opinion of a threshold value of 0.2 μm23.
# ` {%$ which has been validated in several studies10,11.
Although this model represents a supragingival plaque model, its relative ease to cultivate, as well ensuing development of subgingival plaque/peri-implantitis, allow for a realistic and reproducible laboratory simulation of the oral condition.
With the exception of C. albicans, all selected
bacteria are found in high numbers in supra-gingival plaque responsible for gingivitis. Colonization of implants preceding pocket formation is dependent J
microbiota responsible for peri-implantitis, including in addition high numbers of anaerobic Gram-negative bacteria, can only establish gradually J >~#
$ cannot be considered too far-fetched26.
The spatial arrangement and the associative behavior are well documented and the model has been used to assess different aspects in microbiology as well as clinically based and
10. Whereas the
%*'! adherence, in comparison with the acid etched and $ % !B>+*7=!B> surfaces (Pf<0.01). F. nucleatum remained, with one exception, below detection level. That is not "% ten years, this particular bacterial strain hibernated ?@7% saliva-preconditioned hydroxyapatite disks in the period between 16.5 h and 64.5 h. It appears that $ % % fastidious species. The proportion of F. nucleatum
in a study by Almaguer-Flores and co-workers was also low after 24 h, which supports our observation2.
Astonishingly low was also the adherence of the streptococci on all titanium surfaces. This is in "% or hydroxyapatite surfaces. Guggenheim and co-workers showed an initial adherence for S. mutans and S. oralis in the order of magnitude
of log 4 on pellicle-coated hydroxyapatite discs of similar size10J $
and chemical micro-surface characteristics should not be neglected, as it has been demonstrated in some studies that these factors, including the $J and growth of individual microorganisms2,3,9.
>3 h of incubation, detachment of all microorganisms was observed. The intensity of this shedding was primarily dependent upon the nature of the titanium surface structure and showed substantial differences between species. Consistent at this % (Pf<0.01) between the modified SLA surface, showing the highest number of microorganisms, and the titanium surfaces with a surface roughness < and >0.2. However, after 8 h, all species on all surfaces showed re-growth, with the exception of
C. albicans and S. sobrinus on the titanium surfaces
with surface roughness <0.2 and >0.2 μm. Up to 16.5 h growth continued and the colonization level of A. oris and V. dispar exceeded in numbers the
initial adherence counts. Both streptococcal species showed growth reaching the density of the initial adherence phase while the numbers of C. albicans
remained almost unchanged. This failure of C. albicans to grow, however, may be explained by
In summary, it was found that titanium disks with moderately rough surfaces tended to exhibit %$ differences in colonization density between the tested titanium surfaces did not reach statistical P appeared to be controlled not only by growth performed on sterile hydroxyapatite discs, this is
% titanium samples. In another laboratory study, the applicability of our model was assessed on other dental materials6. Similar to the present study, the
J # materials was tested. This earlier study showed J adherence after 15 min, but differences vanished following growth and maturation phases after 15 h, irrespective of whether rough or smooth surfaces were tested.
Within the limitations of the employed study design, the results are in line with implants of different surface characteristics, although moderately rough surfaces (Sa between 1 and 2 μm) tended towards higher plaque accumulation1.
A recently published in situ study revealed a
% ' smooth turned titanium surfaces, however, after 14 $ % $ J characteristics on adhesion was compensated for $% %
7. Another in vitro evaluation used
the same implant surface types and a slightly modified Zurich biofilm model incorporating 9 bacterial strains, which were assessed after a 24 h incubation using either culture medium or human saliva, with checkerboard analysis2. The saliva
incubation technique corresponds to our set-up and showed lower counts of bacteria as compared to culture medium. This study also showed that !B>!B> bacterial adhesion when using human saliva. The % # % by hydrophilicity of the surface. This observation is not supported by our results. This difference may be explained, only in part, by the different bacterial strains used but not by the microbiological evaluation techniques (culture versus checkerboard analysis).
The investigation of the initial adherence and growth of the 6 microbial species on these differently crafted titanium surfaces provided other interesting insights. The strongest initial adherence among the @ % exhibited by V. dispar and C. albicans. Among the
differently crafted titanium surfaces, adherence differences were very similar to those described for :;<K A. oris for these
conditions, but also, albeit to a minor extent, by the nature of the colonized surface. Although the the different titanium surfaces remained remarkably constant through out the experiment, the minute differences visible after the initial adherence phase became more prominent over time but ranged %
CONCLUSION
! J formation under the experimental conditions $%%%J From a clinical point of view, the implant surface needs daily meticulous oral hygiene. If this condition is met, then the choice of implant surface characteristics may be salient to the long-term %$ %% $J different titanium surfaces become irrelevant.
REFERENCES
1- Albrektsson T, Wennerberg A. Oral implant surfaces: Part 1 - review focusing on topographic and chemical properties of different surfaces and in vivo responses to them. Int J Prosthodont. 2004;17:536-43.
2- Almaguer-Flores A, Olivares-Navarrete R, Wieland $#;B>$! %$PPKJ formation on microstructured titanium surfaces in vitro. Clin Oral Implants Res. 2012;23:301-7.
3- Amoroso PF, Adams RJ, Waters MG, Williams DW. Titanium surface modification and its effect on the adherence of Porphyromonas gingivalis: an in vitro study. Clin Oral Implants Res. 2006;17:633-7.
4- Blanes RJ, Bernard JP, Blanes ZM, Belser UC. A 10-year prospective study of ITI dental implants placed in the J %## ratio and different prosthetic treatment modalities on crestal bone loss. Clin Oral Implants Res. 2007;18:707-14. 5- Busscher HJ, Rinastiti M, Siswomihardjo W, van der Mei :P materials. J Dent Res. 2010;89:657-65.
6- Dezelic T, Guggenheim B, Schmidlin PR. Multi-species patch. Oral Health Prev Dent. 2009;7:47-53.
7- Fröjd V, Chávez de Paz L, Andersson M, Wennerberg A, Davies JR, Svensater G. In situ analysis of multispecies Oral Microbiol. 2011;26:241-52.
8- Furst MM, Salvi GE, Lang NP, Persson GR. Bacterial colonization immediately after installation on oral titanium implants. Clin Oral Implants Res. 2007;18:501-8. 9- Groessner-Schreiber B, Hannig M, Dück A, Griepentrog M, Wenderoth DF. Do different implant surfaces exposed in the oral cavity of humans show different biofilm compositions and activities? Eur J Oral Sci. 2004;112:516-22.
10- Guggenheim B, Giertsen E, Schüpbach P, Shapiro S.
Validation of an in vitro
plaque. J Dent Res. 2001;80:363-70.
11- Guggenheim B, Guggenheim M, Gmür R, Giertsen $> to problems of cariology. Caries Res. 2004;38:212-22. 12- Jung RE, Pjetursson BE, Glauser R, Zembic A, Zwahlen M, Lang NP. A systematic review of the 5-year survival and complication rates of implant-supported single crowns. Clin Oral Implants Res. 2008;19:119-30.
13- Meffert RM. Periodontitis vs. peri-implantitis: the same disease? The same treatment? Crit Rev Oral Biol Med. 1996;7:278-91.
14- Mombelli A. Microbiology of the dental implant. Adv Dent Res. 1993;7:202-6.
15- Pjetursson BE, Tan K, Lang NP, Brägger U, Egger M, Zwahlen M. A systematic review of the survival and "+;K= observation period of at least 5 years. Clin Oral Implants Res. 2004;15:667-76.
16- Pontoriero R, Tonelli MP, Carnevale G, Mombelli A, Nyman SR, Lang NP. Experimentally induced peri-implant mucositis. A clinical study in humans. Clin Oral Implants Res. 1994;5:254-9.
17- Quirynen M, van der Mei HC, Bollen CM, van den Bossche LH, Doornbusch GI, van Steenberghe D. The J ## plaque microbiology. An in vivo study on implants. J Periodontol. 1994;65:162-7.
18- Quirynen M, Vogels R, Peeters W, van Steenberghe D, Naert I, Haffajee A. Dynamics of initial subgingival colonization of "pristine" peri-implant pockets. Clin Oral Implants Res. 2006;17:25-37.
19- Roos-Jansåker AM, Renvert H, Lindahl C, Renvert S. Nine- to fourteen-year follow-up of implant treatment. Part III: factors associated with peri-implant lesions. J Clin Periodontol. 2006;33:296-301.
20- Rupp F, Axmann D, Ziegler C, Geis-Gerstorfer J. > J AF-coated titania surfaces studied by dynamic contact angle analysis. J Biomed Mater Res. 2002;62:567-78. 21- Rupp F, Scheideler L, Rehbein D, Axmann D, Geis-Gerstorfer J. Roughness induced dynamic changes of % Biomaterials. 2004;25:1429-38.
22- Shapiro S, Giertsen E, Guggenheim B. An in vitro oral mouthrinses. Caries Res. 2002;36:93-100.
23- Teughels W, Van Assche N, Sliepen I, Quirynen M. Effect of material characteristics and/or surface : Res. 2006;17(Suppl 2): 68-81.
24- Thurnheer T, Gmür R, Shapiro S, Guggenheim B. Mass transport of macromolecules within an in vitro
model of supragingival plaque. Appl Environ Microbiol. 2003;69:1702-9.