Synthesis, Characterization and Electromagnetic Properties of SnO-coated FeNi Alloy
Nanocapsules
Mingling Lia,b*, Honglin Lia, Taotao Xua, Yu Niea
Received: November 25, 2015; Revised: July 13, 2016; Accepted: September 18, 2016
SnO-coated FeNi alloy nanocapsules have been synthesized by an arc-discharge method. High-resolution transmission electron microscopy and x-ray photoelectron spectroscopy analysis show that the nanocapsules have a shell/core structure with FeNi alloy nanoparticles as the core and amorphous SnO as the shell. Dielectric relaxation of SnO shell and the interfacial relaxation between SnO shell and FeNi core lead to the dual nonlinear dielectric resonance. The natural resonance in the
SnO-coated FeNi nanocapsules shifts to 14.0 GHz. Relection loss (RL) reaches -46.1 dB at 14.8 GHz for a matching thickness of 1.95 mm, while it exceeds-20 dB over the 13.6 -16.7 GHz range and it exceeds -10 dB in the whole Ku-band (12.4-18 GHz). In addition, the optimal RL values at 5.0-7.6 GHz with the absorbing thickness of 3.4-5.0 mm just exhibit a slight luctuation.
Keywords: FeNi, Nanocapsules, Complex permeability, Complex permittivity
* e-mail: [email protected]
1. Introduction
Owing to the wide applications of electromagnetic (EM)
waves in the GHz frequency range for mobile phone, local area network, radar systems and so on over the past few
decades, the serious problems of the EM interference and EM compatibility have become increasingly prominent in
recent years1-5. The use of microwave absorbing materials
is the efective and practical solution to reduce the EM interference and EM compatibility. The microwave absorbing material is a kind of absorber that can efectively attenuate the intensity of EM waves through dielectric and magnetic losses, or can transform the EM wave energy into thermal
energy6-8. Among the candidates for EM-wave-absorbers, magnetic nanocapsules have attracted particular interest
on account of the following facts: (1) the large saturation magnetization and high Snoek limit, (2) the suppression of the eddy current phenomenon, enhancing an efective incidence to EM-wave, and (3) being composites with diferent kinds of EM-absorber materials9,10. Recent studies on carbon-containing magnetic nanomaterials have become more
intensive, which can be used as EM interference shielding
and absorption materials, due to their lower density and larger resistivity compared with those of metallic magnets6-10. Core-shell structured nanocapsules are a special kind of nanocomposites, which are usually composed of cores and
shells of nanometer size that are made of diferent materials9. Zhang and co-workers reported that carbon-coated nickel and iron nanocapsules exhibited good microwave absorption properties because of special core/shell structure11,12. For
carbon-coated iron nanocapsules, the absorption range
for exceeding -10 dB is in 2-18 GHz for the absorber thickness of 1.54-7.50 mm and an optimal RL of -43.5 dB
was reached at 9.6 GHz with an absorber thickness of 3.1 mm 12. It is known that FeNi alloys as a kind of important
soft-magnetic materials have been widely applied in the ield
of electronic devices and industry, in which the permalloys
with nominal composition Ni81Fe19 (wt%) processes the
highest permeability13. Liu et al synthesized a series of carbon-coated FeNi alloy nanocapsules and investigated the
relationship between EM properties and microstructure in
detail9,13-15. The relection loss (RL) in carbon-coated FeNi nanocapsules by arc discharging a Fe90Ni10 ingot exceeds
-10 dB in the whole Ku-band for an absorber thickness of
2 mm 14. However, microwave absorbing materials based on carbon are unfavorable for practical application, due
to the bad thermal stability. As a result of good EM-wave
absorption, high-temperature steady and rich electron transport properties, the microwave absorption properties of the semiconductor-based nanocapsules, such as ZnO/ SiO2, ZnO/Ni, ZnO/Co, CuO/Cu2O/Ni, TiO2/Fe, SnO2/ Fe have recently aroused an increasing attention16-21. Due
to the good EM match between semiconductor shell and
magnetic cores, the above mentioned nanocapsules exhibit
the enhanced microwave absorption. Stannous oxide (SnO)
has been recently shown as promising transparent p-type oxide semiconductors22. Wang et al introduced SnO as the shell of α-Fe nanocapsules through the arc discharge
technique and investigated their EM performances in detail and reported that the RL exceeding -20 dB was obtained over 10.4-18 GHz for absorber thicknesses of 4-6.7 mm.
a College of Chemistry and Material Engineering, Chaohu University, Chaohu 238000, China
b Co-operative Innovation Research Center for Weak Signal-Detecting Materials and Devices
On the basis of high permeability of FeNi alloy and
good EM match between magnetic core and semiconductor
shell, the synthesis of SnO-coated FeNi alloy nanocapsules is imperative. SnO-coated FeNi nanocapsules have been prepared by the arc discharge method. SnO-coated FeNi alloy
nanocapsules shows good RL in every interval in the 2-18 GHz range with diferent layer thickness, which enriches the family of microwave absorbing materials. RL values exceeding -10 and -20 dB in broad frequency ranges have been observed corresponding to 70% and 99% absorption, respectively. In addition, the optimal RL values at 5.0-7.6
GHz with the absorbing thickness range from 3.4 to 5.0
mm just exhibit a slight luctuation and bandwidth(RL<-10)
becomes narrow with the thickness.
2. Experimental
Arc-discharge is a powerful method for preparing nanocapsules and capsulate-nanoparticles of metals with high melting points9-15. In this work, the SnO-coated FeNi nanocapsuels were fabricated by the arc-discharge method.
Metallic powders of Fe, Ni and Sn of 99.9 % purity with the
average size of 10 μm, were well mixed for preparation of a
target. The mixed powders with composition (Fe50Ni50)99Sn1
(at. %) were compacted into a cylinder shape with diameter of 20 mm under a pressure of about 20 MPa. The compressed
powders served as the anode. After the chamber was evacuated
(in a vacuum of 1.0×10⁻² Pa), a mixture of argon of 1.6×10⁴
Pa and hydrogen of 0.2×10⁴ Pa was introduced into the chamber. The arc-discharge current was maintained at 100
A for 2 h to evaporate alloys suiciently. Then the product
in the form of powder was collected, after passivated for 8 h in air.
The composition and phase purity of the as-synthesized
samples were analyzed by X-ray difraction (XRD) at 40 kV voltage and 50 mA current with Cu Kα radiation (λ=
1.5418 Å). Transmission electron microscopy (TEM) and high-resolution TEM (HRTEM) images were obtained on a JEOL JEM-2010 transmission electron microscope at
an acceleration voltage of 200 kV. Quantitative analysis of the elements present in the as-prepared products was performed by means of energy dispersive spectroscopy
(EDS).The surface composition was analyzed by an x-ray photoelectron spectroscopy (XPS) spectrometer, using Mg Kα line(1253.6 eV) excitation (Perkin Elmer PHI 1600 ESCA system). Magnetization measurements were carried out by a vibration sample magnetometer (VSM). The SnO-coated FeNi nanocapsules/parain composite was prepared by uniformly mixing FeNi/SnO nanocapsules with parain,
as described in detail elsewhere9-15, by homogeneously
mixing the nanocapsules with parain and pressing them
into cylinder-shaped compacts. Then the compact was
cut into toroidal shape with 7.00 mm outer diameter and 3.04 mm inner diameter The EM parameters for a FeNi/
SnO–parain composite containing 40 wt.% FeNi/SnO
nanocapsules are determined with the transmission and
relection coaxial line method. To ensure the measurement
precision, full two-port calibration was initially performed on the test setup to remove errors caused by the directivity, source match, load match, isolation, and frequency response
in both the forward and reverse measurements. In the range of 2-18 GHz, the scattering parameters (S11 and S21) were
measured by an Agilent 8722ES vector network analyzer.
The complex permeability and permittivity were determined
from the scattering parameters using the Nicolson-Ross (for magnetic) and precision (for nonmagnetic) models23.
3. Results and discussion
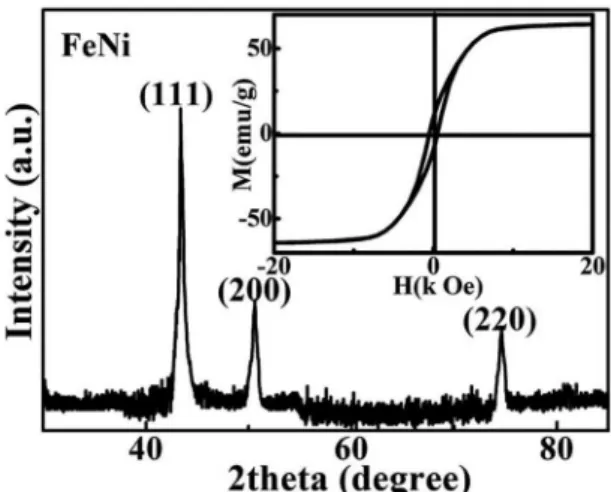
The XRD pattern shown in Figure 1 matches well with the cubic structure of FeNi alloy. There are no detectable peaks of metallic iron and nickel or their oxides. The result
indicates the successful formation of the FeNi alloy. It
should be noted that there is no evidence for the presence of crystalline SnO in the XRD pattern, indicating its small
amount (less than 3% in the samples). Furthermore, since SnO is on the shell of the nanocapsules, it is also diiculty
to detect its XRD pattern because of breaking down of the
periodic boundary condition (translation symmetry) along
radial direction. The inset of Figure 1 shows the hysteresis loop
of the nanocapsules at 295 K. The saturation magnetization
of the FeNi/SnO nanocapsules reaches 64.2 emu/g.
Figure 1: XRD pattern of the product. The inset is the magnetic
hysteresis loop at 295 K.
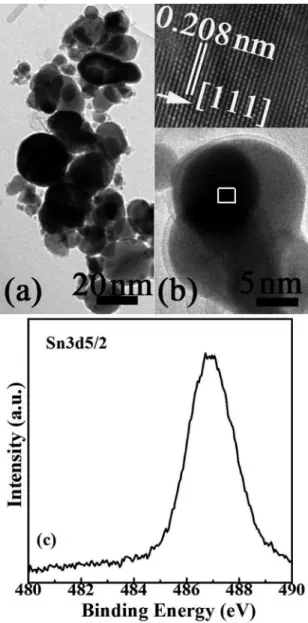
In Figure 2(a), the morphology and size distribution of the FeNi/SnO nanocapsules were investigated by TEM. Most
of the as-prepared nanocapsules are irregular sphere shape with the narrow distribution of diameters, ranging from 5 to 30 nm. The averaged diameter is about 23.6 nm, after
ingot and the as-prepared nanocapsules can be ascribed to the formation mechanism of the nanoparticles/nanocapsules, i.e.,
diferent evaporating pressures, melting points for iron and
nickel and tin atoms, during the arc-discharging process24.
For an evaporating pressure of 133 Pa, the corresponding evaporating temperatures are 1857 oC for Fe and 1907 oC for Ni and 1612 oC for Sn. The melting points of Fe, Ni and Sn are 1536, 1453 and 232 oC, respectively. In the evaporation
process, Sn atoms evaporate irst and then bump into each other. But Fe atoms and Ni atoms are easily to form alloy, due
to the similar structure and atom size. When the temperature
is decreased, the FeNi alloy irst forms a nucleus and the Sn
atoms are near them. At the end, these Sn atoms are abundant on the surfaces of the FeNi alloy nanoparticles. When the products are passivated and then exposed to air, Sn atoms are easily oxidized to amorphous SnO on the surfaces of the nanocapsules to form the core/shell structure21.
The frequency dependency on the real part (ε’) and imaginary part (ε’’) of the complex permittivity (ε) for nanocapsules-parain composite are shown in Figure 3(a). It can be found that there exist frequency intervals in
which the permittivity presents resonant characteristics. The maximum/minimum values can be found below/above the
resonant frequencies in the ε’ curve. Accordingly, two peaks
can be also observed near the resonant frequencies on the
ε’’ curve. These phenomena are the typical characteristic
of nonlinear resonant behaviors. The resonant frequencies
of ε in the current frequency range are 6.0 and 15.8 GHz, respectively. Dong et al. reported that the plot of ε’ versus ε’’ would be a single semicircle, which was usually deined
as the Cole-Cole semicircle26. It is worthy to note that the composite present a clear segment of two semicircles in
Figure 3(c), suggesting the existence of dual dielectric
relaxation processes, while each semicircle corresponds to a Debye dipolar relaxation26. During the activation of an
EM-wave, a redistribution process of the charges occurs
periodically between the FeNi cores and the SnO shells. As a result, apart from the dielectric relaxation of the SnO shells, an additional interfacial relaxation is present because a complete core/shell interface is constructed19,21. The dual dielectric losses are therefore achieved for the FeNi/ SnO nanocapsules, which are favorable for improving the microwave-absorption properties.
Figure 3 (b) shows the real part (µ’) and imaginary part (µ’’) of the relative complex permeability (µ) for which the µ’ values decreases from 1.2 to 1.08 with the frequency
in 2-13 GHz and exhibit an abrupt decrease from 1.08 to
1.0 at the 13-14 GHz range and decrease from 1.0 to 0.97 over 14-18 GHz. It is note worthy that the maximum value of the µ’’ appearing at 14.0 GHz implies that the natural
resonance occurred in the present FeNi/SnO nanocapsules,
which would be signiicant for their use as EM-wave
absorption materials in the microwave range. Compared with the bulk Fe, Ni and FeNi alloy, the natural resonance Figure 2: (a) TEM of SnO-coated FeNi nanocapsules and (b) HRTEM
image of FeNi nanocapsules, the inset is the HRTEM image of the dotted area in (b) and (c) XPS spectrum and the corresponding itting curves of the Sn 3d5/2 electrons on a etching depth of 1 nm.
a crystalline core and an amorphous shell. As shown in the
inset of Figure 2(b), the d-spacing of 0.208 nm in the core corresponds to the lattice plane {111} of FeNi in XRD. In
order to obtain more information, the FeNi/SnO nanocapsules
are investigated by XPS techniques. Figure 2(c) represents the XPS spectrum of Sn 3d 5/2 with etching depths of 1 nm. Because a broad peak between 486.6 eV and 487.0 eV
is consistent with the binding energy of Sn 3d 5/2 in SnO 24,25, the shells of nanocapsules can be identiied as SnO. The composition of the as-prepared FeNi/SnO nanocapsules is
estimated to be 49.02:46.16:2.42 (Fe: Ni: Sn) by EDS. So
the FeNi alloy core in nanocapsules is the permalloy, which
Figure 3: (a) Relative permittivity and (b) relative permeability
of FeNi/SnO nanocapsules-parain composite as a function of frequency; (c) Typical Cole-Cole semicircles for the composite; (d)
Values of μ’’(μ’)-2f-1 for the composite as a function of frequency.
frequency of FeNi/SnO nanocapsules remarkably shift to the higher frequency, ascribed to the remarkably increase
of surface anisotropic energy afected by very small size efect15. Similar phenomenon has been analyzed in detail in the previous work7-21. The contributors to magnetic loss, such as magnetic hysteresis, domain-wall displacement, and eddy current loss, can be excluded in the present FeNi/SnO nanocapsules. The hysteresis loss is mainly caused by the time
lags of the magnetization vector behind the external EM-ield vector and is negligible in weak applied ield17. Because the
size of Ni nanocapsules is less than single magnetic domain
(55 nm)26, the domain-wall displacement that only occurs
in multidomain magnetic materials can be excluded. If the
magnetic loss results from eddy current loss, the values of
µ’’(µ’)-2 f-1 should be constant when frequency is varied19. We
can call this the skin-efect criterion. As shown in Figure 3 (d), the values markedly decrease with increasing frequency.
Therefore, the magnetic loss in the present nanocapsules is mainly caused by the natural resonance.
The microwave-absorption properties of the FeNi/SnO nanocapsules have been derived by analyzing the permittivity and permeability data in terms of a model of a simple
one-layer absorber backed with metal. The RL curves were
calculated by means of the expression7-21
,
, ,
log
tanh tanh
RL
jZ kd
jZ kd
Z k c
20
1 1
10
f
n ~
nf =
+
-= =
U QQ VV Z
Where ω=2πfis the angular frequency of the incident
EM wave, d the thickness of the absorbing layer and c the
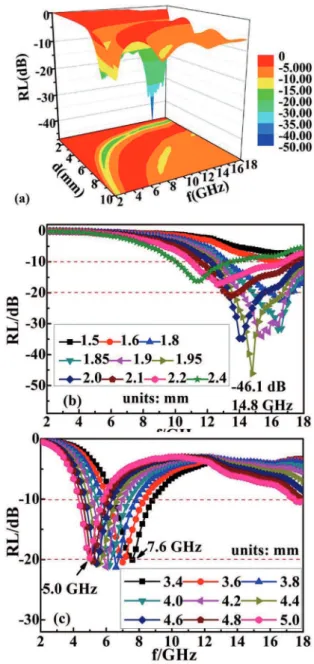
velocity of light. The RL is given in decibels. Figure 4 shows the obtained relationship between the RL and the EM-wave frequency for the nanocapsules-parain samples with various thicknesses in the 2-18 GHz range. The optimal RL or the dip
Figure 4: RL of FeNi/SnO nanocapsules-parain composites
as a function of thickness and frequency: (a) three dimensional representation with the thickness of 1.0-10.0 mm and (b) two dimensional representation with the thickness of 1.5-2.4 mm and (c)
two dimensional representation with the thickness of 3.4-5.0 mm.
in RL corresponds to the occurrence of maximum absorption or minimal relection of the microwave power for the particular
thickness27. BW-10 is deined as frequency diference between
points where RL value exceeds -10 dB corresponding to 70% absorption, while BW-20 means the frequency interval where
RL value exceeds -20 dB corresponding to 99% absorption. As shown in Figure 4(a), an optimal RL of -46.1 dB is
observed at 14. 8 GHz for 1.95 mm thickness layer, which
is thinner that the previous reported results. In Figure 4 (b), it is worthy noted that BW-20 is 3.1 GHz (13.6-16.7 GHz)
GHz) for the 1.95 mm thickness, which covers the whole Ku band (12.4-18 GHz). The thickness of 1.95 mm is thinner
than that of Ni/ZnO and that of FeNi/C nanocapsules9,17. The
intensity and the frequency at the relection loss minimum
depend on the properties and thickness of the materials27.
It is worth noting that the number of dips increases with an increase in sample thickness. It can be seen that there is only
one dip for 1-5 mm and dip shifts to lower frequency with increasing thickness of the layer, while two complete dips can be observed for 5-10 mm, respectively. The occurrence of the dips is found to be due to a successive odd number
multiple of the quarter wavelength (λ) thickness of the material or d=nλ/4 (n=1, 3)27.
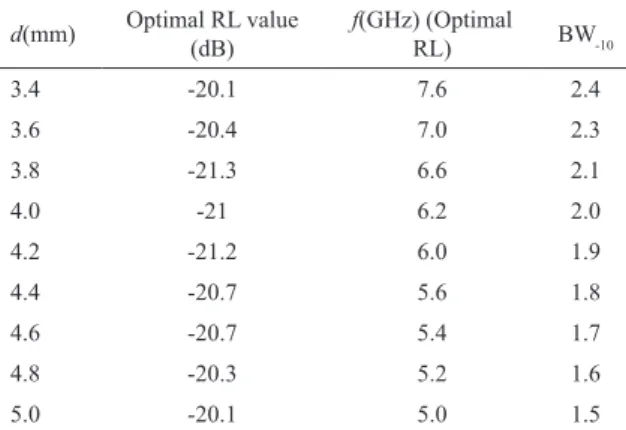
As shown in Figure 4(c) and Table 1, the optimal RL value at 5.0-7.6 GHz with the absorbing thickness of 3.4-5.0 mm just exhibits a slight luctuation and BW-10 becomes narrow with the thickness. For the nanocapsules with core/
shell microstructure, the optimal RL values are sensitive
with the absorbing thickness7-21. In our FeNi/SnO systems,
the optimal RL values with diferent absorbing thickness
can keep almost constant in a wide frequency range, which
is beneicial for the preparation of EM absorption devices.
Table 1: EM-wave absorption properties of nanocapsules with
diferent thickness.
d(mm) Optimal RL value (dB) f(GHz) (Optimal RL) BW-10
3.4 -20.1 7.6 2.4
3.6 -20.4 7.0 2.3
3.8 -21.3 6.6 2.1
4.0 -21 6.2 2.0
4.2 -21.2 6.0 1.9
4.4 -20.7 5.6 1.8
4.6 -20.7 5.4 1.7
4.8 -20.3 5.2 1.6
5.0 -20.1 5.0 1.5
4. Conclusion
The FeNi/SnO nancapsules with amorphous SnO as shells and FeNi alloy nanoparticles as cores have been prepared by arc-discharge technique. The saturation magnetization of the FeNi/SnO nanocapsules reaches 64.2 emu/g at 295
K. Dielectric relaxation of SnO shell and the interfacial
relaxation between SnO shell and FeNi core lead to the dual nonlinear dielectric resonance. The natural resonance in the SnO-coated FeNi nanocapsules shifts to 14.0 GHz. For 1.95
mm thickness layer, an optimal RL of -46.1 dB is observed at 14. 8 GHz, and BW-20 is 3.1 GHz (13.6-16.7 GHz), and
BW-10 is 5.6 GHz (12.4-18 GHz), which contains the whole
Ku band. With the absorbing thickness of 3.4-5.0 mm, the optimal RL value at 5.0-7.6 GHz just exhibits a slight luctuation and BW-10 becomes narrow with the thickness.
5. Acknowledgement
This study has been supported by the opening foundation
of Co-operative Innovation Research Center for Weak Signal-Detecting Materials and Devices Integration, Anhui University (No. 01001795-2014-02).
6. References
1. Han DD, Xiao NR, Hu H, Liu B, Song GX, Yan H. Ultrasmall
superparamagnetic Ni nanoparticles embedded in polyaniline as a lightweight and thin microwave absorber. RSC Advances.
2015;5:66667-66673.
2. Zhang XF, Guo JJ, Guan PF, Qin GW, Pennycook SJ. Gigahertz
dielectric polarization of substitutional single niobium atoms in defective graphitic layers. Physical Review Letters.
2015;115(14):147601.
3. Zhang XF, Liu YY, Qin GW. Break Snoek limit via superparamagnetic
coupling in Fe3O4/silica multiple-core/shell nanoparticles.
Applied Physics Letters. 2015;106(3):033105.
4. Zhao B, Zhao WY, Shao G, Fan BB, Zhang R.
Morphology-control synthesis of a core-shell structured NiCu alloy with tunable electromagnetic-wave absorption capabilities. ACS Applied Materials and Interfaces. 2015;7(23):12951-12960.
5. Li MF, Guo JJ, Xu BS. Superelastic carbon spheres under high
pressure. Applied Physics Letters. 2013;102(12):121904. 6. Jiang LW, Wang ZH, Geng DY, Lin YM, Wang Y, An J, et al. Structure
and electromagnetic properties of both regular and defective onion-like carbon nanoparticles. Carbon. 2015;95:910-918.
7. Wang H, Dai YY, Geng DY, Ma S, Li D, An J, et al. CoxNi100-x
nanoparticles encapsulated by curved graphite layers: controlled
in-situ metal-catalytic preparation and broadband microwave absorption. Nanoscale. 2015;7(41):17312-17319.
8. Sun YP, Liu XG, Feng C, Fan JC, Lv YH, Wang YR, et al. A facile
synthesis of FeNi3@C nanowires for electromagnetic wave absorber. Journal of Alloys and Compounds. 2014;586:688-92.
9. Liu XG, Li B, Geng DY, Cui WB, Yang F, Xie ZG, et al. (Fe, Ni)/C nanocapsules for electromagnetic-wave-absorber in the whole Ku-band. Carbon. 2009;47(2):470-474.
10. Wang ZH, He X, Wang X, Han Z, Geng DY, Zhu YL, et al. Magnetic and microwave-absorption properties of SnO-coated α-Fe(Sn) nanocapsules. Journal of Physics D: Applied Physics.
2010;43(49):495404.
11. Zhang XF, Dong XL, Huang H, Liu YY, Wang WN, Zhu XG, et al. Microwave absorption properties of the carbon-coated nickel
nanocapsules. Applied Physics Letters. 2006;89(5):053115.
12. Zhang XF, Dong XL, Huang H, Liu YY, Lv B, Lei JP, et al. Microstructure and microwave absorption properties of
carbon-coated iron nanocapsules. Journal of Physics D: Applied Physics.
2007;40(17):5383-5387.
13. Liu XG, Ou ZQ, Geng DY, Han Z, Wang H, Li B, et al. Enhanced absorption bandwidth in carbon-coated supermalloy FeNiMo
14. Liu XG, Ou ZQ, Geng DY, Han Z, Jiang JJ, Liu W, et al. Inluence of a graphite shell on the thermal and electromagnetic
characteristics of FeNi nanoparticles. Carbon. 2010;48(3):891-897.
15. Liu XG, Ou ZQ, Geng DY, Han Z, Xie ZG, Zhang ZD. Enhanced
natural resonance and attenuation properties in superparamagnetic graphite-coated FeNi3 nanocapsules. Journal of Physics D: Applied Physics. 2009;42(15):15504.
16. Fang XY, Shi XL, Cao MS, Yuan J. Micro-current attenuation
modeling and numerical for cage-like ZnO/SiO2 nanocomposite.
Journal of Applied Physics. 2008;104(9):096101.
17. Liu XG, Jiang JJ, Geng DY, Li BQ, Han Z, Liu W, et al. Dual
nonlinear dielectric resonance and strong natural resonance in Ni/ ZnO nanocapsules. Applied Physics Letters. 2009;94(5):053119.
18. Wei T, Jin CQ, Zhong W, Liu JM. High permittivity polymer
embedded with Co/ZnO core/shell nanoparticles modiied by
organophosphorus acid. Applied Physics Letters. 2007;91(22):222907.
19. Liu XG, Feng C, Or SW, Sun YP, Jin CG, Li WH, et al. Investigation on microwave absorption properties of CuO/Cu2
O-coated Ni nanocapsules as wide-band microwave absorbers.
RSC Advances. 2013;3(34):14590-14594.
20. Zhang Q, Li CF, Chen Y, Han Z, Wang H, Wang ZJ, et al. Efect
of metal grain size on multiple microwave resonances of Fe/ TiO2 metal-semiconductor composite. Applied Physics Letters.
2010;97(13):133115.
21. Liu XG, Zhou GP, Or SW, Sun YP. Fe/amorphous SnO2
core-shell structured nanocapsules for microwave absorptive and electrochemical performance. RSC Advances.
2014;4(93):51389-51394.
22. Caraveo-Frescas JA, Khan MA, Alshareef HN. Polymer ferroelectric ield-efect memory device with SnO channel layer
exhibits record hole mobility. Scientiic Reports. 2014;4:5243.
23. Lu B, Huang H, Dong XL, Zhang XF, Lei JP, Sun JP, et al. Inluence of alloy components on electromagnetic characteristics
of core/shell-type Fe-Ni nanoparticles. Journal of Applied Physics. 2008;104(11):114313.
24. Grutsch PA, Zeller MV, Fehlner TP. Photoelectron spectroscopy
of tin compounds. Inorganic Chemistry. 1973;12(6):1431-1433. 25. Fan JCC, Goodenough JB. X-ray photoemission spectroscopy studies of Sn-doped indium-oxide ilms. Journal of Applied Physics. 1977;48(8):3524-3531.
26. Dong XL, Zhang XF, Huang H, Zuo F. Enhanced microwave
absorption in Ni/polyaniline nanocomposites by dual dielectric relaxations. Applied Physics Letters. 2008;92(1):013127.
27. Yusof AN, Abdullah MH, Ahmad SH, Jusoh SF, Mansor AA, Hamid SAA. Electromagnetic and absorption properties
of some microwave absorbers. Journal of Applied Physics.