Abstract
Based on dynamic direct tensile tests, splitting tests and spalling tests, it is found that the experimental tensile strength of con-crete-like materials greatly increases with loading-rate. This kind of dynamic tensile strength enhancement may be caused by the combination influence of the inertia effect, real rate effect and end friction effect (here the end friction effect is only existed in split-ting and spalling tests). To further investigate the influence degree of real rate effect for concrete-like materials in dynamic tensile tests, this paper conducts systematically dynamic tensile experi-ments, viz. dynamic direct tensile tests, splitting tests and spalling tests. At the same time, numerical dynamic tensile tests are em-ployed to analyze the mechanical characteristics of concrete-like materials. A hydrostatic pressure dependent model, the Drucker-Prager constitutive model, is used for concrete-like material spec-imens, which can consider the influence of inertia effect. In the numerical model, the specimen is set to be rate-independent, thus the predicted dynamic tensile strength of specimens is free of the real rate effect. The end friction effect is also taken into account in the numerical analysis of dynamic splitting and spalling tests. It is found that the dynamic tensile strength of concrete-like materials in numerical simulations does not varies obviously with the load-ing-rate, indicating that the inertia effect and end friction effect have little contributions to the dynamic tensile strength enhance-ment of concrete-like materials. Therefore, the real rate effect dominates the dynamic tensile strength enhancement of concrete-like materials in laboratory tests, but the inertia effect and end friction effect do not.
Keywords
Real rate effect, tensile strength, concrete-like materials, experi-mental and numerical research
Further Investigation on the Real Rate Effect of Dynamic Tensile
Strength for Concrete-Like Materials
1 INTRODUCTION
Concrete-like materials take significant parts in infrastructure and defense engineering, whose me-chanical properties have already attracted much attention from structural designers and scientific
Shu Zhang a Yubin Lu a Xing Chen a Xiao Teng a Shuisheng Yu b
a Key Laboratory of Testing Technology for
Manufacturing Process of Ministry of Educa-tion, Southwest University of Science and Technology, Mianyang 621010, Sichuan, PR China
b Colege of Resources and Civil Engineering,
Northeastern University, Shenyang 110819, Liaoning, PR China
Corresponding author: Yubin Lu, e-mail ([email protected])
http://dx.doi.org/10.1590/1679-78251973
Latin American Journal of Solids and Structures 13 (2016) 201-223
the apparent rate effect. The dynamic performance of mortar under compressive and tensile loading was studied by Yang et al. (2015) based on splitting tests, and the results show that mortar is of rate sensitive. Cai et al. (2015) systematically conducted quasi-static and dynamic compressive tests to analyze the rate effect of granite, and numerical simulation method is employed to determine the true rate effect of granite through the uncoupled assumption of the rate effect, lateral inertia and end friction effect in SHPB tests. Lu et al. (2014) investigated the dynamic compressive behavior of recycled aggregate concrete specimens prepared with five different amount of recycled coarse aggre-gate [i.e. 0, 25%, 50%, 75%, and 100%], and the results show that recycled aggreaggre-gate concrete ex-hibits strong rate dependency. It is believed that the dynamic strength enhancement of concrete-like materials may have correlation with end friction, inertia and real rate effect in SHPB or SHTB tests. Among them, the dynamic tensile strength obtained from direct tensile tests is not affected by the end friction effect, for the absence of end friction in this type of tests. Zhang et al. (2009) studied the dynamic strength enhancement of concrete-like materials using tubular specimens, and conclud-ed that the radial inertia-inducconclud-ed confinement in concrete-like materials has large influence on the compressive strength enhancement. Hao et al. (2013) investigated the effect of end friction on the dynamic compressive strength of concrete specimens, and found that the influence of end friction is related to the slenderness ratio of specimens. Cotsovos and Pavlović (2008) claimed that the dy-namic tensile strength of concrete-like materials is directly linked to inertia effect, whose key influ-encing factors include the mass of specimens and boundary conditions. A similar argument was made by Hao et al. (2012), who imposed a model with both strain-rate insensitive and sensitive feature in AUTODYN (a FEM software), and discovered that the inertia effect has a great on the dynamic tensile strength increment. However, Hentz et al. (2004) used a discrete element method to study the dynamic tensile behavior of concrete, and deemed that the inertia effect cannot explain the tensile strength enhancement. Lu et al. (2011) employed a hydrostatic-stress-dependent macroscopic model without considering strain-rate effect in numerical simulations of three types of dynamic tensile tests, viz. dynamic direct tensile tests, dynamic splitting tests and spalling tests, and results show little strain-rate dependency, which indicated that the observed tensile strength enhancement with strain-rate in dynamic tensile tests was a genuine material effect.
Latin American Journal of Solids and Structures 13 (2016) 201-223 In this study, to systematically study the influence degree of real rate effect, laboratory experi-ments are prepared for measuring the tensile strength of concrete specimens. Besides, Drucker-Prager model in ABAQUS software, a widely used constitutive model for concrete-like materials, is employed to simulate the three types of dynamic tensile tests under comparable conditions with experiments in the macroscopic level. In Drucker-Prager constitutive model, material can be defined as rate-independency or rate-dependency. Concrete specimens are defined as rate-independency in this study, thus the predicted dynamic strength enhancement of specimens is free from the real rate effect. Accordingly, the real rate effect in laboratory experiments can be indirectly determined. Fi-nally, the numerical results from rate insensitive model are compared with experimental results, to further reveal the influence of real rate effect on concrete-like materials under dynamic tension.
The methods and results of three dynamic tensile experiments, i.e., dynamic direct tensile tests, dynamic splitting tests and spalling tests, will be introduced in section 2. The numerical simulation models of the three types of dynamic tensile tests are presented in Section 3. Comparison between numerical simulation results and experimental data together with discussions are given in Section 4. Conclusions are finally drawn in Section 5.
2 TENSILE TEST TECHNOLOGIES AND EXPERIMENTAL RESULTS
It is known that the dynamic strength of concrete-like materials increases significantly under high loading-rate. The dynamic increase factor (DIF), which is the ratio of dynamic strength to static strength, is introduced to represent the dynamic strength enhancement. According to this definition, the value of DIF and loading-rate s from tensile experiments can be obtained by the following equations, respectively, s s = DIF D St (1) D r T s
s= (2)
where sD is the dynamic tensile strength of specimens, sSt is the quasi-static tensile strength, and Tr is the critical rise time from the beginning to peak value of the transmitted wave signal in
corresponding positions of laboratory experiments.
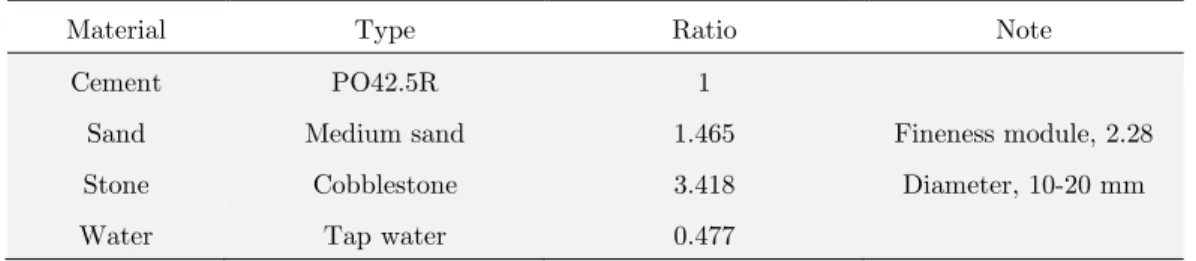
The composition of concrete specimens used in this study is shown in Table 1.
Material Type Ratio Note
Cement PO42.5R 1
Sand Medium sand 1.465 Fineness module, 2.28 Stone Cobblestone 3.418 Diameter, 10-20 mm
Water Tap water 0.477
Latin American Journal of Solids and Structures 13 (2016) 201-223
specimens are polished well to ensure the parallelism of specimens. The machined specimen is bond-ed with the loading plates with high strength adhesive [Figure 1(b)]. The adoptbond-ed adhesive is com-prised of methacrylate, and mixed with components such as flexibilizer, fortifier and stabilizer. The tensile and shear strength of the adhesive between steel and steel surface are both higher than 20 MPa, which largely exceeds the tensile strength of concrete. The adhesive is uniformly stirred and evenly smeared at the bonding surfaces between loading plates and specimens. Then the bonding part is placed alone about 20 minutes for the consolidation before loading. The length and diameter of concrete specimens is 100 mm, and 50 mm, respectively, which are limited by the testing set-up.
(a) MTS-815 Flex Test GT rock mechanics experimental system
Latin American Journal of Solids and Structures 13 (2016) 201-223 2.2 Dynamic Tensile Tests
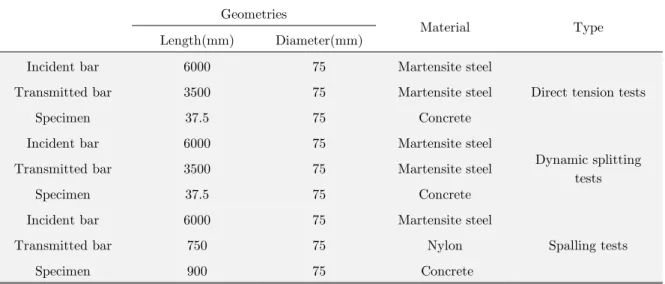
Dynamic tensile tests have two forms, namely direct and indirect tension. Direct tension tests are conducted on split Hopkinson tension bar (SHTB), as shown in Table 2. Geometries and materials of indirect tension test (dynamic splitting and spalling tests) set-up are also illustrated in Table 2.
Geometries
Material Type
Length(mm) Diameter(mm)
Incident bar 6000 75 Martensite steel
Direct tension tests Transmitted bar 3500 75 Martensite steel
Specimen 37.5 75 Concrete
Incident bar 6000 75 Martensite steel
Dynamic splitting tests Transmitted bar 3500 75 Martensite steel
Specimen 37.5 75 Concrete
Incident bar 6000 75 Martensite steel
Spalling tests
Transmitted bar 750 75 Nylon
Specimen 900 75 Concrete
Table 2: The geometries and materials of dynamic tensile test set-up.
2.2.1 Dynamic Direct Tension Tests
The SHTB device, as illustrated in Figure 2, includes incident bar, transmitter bar, projectile and strain gauges. Specimens should have inseparable connections with both the incident bar and transmitter bar. Once the connection is unstable, the region of specimens nearby the incident bar or transmitter bar/specimen interface will be in triaxial tensile state and is prone to facture. Therefore, the fastening method is a key technique to ensure the success of dynamic direct tension tests. In this study, the connection method of winding several layers of steel wires and using the above men-tioned high strength adhesive on the bonding surfaces between bars and specimens is introduced to avoid the unstable connection problem, as shown in Figure 3.
Latin American Journal of Solids and Structures 13 (2016) 201-223 (b)
Figure 2: Illustration of the SHTB device.
(a) (b) (c)
Figure 3: The fastening method and fracture mode in dynamic direct tensile tests.
To ensure the stress equilibrium and eliminate the wave oscillation, soft rubber of 20 mm in di-ameter and 1.5 mm in thickness is used as pulse shapers through several trial tests, as shown in Figure 4. With the propagation of tensile stress waves, concrete specimens are loaded by the tensile stress wave and internal microcracks generate in specimens until the eventual damage occurs. A typical pulse signal obtained from strain gauges in a dynamic direct tensile test is shown in Figure 5.
Figure 4: The positions of pulse shapers in a dynamic direct tension test.
Latin American Journal of Solids and Structures 13 (2016) 201-223 The tensile stress sa, strain ea, and loading-rate sa of specimens in dynamic direct tension tests can be calculated from the following equations, respectively,
( )
( )
( )
0 0 (t)
2
a i r t
S A
p E t t t
A e e e
é ù
= êë + + úû (3)
( )
( )
( )
t
i r t
s v
t t t dt
l a
e =
ò
éêëe +e +e ùúû (4)a a
r T
s
s = (5)
where sa is the maximum of stress pa(t) and sa is the loading-rate in dynamic direct tension
tests, ea is the strain history of concrete specimens in dynamic direct tension tests, vt and ls is the
stress wave velocity of Hopkinson bar and the length of specimen, respectively, A0 and AS is the
original cross-sectional area of pressure bars and specimens, respectively, E0 is the elastic modulus
of pressure bars, ei
( )
t , er( )
t , and et( )
t is the strain signal of incident, reflected and transmittedwave, respectively.
2.2.2 Dynamic Splitting Tests
Dynamic splitting tests have been accepted as regular tests for determining the dynamic tensile strength of concrete-like materials. Based on the SHPB device of 75 mm in diameter (as shown in Figure 6), dynamic splitting tests (Brazilian tests) of concrete specimens are conducted for the measurement of dynamic tensile strength in a certain range of loading-rates.
Latin American Journal of Solids and Structures 13 (2016) 201-223 (b)
Figure 6: Illustration of the dynamic splitting test set-up.
Similarly, soft rubber pulse shapers of 20 mm in diameter and 1.5 mm in thickness are em-ployed to avoid the stress non-equilibrium problem in dynamic splitting tests and a foam block is used for the balance of specimens, as shown in Figure 7.
(a) (b)
Figure 7: The position of pulse shapers and foam block under the specimen in a dynamic splitting test.
Latin American Journal of Solids and Structures 13 (2016) 201-223 The original pulse signal obtained from strain gauges in a dynamic splitting test is shown in Figure 8. Using the measured three strain waves, the loading force pb on specimens in the dynamic
splitting tests can be estimated by the function below,
2 0
(t) ( (t) (t) (t)) 2
b i r t
E R
p =p e +e +e (6)
in which R is the radius of pressure bars.
Therefore, Pmax, the maximum value of pb(t), can be obtained from Equation 6. The dynamic
splitting tensile strength sb and loading-rate sb is calculated by the following function, respective-ly, max 2 b P LD s p = (7) b b r T s
s = (8)
where D and L is the diameter and length of specimens, respectively.
2.2.3 Spalling Tests
The spalling test technique, based on SHPB, is also developed to measure the dynamic tensile strength of concrete-like materials. Because of the spalling phenomenon, specimens are divided into two or more parts by the tensile wave from the reflection of compression wave at the end between specimens and nylon bars (transmitter bar). The scheme of the spalling test set-up is shown in Fig-ure 9. To ensFig-ure low porosity and high casting quality of spalling test specimens, following steps are employed. Firstly, the mould made from polyvinyl chloride (PVC) pipe with internal diameter of 75 mm and length a little bit longer than 900 mm is used. The mould is placed on the flat position horizontally. Then the method of grouting concrete grout into the mould for several times is adopt-ed. Each time enough vibration with the vibrating spear is appliadopt-ed. Besides, the vibrating duration and the concrete grout quantity added to the mould are strictly controlled for each time. After demoulding, all specimens are preserved for 28 days in a standard curing box, according to the Chi-nese national code, GB/T-50081(2002). After curing, specimen ends are polished to assure good parallelism and specimen length of 900 mm.
Latin American Journal of Solids and Structures 13 (2016) 201-223 (b)
Figure 9: Illustration of the spalling test set-up.
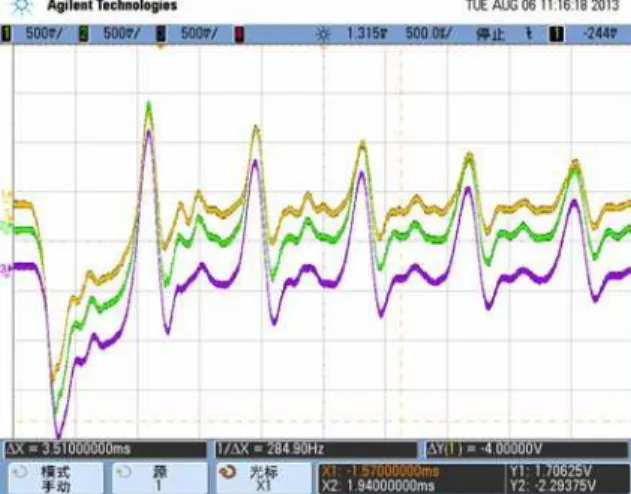
Figure 10: The original pulse signal from strain gauges on the transmitter bar in a spalling test.
The compression wave caused by the impact of projectiles propagates along the incident bar in-to the long concrete specimen. When the compression wave transmits in-to the interface between spec-imens and nylon bars, because of the different wave impedance between concrete and nylon, part of the compression wave reflects to be the tensile wave propagating back to the concrete specimen and the rest propagates to the nylon bar. The compressive pressure is less than the concrete compressive strength, but the tensile pressure is greater than the concrete tensile strength. Therefore, the speci-men starts spalling damage under the tensile wave. Meanwhile, the rest of compression wave propa-gates to the nylon bar in the process of spalling, leading to the increase of contact pressure in the interface between specimens and transmitter bars. The position, material and size of pulse shapers on the incident bar in spalling tests are same with those in dynamic splitting tests. The original pulse signal obtained from strain gauges on transmitter bar in a spalling test is shown in Figure 10. According to Zhang et al. (2006, 2008), the spalling strength sp and loading-rate sp can be
calcu-lated from the following expressions,
s =s
-max(x) max(0)e ax
(9)
Latin American Journal of Solids and Structures 13 (2016) 201-223
r r
= s s l l
n v v (11)
s =1[(smax+smin)-n(smax-smin)] 2
p (12)
s s = p
p r
T (13)
in which x is a variation for the distances between the three strain gauges on transmitter bar and
transmitter bar/specimen interface, and smax(x) and smin(x) is the maximum and minimum of measured stress from the strain gauge on transmitter bar, respectively, a is the attenuation coeffi-cient for smax(0) and g is the fitting coefficient for smin(0); smax(0) and smin(0) is the maxi-mum and minimaxi-mum of calculated stress on transmitter bar/specimen interface, respectively; n is the wave impedance ratio of concrete specimens and transmitter bars, r is density,
v
is the elastic wave speed, and the subscripts ofs
and l stand for concrete specimens and transmitter bars, re-spectively; sp is the loading-rate in spalling tests.2.3 Experimental Results of Apparent Rate Effect
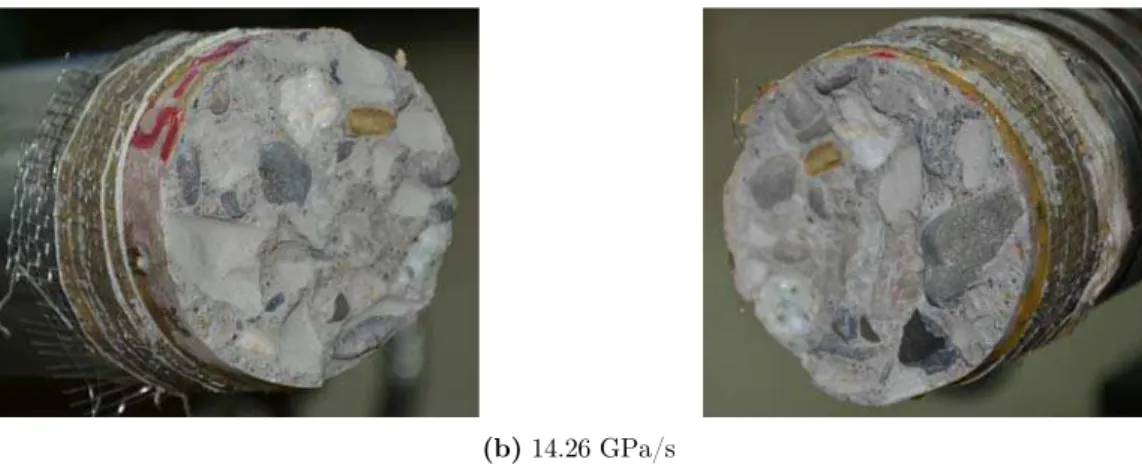
In dynamic direct tensile tests, typical failure patterns of specimens under different loading-rates are shown in Figure 11. It is observed that specimens exhibit different failure pattern under different loading-rate, viz., the fracture surface seems to be smoother and more aggregates are broken under higher loading-rate. In Figure 11(a), the fracture of concrete specimens mostly occurs along the interface between mortar matrix and aggregate. While in Figure 11(b), some fractures initiate inside aggregates and finally these aggregates are broken up.
Latin American Journal of Solids and Structures 13 (2016) 201-223 (b) 14.26 GPa/s
Figure 11: Different failure patterns of specimens in dynamic direct tensile tests.
Stress-strain curves of concrete specimens under various loading-rates in dynamic direct tests are shown in Figure 12, where the stress is calculated through Equation 3 and the strain is deter-mined by Equation 4. The dynamic stress initially increases greatly with the strain until the peak point, and after the peak point the stress gradually decreases to zero. From Figure 12, the dynamic tensile strength of concrete specimens clearly shows rate enhancement with the loading-rate. Both failure pattern and dynamic tensile strength of concrete specimens are thus dependent of the load-ing-rate.
Figure 12: Stress-strain curves of concrete specimens in dynamic direct tension tests
Latin American Journal of Solids and Structures 13 (2016) 201-223
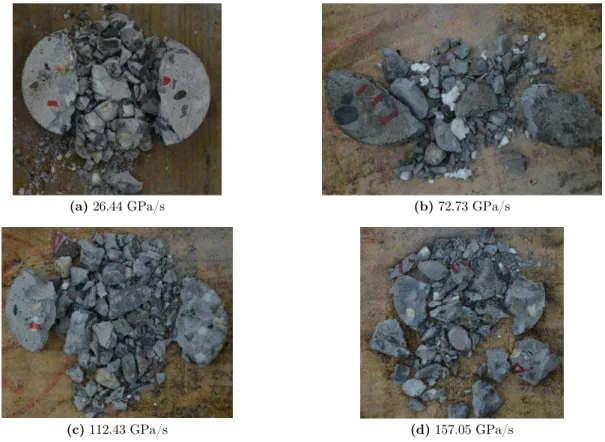
(a) 26.44 GPa/s (b) 72.73 GPa/s
(c) 112.43 GPa/s (d) 157.05 GPa/s
Figure 13: Crushing pictures of concrete specimens under various loading-rates in dynamic splitting tests.
In spalling tests, the fracture features of concrete specimens under different loading-rates are shown in Figure 14. It is observed that the fracture feature of concrete specimens performs differ-ently and relates to the loading-rate. The higher loading-rate, more fragment pieces are produced and the fracture surfaces are flatter. It can be explained that when the amplitude of compressive stress wave reach the damage threshold of concrete specimens, damage will generate inside the con-crete specimens. Under lower loading-rates, the damage caused by the compressive stress wave usu-ally concentrates at fewer locations, and thus specimens fracture into lesser parts when the tensile stress wave transmits back from the specimen end. However, under higher loading-rates, as the loading time is short, the damage is likely to distribute at more locations, and thus specimens dam-age into more parts.
Latin American Journal of Solids and Structures 13 (2016) 201-223 (c) 88.80 GPa/s
(d) 59.22 GPa/s (e) 88.80 GPa/s
Figure 14: Fracture features of concrete specimens under different loading-rates in spalling tests.
The average quasi-static tensile strength of concrete specimens tested in this study is 1.95 MPa. DIF and loading-rate of concrete specimens are calculated from Equations above. Comparison be-tween data obtained from previous works [Zhang et al. (2010), Tedesco et al. (1989) and Bara et al. (2001)] and the experimental data from dynamic tensile tests in this study is shown in Figure 15, where s0 is the reference loading-rate, which is defined as 1 GPa/s. The loading-rate of quasi-static tensile tests can be calculated by the following function,
sst =Eel (14)
where sst and el is the loading-rate and strain-rate of quasi-static tensile tests, respectively, and E is the elastic modulus of concrete specimens.
Latin American Journal of Solids and Structures 13 (2016) 201-223 et al. (2001) exist large difference. Reasons may due to the difference of geometries and material properties of specimens among them.
Figure 15: The influence of loading-rate on the DIF of dynamic tensile strength for concrete specimens.
From Figure 15, it is found that the DIF observably increases with the loading-rate. The appar-ent rate effect, which is the combination effect of real rate sensitivity, inertia confinemappar-ent and end friction, indeed exists in dynamic tensile strength. However, in experiments the influence of real rate effect on dynamic tensile strength enhancement could not be separated from the apparent rate ef-fect caused by inertia confinement and end friction. Thus, numerical simulations are performed to determine the influence degree of real rate effect on the experimental DIF.
3 NUMERICAL SIMULATIONS
3.1 Parameters of Numerical Simulations
The Druker-Prager model in ABAQUS is a well-known computational code for simulating concrete-like materials. The linear form of the extended Drucker-Prager model in ABAQUS (defined as D-P model below) is written as,
tan 0
F = -L p b- =d (15)
where L is a pseudo-effective stress defined by
3
1 1
1 1
2
q r
L
K K q
é æ öæ ö ù
ê ç ÷ ÷÷ ÷ç ú = ê + - -ççç ÷ ÷÷ ÷ççç ú
ê è øè ø ú
ê ú
ë û
(16)
with
r
being the third invariant of the deviatoric stress, q being the Mises equivalent stress, andLatin American Journal of Solids and Structures 13 (2016) 201-223
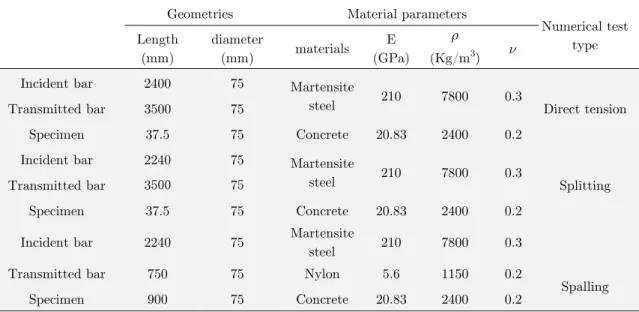
study, since the yield behavior of concrete depends on the hydrostatic pressure, the D-P model is chosen to simulate concrete specimens. The hydrostatic pressure is influenced by the inertial pres-sure. As explained by Wang (2007), specimens will stretch under dynamic tensile impact loading, the radial deformation of specimens will happen due to Poisson’s effect, and thus radial stress will generate in the opposite direction of radial deformation because of inertia effect. Therefore, speci-mens are in the triaxial stress state and the hydrostatic pressure will increase. The increase of hy-drostatic pressure will enhance the dynamic tensile strength of concrete specimens. This kind of dynamic tensile strength enhancement is attributed to the increase of hydrostatic pressure caused by the existence of inertia-induced radial stress. According to Li et al. (2009), the internal friction angle and dilation angle are taken to be 40, and the flow stress ratio is taken to be 1 in this study. The geometries and material parameters of the numerical models are shown in Table 3.
Geometries Material parameters
Numerical test type Length
(mm)
diameter
(mm) materials E (GPa)
r
(Kg/m3) n Incident bar 2400 75 Martensite
steel 210 7800 0.3 Direct tension Transmitted bar 3500 75
Specimen 37.5 75 Concrete 20.83 2400 0.2 Incident bar 2240 75 Martensite
steel 210 7800 0.3 Splitting Transmitted bar 3500 75
Specimen 37.5 75 Concrete 20.83 2400 0.2 Incident bar 2240 75 Martensite
steel 210 7800 0.3
Spalling Transmitted bar 750 75 Nylon 5.6 1150 0.2
Specimen 900 75 Concrete 20.83 2400 0.2
Note: the length of incident bar in this table is the distance from the strain gauge on incident bar to the interface between specimens and incident bars
Table 3: The model parameters of dynamic direct tension, splitting, and spalling tests.
Latin American Journal of Solids and Structures 13 (2016) 201-223 Figure 16: The quasi-static tensile stress-strain curve for concrete specimens.
The contribution of inertia effect to the dynamic tensile strength enhancement of concrete-like materials cannot be individually obtained from laboratory tests. However, it can be easily deter-mined in numerical simulations, by defining rate independent material properties. Therefore, the numerical results, which ignore the real rate effect, can disclose the influence degree of inertia effect. Accordingly, the real rate effect on the dynamic tensile strength from laboratory tests for concrete-like materials can be determined.
3.2 Model of Dynamic Direct Tensile Tests
The CAX4R element (4-node bilinear axisymmetric quadrilateral, reduced integration, hourglass control) is employed and the element size is defined as 0.5 mm×0.5 mm. The total computing time is set as 1300 μs. In the axisymmetric model, the interaction between specimens and bars is defined as “tie” constraint, the radial movement of the symmetry axis is limited, and one end of incident bars is imposed by different tensile stress, as illustrated in Figure 17.
Figure 17: The numerical model of dynamic direct tension tests.
The distance between the strain gauge on the incident bar and incident bar/specimen interface is 2.4 m. The stress wave amplitude obtained from this strain gauge in laboratory experiments and smoothed data are shown in Figure 18. In this study, the smoothed loading amplitude curve is em-ployed on the incident bar.
Latin American Journal of Solids and Structures 13 (2016) 201-223
Figure 18: The amplitude of incident wave in laboratory tests and its smoothed curve.
From the numerical results, it is found that the maximum stress of all elements is very close to the quasi-static strength. The laboratory tests show that the specimen fails from the middle part. Therefore, the numerical predicted tensile strength of specimens is obtained from the peak stress of middle element on the symmetrical axis, as illustrated in Figure 19. The stress-time curve under the stress loading of 50 MPa is shown in Figure 20.
Figure 19: The position of element where tensile strength is obtained.
Figure 20: The history of stress of the element.
Loading-rate is represented by Equation 5, and the rise-time is obtained from the element corre-sponding with the location of strain gauge on transmitter bar in laboratory experiments.
3.3 Model of Dynamic Splitting Tests
Latin American Journal of Solids and Structures 13 (2016) 201-223 as illustrated in Figure 21. The calculating time is designated as 1200 μs. The curve of loading am-plitude is shown in Figure 22.
Figure 21:The numerical model of dynamic splitting tests.
Figure 22:The curve of loading amplitude. Figure 23: The stress-time of the specimen.
The dynamic splitting strength obtained from the specimen under the stress loading of 300 MPa is shown in Figure 23. The loading-rate in dynamic splitting tests can be calculated by Equation 8. The rise-time is the relevant time determined from the initiation to the maximum of transmitted stress wave, obtained from the element on transmitter bar which has same position with the strain gauge in laboratory experiments.
3.4 Model of Spalling Tests
Latin American Journal of Solids and Structures 13 (2016) 201-223 The stress can be obtained by the equation below,
d s =1r
2
ts s s
p
u L
t (17)
in which sts is the spalling strength of specimens in numerical simulations, rs is the density of specimens, du is the velocity difference of particle velocity on the specimen end nearby the trans-mitter bar, and tp is the propagation time of stress-wave in specimens.
The propagation time tp can be calculated through the time difference of the stress at incident
bar/specimen interface and particle velocity at another end of the specimen, as shown in Figure 25. The loading-rate is obtained by Equation 13 and the rise-time is obtained in the same way with the numerical simulation of dynamic splitting tests.
Figure 25: Stress at the incident bar/specimen interface and particle velocity at the end of specimen.
4 COMPARISON AND DISCUSSION
Latin American Journal of Solids and Structures 13 (2016) 201-223 while the critical rise time reduces with increasing loading-rate. The comparison of stress-strain curves between those obtained from dynamic direct tensile experiments and numerical simulations is shown in Figure 27. It can be discovered that the predicted dynamic tensile strength of concrete specimens, which is defined as rate insensitivity, does not increase with the increase of loading-rate.
Figure 26: Predicted stress histories of specimens under different loading-rates.
Figure 27: The comparison of stress-strain curves between dynamic direct tensile experiments
and numerical simulations.
Based on available experimental data and numerical results, the relationship between DIFs and loading-rate of concrete specimens is presented in Figure 28 for comparison purpose. It is clear that the predicted DIFs obtained from rate insensitive model are almost independent of loading-rates, and the experimental DIFs are significantly greater than the numerical predicted DIFs. Therefore, the tensile DIFs obtained from those dynamic tensile experiments reflect the true dynamic tensile stress enhancement of concrete-like materials, which can be directly used in the design and numeri-cal models.
Figure 28: The comparison of numerical DIFs with the experimental ones under different loading-rates.
Latin American Journal of Solids and Structures 13 (2016) 201-223 effect in dynamic tension tests is not obvious, as shown in Figure 29(b).
(a) Dynamic compression (b) Dynamic tension Figure 29: The inertial stress in dynamic uniaxial tests.
5 CONCLUSIONS
This paper conducts laboratory experiments and numerical simulations to study the influence of end friction, inertia and real rate effect on tensile DIFs of concrete-like materials. The DIFs observ-ably increase with the loading-rate in laboratory tests, and the influence caused by the real rate effect cannot be separated from DIFs obtained from the experiments. Therefore, the D-P model is employed to indirectly analyze the contribution of real rate effect to the experimental DIFs of con-crete-like materials, and parameters of numerical models are obtained based on the laboratory ex-periments. Persuasive comparisons between experimental data and numerical results are made to further study the contribution of real rate effect to the DIFs of concrete-like materials in dynamic tensile tests. Finally, it is found that the apparent dynamic tensile strength enhancement obtained from dynamic tensile experiments of concrete-like materials is mainly associated with the real rate effect and almost independent of others. Therefore, the real rate effect is the dominant factor to cause dynamic tensile strength enhancement of concrete-like materials in laboratory tests.
Acknowledgement
This work was supported by the National Natural Science Foundation of China (No. 51308480) and NSAF (No. U1430110). Authors also appreciate Prof. Xiquan Jiang’s support for doing dynamic tensile tests in Army Officer Academy of PLA.
References
Latin American Journal of Solids and Structures 13 (2016) 201-223 Cai, Y., Yu, S.S., Lu, Y.B., (2015). Experimental study on granite and the determination of its true strain-rate effect, Latin American Journal of Solids and Structures 12:675-694.
Cotsovos, D.M., Pavlović, M.N., (2008). Numerical investigation of concrete subjected to high rates of uniaxial ten-sile loading, International journal of impact engineering 35: 319-335.
GB-50010 (Ministry of Construction of PRC) (2002). Code for design of concrete structure.
GB/T-50081 (Ministry of Construction of PRC) (2002). Standard for test method of mechanical properties on ordi-nary concrete.
Hao, Y., Hao, H., Zhang, X.H, (2012). Numerical analysis of concrete material properties at high strain rate under direct tension, International Journal of Impact Engineering 39:51-62.
Hao, Y., Hao, H., Li, Z.X., (2013). Influence of end friction confinement on impact tests of concrete material at high strain rate, International journal of impact engineering 60:82-106.
Hentz, S., Donzé, F.V., Daudeville, L., (2004). Discrete element modeling of concrete submitted to dynamic loading at high strain rates, Computer and Structures 82:2509-2524.
Li, Q.M., Meng, H., (2003). About the dynamic strength enhancement of concrete-like materials in a SHPB, Inter-national journal of solids and structures 40:343-360.
Li, Q.M., Lu, Y.B., Meng, H., (2009). Further investigation on the dynamic compression strength enhancement of concrete-like materials based on split Hopkinson pressure bar tests. Part II: Numerical simulations, International Journal of Impact Engineering 36 :1335-1345.
Lu, Y.B., Li, Q.M., (2011). About the dynamic uniaxial tensile strength of concrete-like material, International jour-nal of impact engineering 38:171-180.
Lu, Y.B., Chen, X., Teng, X., Zhang, S., (2014). Dynamic compressive behavior of recycled aggregate concrete based on split Hopkinson pressure bar tests, Latin American Journal of Solids and Structures 11:131-141.
Park, S.W., Xia, Q., Zhou, M., (2001). Dynamic behavior of concrete at high strain rates and pressures: II. numerical simulation, International journal of impact engineering 25:887-910.
Ragueneau, F., Gatuingt, F., (2003). Inelastic behavior modeling of concrete in low and high strain rate dynamics, Computer and Structure 81:1287-1299.
Tedesco, J.W., Ross, C.A., Brunair, R.M., (1989). Numerical analysis of dynamic split cylinder tests, Computers and Structures 32:609-624.
Wang, Y.H., (2007). Study on the impact compressive behavior of reactive powder concretes, Master Thesis (in Chinese), Beijing Jiaotong University, China.
Yang, F., Ma, H.W., Jing, L., Zhao, L.M., Wang, Z.H., (2015). Dynamic compressive and splitting tensile tests on mortar using split Hopkinson pressure bar technique, Latin American Journal of Solids and Structures 12:730-746. Zhang, L., Hu, S.S., (2006). A novel experimental technique to determine the spalling strength of concretes, Explo-sion and Shock Waves 26:537-542. (in Chinese)
Zhang, L., Hu, S.S., Chen, S.X., Zhang, S.B., Yu, Z.Q., Liu, F., (2008). Spalling characteristics of concrete, Explosion and Shock Waves 28:193-199. (in Chinese)
Zhang, L., Hu, S.S., (2009). An experimental technique for spalling of concrete, Experimental Mechanics 49:523-532. Zhang, M., Wu, H.J., Li, Q.M., Huang, F.L., (2009). Further investigation on the dynamic compressive strength enhancement of concrete-like materials based on split Hopkinson pressure bar tests, International Journal of Impact Engineering 36:1327-1334.