This paper presents a study for improving measurement procedures on concrete dams based on the development of behavior prediction models using multiple regression and control charts. The series of displacements of the TA-2 concrete block crest of the Tucuruí Hydroelectric Power Plant, the largest Brazilian hydroelectric power plant, was taken as an example of application. The methodology that was used generated a behav-ior prediction model that is in good agreement with the measured displacements. Two types of control charts were tested, both of which identiied the change in structural behavior of the block.
Keywords: concrete dams, prediction models, control charts, safety control.
Um estudo para a melhoria dos procedimentos de auscultação de barragens de concreto é apresentado neste trabalho a partir do desenvolvi-mento de modelos de previsão de comportadesenvolvi-mento baseados em regressão múltipla e gráicos de controle. Tomou-se como exemplo de aplicação a série histórica dos deslocamentos da crista do bloco de concreto TA-2 da UHE Tucuruí, maior usina hidroelétrica genuinamente brasileira. A metodologia apresentada foi capaz de gerar um modelo de previsão de comportamento aderente aos deslocamentos medidos. Dois tipos de gráicos de controle foram testados, onde ambos identiicaram a mudança de comportamento estrutural do bloco.
Palavras-chave:barragens de concreto, modelos de previsão, gráicos de controle, auscultação.
Behavior prediction models and control charts for safety
control of concrete dams
Modelos de previsão de comportamento e gráicos
de controle para veriicação de segurança de barragens
de concreto
R. A. C. LOPES a
E. P. SANTOS b
L. A. C. M. VELOSO c
a Institute of Technology, Civil Engineering College, Universidade Federal do Pará, [email protected], Rua Augusto Corrêa, Belém, Brazil. b Institute of Technology, Computer Engineering College, Universidade Federal do Pará, [email protected], Rua Augusto Corrêa, Belém, Brazil. c Institute of Technology, Civil Engineering College, Universidade Federal do Pará, [email protected], Rua Augusto Corrêa, Belém, Brazil.
Received: 28 Apr 2011 • Accepted: 05 Mar 2012 • Available Online: 26 Jun 2012
Abstract
1. Introduction
For many years, dams have acted as major engineering works to improve various sectors of our society or even introduce factors in a region that make the location more appropriate for people to remain in their places of origin.
Some of the main functions of dams include: lood control in areas near rivers, water storage and irrigation in areas with long periods of drought, containment of tailings from mining companies, recre-ation, and power generation.
Since the beginning of the Industrial Revolution, society has in-creasingly needed energy sources. As a result, the governments of several countries began to invest heavily in building dams, be-cause they can generate large amounts of energy depending on the site where they are installed. Not only has the number of dams increased but their size has also increased, as is the case of the Itaipu concrete dam, built by Brazil in association with Paraguay. The dam is the largest operating hydroelectric facility in terms of annual generating capacity. The construction of this dam con-sumed approximately 28 million tons of concrete [1]. The concrete dam of Itaipu has maximum height of 196 meters from the crest to the foundation, and is 7,919 meters long.
Currently, there is a major concern in conducting a detailed assess -ment of the structural behavior of buildings. This is justiied by the fact that many structures that are built nowadays are much larger than those built in the past, because they have an innovative struc-tural arrangement or are even prone to exceptional actions, such as those structures erected in countries with strong seismicity.
In structural engineering, dams are among the structures that have been monitored for a long time and have a higher number of in-stalled sensors - usually thousands, as is the case of the Tucuruí dam, in northern Brazil, which has about 2,800 sensors [2]. According to the Centro da Memória da Eletricidade no Brasil (Bra -zilian Center forElectric Power History) [3], the study of dam safety began in the United States around the 1950›s with the dam safety program of the Bureau of Reclamation, which established the rec -ommendations on the matter after a review by the National Re -search Council›s Report. Such recommendations include installing ield instruments that enable monitoring the structural behavior of dams and prioritize inspection of dams in high-risk sites.
The irst analyses related to dam engineering focused on the deter-mination of displacements, strains and stresses. With the advent of new sensors, it became possible to determine other structural behaviors, such as: determination of natural frequencies and vibra-tion modes, allowing the comparison of numerical results with the measured data, which also allowed the online evolution of natural frequencies and early detection of structural deterioration and ag-ing processes [4].
Because of the size of large dams, which are among the largest constructions in civil engineering, it became necessary to estab-lish some methods to verify the safety conditions of this type of construction, since collapse of these structures brings about huge social, economic and environmental damages.
According to [5], the safety control of a dam comprises the envi -ronmental safety control, the hydraulic and operating safety con-trol, and structural safety control. The procedures for assessing the safety of a dam along its life are called auscultation.
This paper uses predictive models based on multiple regression
and control charts to predict magnitudes measured by typical instru-ments installed in concrete dams. Prediction models and control charts can be used by auscultation team technicians and engineers to assess structure behavior and to analyze the data measured, since the measured values are susceptible to errors that may occur during data collection or even due to instrument failure.
These new tools add a new parameter to be analyzed in relation to the structural safety control of dams, which in some cases takes into account only the comparison of the instrument-measured data against warning values usually established in the dam design stage. As an object of study, we considered the direct pendulum installed on concrete block TA-2 of the Tucuruí Hydroelectric Power Plant, which is used to measure the displacements of the block crest.
2. Background
Because large dams are constructions that require high economic investments and play a key role in Brazil’s energy plan, it is ex-pected that special care will be in place for the building and main -tenance of such constructions. Brazilian Law No. 12.334 [6], dated 20 September, 2010, establishes the National Dam Safety Policy, the goals of which, according to its article three, are as follows: I - ensure compliance with dam safety standards in order to reduce
the possibility of accidents and the consequences thereof; II - regulate the safety actions to be taken in the planning, design,
construction, irst illing, operation, decommissioning, and fu -ture uses of dams throughout the country;
III - the people in charge of the dams are to promote safety moni -toring and follow-up;
IV - create conditions for extending dam controls by the govern -ment, based on the supervision, guidance and correction of safety actions;
V - collect information that supports governmental management of dams;
VI - establish technical compliance that allows for evaluating the adequacy of those parameters established by the Government; VII - develop a culture of dam safety and risk management. Therefore, auscultation plans are put into practice when the con
-structions begin and are followed up throughout dam’s life. A considerable amount of research has been developed in Brazil and Portugal to develop dam behavior prediction models, espe-cially based on multiple regression models, thus contributing to improving safety control procedures with direct relex on the main-tenance of said structures as well. Amongst such works, one can mention the research carried out at LNEC - the National Labora -tory of Civil Engineering, in Portugal, [7] and [8] as well as several Brazilian contributions, such as those made by [9] and [10]. Based on well-adjusted behavior prediction models, the reading of the instruments should be close to the value estimated; other-wise, it is possible to investigate the cause of this discrepancy and, if necessary, employ timely preventive actions. The auscultation team may also count on the help of control charts, which allow for easy viewing when the dam is undergoing a change in behavior.
3. Auscultation
(2)
Ʃ
f
(
β
0
,
β
1
,…,
β
n
(
= y
i
[
i
-
(
β
0
+
β
1
X
i1
+
β
2
X
i2
+…+
β
n
X
in
) ²
[
where f(β0,β1,…,βn) must be minimized with respect to b0,b1,...,
bn.The least squares estimates of b0,b1,..., bn must satisfy:
(3)
ϑf
β
0
,
β
1
,…,
β
n
ϑ
β
n
= 2
Ʃ
y
i
-
β
0
-
β
1
X
i1
-
β
2
X
i2
-…-
β
n
X
in
(-X
in
) = 0
By rearranging the equations and putting them in matrix notation, one obtains:
(4)
β
?
=(X
TX)
-1X
Ty
Where the i-th line of matrix X is formed by the vector
[1 Xi1Xi2 Xi3… Xin], which corresponds to variables that inlu -ence the response
y
^
i. Vector y corresponds to displacements
to-ward the low direction of block TA-2.
For the estimate of least squares, errors are assumed to be statis-tically independent, and to have zero mean and constant variance. If these conditions are met, the coeficients β^ ^ ^0,β1,β2,…,^βn can be considered unbiased estimators of the regression coeficients. The adjustment of the model to the desired values is measured quanti-tatively by the coeficient of multiple determination, R2. This coeficient
measures the ability of the regression model to explain the variation of
y
^
i. R2 values close or equal to 1 mean that there is good adherencebetween the model and the experimental data, while R2 values close
to zero mean that the model is not suitable for the prediction. The coeficient of multiple determination is obtained as follows:
(5)
R
2= 1 –
SQE
SQT
(6)
Ʃ
SQE=
(
y
i
- y
i
)²
(7)
Ʃ
SQT=
(
y
i
-
y
–
)²
where:
SQE is the quadratic sum of the error; SQT is the total quadratic sum of the deviations; y is the mean of observations.
throughout its phases, but also to verify the assumptions made in the design phase, making the construction works more economi-cal. In the TA-2 block of the Tucuruí Hydroelectric Power Plant, the auscultation instruments installed include the direct pendulum, piezometers and triorthogonal joint gauges.
The readings provided by the instruments can describe dam be-havior quite reliable. The data measured by the instruments may show if the structure is being acted in such a way that its design limits might be exceeded. Consequently, steps can be taken in order to bring the dam back to normal operating condition. According to historical readings, it is possible to notice that some instruments begin to show anomalous readings over time. This of-ten occurs because the instrument has suffered wear and fatigue, i.e., it has exceeded its useful life.
In the case of the HPP Tucuruí, the frequency of readings is set by EEGE (Eletronorte Geotechnical and Structures Management) [2].The frequency of readings varies for each instrument, and can be daily, weekly, biweekly, monthly, bimonthly, quarterly or every six months.
According to [8], in terms of structural behavior, assessment of safety conditions can be conducted by comparing the collected readings to the estimated values based on predictive behavior models. The results estimated by the prediction models can be taken as an indication of the behavior considered normal for the structure in the future.
The parameters set by the statistical models should be reevalu-ated at regular time intervals, as changes in behavior might occur due to changes in the characteristics of the structure or founda-tion. Because of these behavior changes, it becomes dificult to deine normal and abnormal behavior, because according to [12], as quoted in [5], one can always make two types of errors: the irst corresponds to a judgment of a false normality and the second cor-responds to a false judgment of abnormality.
4. Methodology
4.1 Multiple regression
Multiple regression is used to develop an empirical model that as -sociates a dependent variable Y to more than one independent variable. The model equation is as follows:
(1)
^y
i=
β
0+
β
1X
i1+
β
2X
i2+…+
β
nX
in+ ϵ
iwhere:
n is the number of values for the historical series that was analyzed;
y
^i is the dependent variable (i = 1,2, ... n);
Xik are the independent variables (k = 1, ... n);
β0,β1,β2,…,βn are the regression coeficients;
Єi is the random error.
(10.1)
θ=
2πt
365
d, 1
≤ ≤
t
d365
where:
td is the number of days elapsed from the beginning of the year until the date of observation in the same year;
b1, b2, b3, b4 are adjustable parameters.
According to [14], the effect of creep over time can be represented through the elements of a Dirichlet series, which has the form:
(11)
U
F(t)=c
1[1-exp(-10-3t)]+ c
2[1-exp(-10-4t)]
where:
t represents the number of days elapsed from the date of irst ob -servation;
c1 and c2 are adjustable parameters.
Considering that the displacement of the block crest is inluenced by the variables mentioned above, the function used in the predic-tion has the following form:
(12)
E = U
h+ U
T+ U
F+
ε
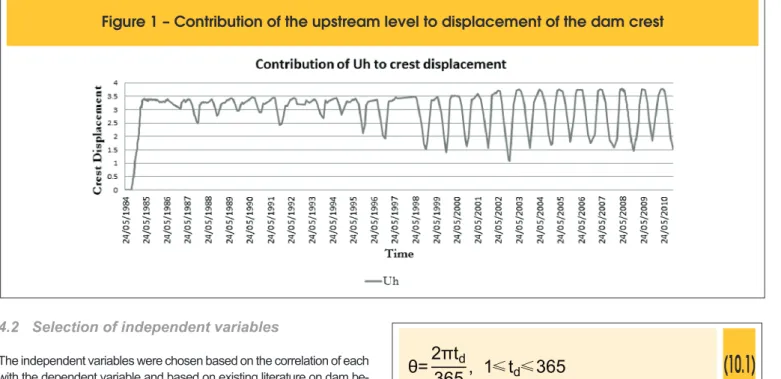
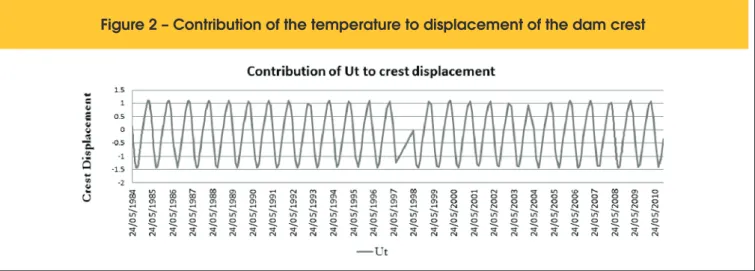
Figures [1], [2] and [3] show the contribution of the upstream level, temperature and concrete creep in overall displacement of the dam crest.
4.3 Control chart
According to [15], the ultimate goal of the statistical process con -trol is the elimination of variability in the process. Although it may
4.2 Selection of independent variables
The independent variables were chosen based on the correlation of each with the dependent variable and based on existing literature on dam be -havior prediction models. The variables selected for the prediction mod-els for displacement of the TA-2 concrete block are described below. According to [5], the estimated effects E depend on two compo-nents, one of an elastic nature Er, formed by the portions related to hydrostatic pressure and temperature, and another of an inelastic nature Et, which represents the effect of creep over time. Thus, E is expressed as follows:
(8)
E= E
r+ E
tAccording to [8], the contribution from the upstream level is often represented by a polynomial function of the form:
(9)
U
h(h)
= a
1h
4+ a
2h
3+ a
3h
2+ a
4h
where:
h is the upstream level in meters; a1, a2,..., a4 are adjustable parameters.
In the operation phase of the dam, the concrete temperature varia-tions depend mainly on environmental temperature variavaria-tions. Ac -cording to [8], the annual inluence of thermal effects on the con-crete block can be represented by the sum of annual harmonic functions. The annual temperature function can be given by:
(10)
U
T(θ)
=b
1cos
(θ)
+b
2sen
(θ)
+b
3sen
2(θ)
+b
4cos
(θ)
sen(
θ
)
not be possible to completely eliminate variability, the control chart helps to reduce it as much as possible.
The control charts very well describe what the statistical process control is all about. They are usually used for online monitoring and they make it possible to ascertain whether recent predictions are under control. When values exceed the limits set in the chart or when the analyzed variable is undergoing a behavior that may be considered nonrandom, it is necessary to detect and eliminate the cause of variability.
When a process involves more than one control variable, it is prefer-able to use control charts for model residuals. The control chart for the regression residuals allows for the analysis of the inluence of more than one control variable on the dependent variable. Normalized re-siduals were used hereby since, according to [16], the standardized residuals are escalated so that their standard deviation is approxi-mately equal to 1. Therefore, the major residuals will be more obvious as from the inspection of residual charts. The standardized residuals were obtained in the Student form, according to equation [13].
(13)
r
i=
y
i- y
^
iσ
^
21 - h
ii
, 0
h
ii1
where s2 is the mean square for the errors, calculated as follows:
(14)
σ
^
2=
SQE
n - p
where:
p is the number of independent variables;
hii is the i-th element of the diagonal of the matrix H and the variance of the adjusted value ^yi.Thus, it can be interpreted as the distance of points Xi in relation to the average of all points of X in the data set.
The matrix H is usually called the hat matrix because it transforms the values observed by the auscultation instruments into a vector of estimated values y^i. The matrix H is calculated as follows:
(15)
H = X(X
TX)
-1X
TThe control limits are selected on the basis of the value of the t
Figure 2 – Contribution of the temperature to displacement of the dam crest
distribution and based on the desired level of signiicance, which in this study was 95% for the +/- 1.96 limit and 99% for the +/- 3 limit. In this paper the control chart for the regression residuals was called Control Type I and is given by:
(16)
LS = + tα/
(2,n-p)
(17)
LC=0
(18)
LI = - t
α
/(2,n-p)
where:
LS is the upper control limit; LC is the central control limit; LI is the lower control limit;
α is the conidence level of the t distribution.
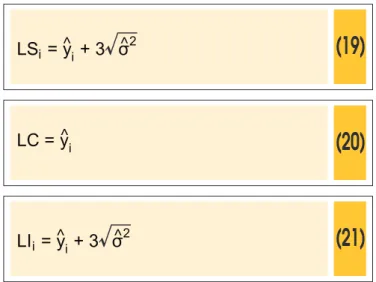
One of the problems with control charts using residuals is that at times it is difficult to interpret them, because they are not always a direct reference to the process. Pedrini [16] proposed the use of a regression control chart that takes into account the direct value of the observations corresponding to the depen-dent variables. In this study, this method was named Control Type II.
As can be seen from equation [19] to [21], the proposed method consists of a slight modiication of the method presented earlier.
(19)
LS
i= y
^
i+ 3
σ
^
2(20)
LC = y
^
i(21)
LIi = y
^
i+ 3
σ
^
2Note that the control limits are not straight lines, as in the method that uses standardized residuals, but curves that will vary accord-ing to the regression model.
4.4 Analysis of input variables
At irst, the block crest displacement time series was observed in order to ind reading trends or errors.
According to [5] several factors may contribute to the source of errors in measurements, such as the type of instrument, the read-ing unit, the readread-ing method, and human intervention introduced by the operator’s method.
To determine which values could affect the analysis, Cook’s dis -tance was used, which measures how much a value can interfere
with the process. Cook’s distance is calculated according to equa-tion [22].
(22)
D
i=
r
i2
h
iip(1-h
ii)
A value of indicates that the i-th point of analysis has some inlu-ence and should be investigated and, if necessary, eliminated from the series. Throughout the analysis, some values exceeded Cook’s distance. After these values were eliminated, an improvement in the coeficient of multiple determination was noticed.
4.5 Analysis of results
Figure [4] shows the displacements measured by the direct pendu-lum, as well as the displacements calculated from the regression model given by equation [23], together with the coeficient of mul -tiple determination. Figures [5] and [6] show the charts for Control Type I and Type II, respectively.
(23)
y^=
–0,24+1,26E(–07)h
4–
1,20sen
(
( (
(
(
2πt 365
)
) )
+
0,12cos
)
)
2πt365
– 0,22sen
2 2πt 365
–
0,33sen
2365πtcos
3652πt–
7,22[1–exp(–10
-3t)]+1490[1–exp(–10
- 5t)]+
13290[1–exp(–10
- 6t)]
In Figure [4], one can see that there is a good adherence between the values read and the estimated values, even when the readings
were taken at longer time intervals. Moreover, during the illing of the reservoir, between 1984 and 1986, and in 2008, when readings were taken at higher frequencies, one inds greater adherence to the regression curve.
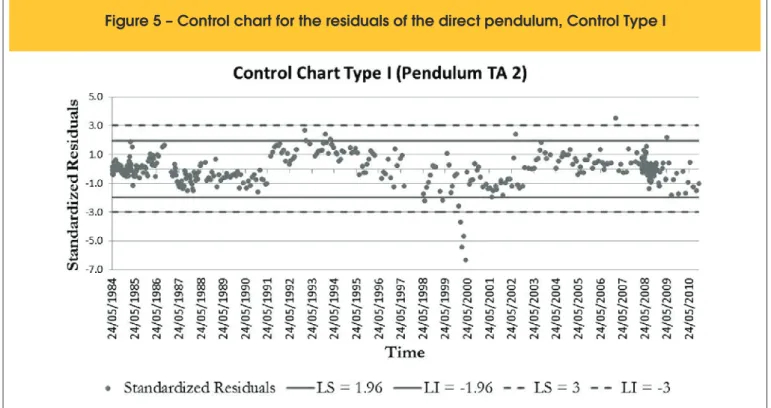
Figure [5] shows that some points exceed the 1.96 and -1.96 limits, especially around May/24/2000. A similar situation was also found in Control Chart Type 2, shown in Figure [6], where the curve of the regression values exceeds the lower limit. As stated earlier, this situation indicates a scenario with two possibilities: measurement error or change in dam behavior.
The construction of the second stage of the Tucuruí dam began in 1998 and was completed in mid-2006 [17]. These brought about several changes, such as demolition of cofferdams, as can be seen in Figure [7]. Certainly, such modiications caused these mo-mentary changes in the behavior of the block under analysis which coincide with the period identiied in both control charts.
5. Conclusion
Readings taken in overly-spaced time intervals results in “jumps” in time series, which reduce the precision of the prediction mod-els. Even though, it was possible to achieve a good adjustment between the predicted and measured values and clearly detecting a process change, i.e., a change in structural behavior. In this re -search, the change in the structural behavior of the block was due to the construction of the second step of the plant, in which coffer dams had to be demolished. Possibly, other process changes such as those brought about by foundation settlement and instrument break-down could also be identiied in this type of analysis. The “jump” problem in the time series could be solved by having an online monitoring system, such as those employing of optical
iber technology. That type of system would have the capability to send an alarm to the technicians whenever the value read by the sensors overshot the limits set in the dam design phase and in the control charts.
The Control Chart Type I, for residual regression, has the advan-tage of more clearly showing the periods in which major differ -ences occur between instrument readings and the predicted val-ues. On the other hand, Control Chart Type II has the advantage
Figure 6 – Control chart for the regression values of the direct pendulum, Control Type II
Figure 7 – Aerial views of the UHE Tucuruí dam. (a) Construction of the second stage, with
cofferdams still present. (b) After completion of the second stage, where
the cofferdams were demolished (SOURCE: www.spcom.eng.br)
of combining information on the dynamics of the process and the statistical control in a single chart.
6. Acknowledgements
The authors would like to thank ELETRONORTE, FINEP and FAPESPA for the inancial supporting this research.
7. References
[01] HAMANN, F P. Engenharia invisivel. Rio de Janeiro, Desiderata, 2008.
[02] ELETRONORTE. Auscultação da barragem de Tucuruí, após 20 anos de operação do reservatório. Relatório Técnico, Eletronorte, 2004.
[03] CENTRO DA MEMÓRIA DA ELETRICIDADE NO BRASIL. ELETRONORTE 25 anos. Rio de Janeiro: Centro da Memória da Eletricidade no Brasil, 1998. [04] Quantiic-Instrumentação Cientiica. Disponível
em:www.quantiic.pt/Quantiic_CS_Odelouca.pdf. Acesso em: 05 de maio de 2011.
[05] PORTELA, E. T. A. Novas metodologias de apoio ao controlo de segurança de barragens de betão: uma abordagem através dos sistema periciais. Tese (doutorado), Lisboa, LNEC, 2001.
[06] LEINº 12.334DE 20 DE SETEMBRO DE 2010.Casa civil, Subcheia para assuntos jurídicos.
[07] OLIVEIRA, S. Modelos de dano na análise do comportamento de barragens de betão: roturas e efeitos do tempo. Exemplos de aplicação. Relatório técnico, Lisboa, LNEC, 2002.
[08] DA MATA, J.T.C. Aplicação de redes neuronais ao controlo de segurança de barragens de betão. Dissertação (mestrado), Lisboa, Universidade técnica de Lisboa, 2007.
[09] GOMES, M. F. et al. Controle do Deslocamento de Blocos de Concreto da UHE Tucuruí por Meio de Modelo Estatístico. , 50º Congresso Brasileiro do Concreto, Salvador, 2008.
[10] LOPES, R. A. C. et al. Emprego de modelo regressivo linear e rede neural artiicial no controle da segurança de barragens de concreto. Revista Sul-Americana de Engenharia Estrutural, Passo Fundo, v.5, p.65-80, 2008.
[11] CRUZ, P. T. 100 barragens brasileiras: casos históricos, materiais de construção, projeto. São Paulo, Oicina de Textos, 1996.
[12] STEMATIU, D., SARGHIUTA, R., BUGNARIU, T., ABDULAMIT, A. Signiicance of Predicted
Displacement Limits in arch dam safety. Barcelona, International symposium on new trends and guidelines on dam safety, 1988.
[13] DEVORE, J. L. Probabilidade e estatística para engenharia e ciências. São Paulo, Thomson, 2006. [14] GUEDES, Q.M., De Faria, E.F. Modelo estatístico de
controle do deslocamento monitorado na barragem casca da UHE Funil. Belém, XXVII Seminário nacional de grandes barragens, 2007.
[15] MONTGOMERY, D. C., Runger, G. C. Estatística Aplicada e Probabilidade para Engenheiros. Rio de Janeiro, LTC, 2003.
[16] PEDRINI, D. C. Proposta para um método de aplicação de gráicos de controle de regressão no monitoramento de processos. Dissertação (mestrado), Porto Alegre, UFRGS, 2009.