ISSN 0104-6632 Printed in Brazil
www.abeq.org.br/bjche
Vol. 32, No. 01, pp. 211 - 223, January - March, 2015 dx.doi.org/10.1590/0104-6632.20150321s00003142
Brazilian Journal
of Chemical
Engineering
DETERMINATION OF THE KINETIC
PARAMETERS OF OXY-FUEL COMBUSTION OF
COAL WITH A HIGH ASH CONTENT
K. G. P. Nunes
*and N. R. Marcílio
¹Laboratory of Waste Treatment, Department of Chemical Engineering, Federal University of Rio Grande do Sul, (UFRGS), R. Eng. Luiz Englert, s/n, Campus Central, CEP: 90040-040, Porto Alegre - RS, Brazil.
*E-mail: [email protected], [email protected]
(Submitted: November 28, 2013 ; Revised: April 8, 2014 ; Accepted: May 29, 2014)
Abstract - The aim of this study was to determine the kinetic parameters of the oxy-fuel combustion of char
from a Brazilian bituminous coal with a high ash content. The char, with a particle diameter of 715 μm, was prepared in a N2 atmosphere at 1173 K. The oxy-fuel combustion assays were performed using a
thermobalance at different temperatures and O2/CO2 gas mixtures of different concentrations. According to
the unreacted core model, the process is determined by chemical reaction at low temperatures, with an activation energy of 56.7 kJ.kmol-1, a reaction order of 0.5 at 973 K and a reaction order of 0.7 overall. The use of the continuous reaction model did not provide a good fit for the experimental data because the consumption of the particles during the reaction was not constant, as predicted by the model. According to the Langmuir-Hinshelwood model, the activation energy for the first step was 37.3 kJ.kmol-1.
Keywords: Char; Oxy-fuel combustion; Thermobalance; Kinetic.
INTRODUCTION
Among the energy sources available worldwide, the most widely used is fossil fuel, especially oil, natural gas and coal, the latter of which represents 28% of the total fossil fuel supply (IEA, 2012). Al-though 80% of Brazil’s domestic energy supply de-rives from combustion and mineral coal is responsi-ble for 5.2% of the fuels used in combustion, the generation of electrical energy in Brazil is essentially hydroelectric (Ben, 2012). The coal is mainly used in thermoelectric plants (85%), the cement industry (6%), the manufacture of cellulose (4%) and chemi-cal industries (5%) (Soares et al., 2008).
The abundance of mineral coal reserves and its geographical distribution, as well as its low cost and stable prices in relation to other fuels, are among the advantages of using this fuel. The greatest disadvan-tage of the use of this source of fossil energy is the
resulting high rate of emission of greenhouse gases. These gases include CO2, which represent 80% of
greenhouse gas emissions (EIA, 2011). Because of great concerns over the levels of CO2 in the
atmos-phere, technologies have been developed for its capture and storage (Bachu et al., 2007, Buhre et al., 2005, Cailly et al., 2005, Middleton et al., 2011, Qanbari et al., 2011, Toftegaard et al., 2010, Stanger and Wall, 2011, Wall et al., 2009).
One of the ways to capture CO2 is oxy-fuel, which
consists of burning a carbon source in an O2 enriched
atmosphere, using CO2 and water as the main
com-bustion gases (Buehre et al., 2005, Irfan et al., 2011, Middleton et al., 2011, Qanbari et al., 2011, Stanger and Wall, 2011, Toftegaard et al., 2010, Wall et al., 2009). Combustion with pure O2 would lead to a
high-temperature flame, therefore CO2 is recirculated
reactions of combustion and gasification; the main reactions are as follows:
S 2 2 g
C O CO
(S) 2 g (g)
C CO 2 CO
In both processes, coal pyrolysis occurs first, which leads to char production. The term ‘pyrolysis’ describes the devolatilisation of carbonaceous mate-rial under a controlled atmosphere and temperature. The volatilised material consists mainly of water vapour, methane and tar, and the solid residue is known as char.
Oxy-fuel combustion differs from air combustion in several aspects, including flame temperature (Khatami et al., 2012a), delay in flame ignition (Khatami et al., 2012b) and the reduction of NOX
and SOX emissions (Kazanc et al., 2011); these
ef-fects can be explained by the different properties of CO2 and N2.
Understanding the behavior of mineral coal in this new combustion environment is important for the adaptation and/or sizing of equipment to yield a clean form of energy production.
Thermogravimetric analysis is widely used as an investigative or comparative tool in the study of ther-mal events such as combustion and coal pyrolysis.
Several studies conducted in the 1980s addressed the kinetics of coal gasification in Brazil (Schmal et al., 1982; José, 1989). For instance, Schmal et al. (1982) studied the kinetics of coal gasification be-tween the temperatures of 1073 K and 1273 K with a high-ash coal from southern Brazil. The authors de-termined that the unreacted core model fit the results up to a temperature of 1123 K and that the continuous reaction model was optimal above this temperature.
Hecht et al. (2011) studied a volatile bituminous coal with a high-ash content under different concen-trations of O2 (12, 24 and 36%) at a temperature of
1724 K and observed that the consumption of char reached an optimum point in an environment of 24% O2, where oxidation and gasification accelerate the
loss of mass of the particles.
Li et al. (2009) pyrolysed a sample of bituminous coal at 1273 K in atmospheres of 100% N2 and
21%N2/79%CO2 using 3 heating rates: 10, 20 and 30
K.min-1. They observed that faster heating of the coal resulted in less time required for pyrolysis, which reduced the loss of mass during devolatilisation and, consequently, increased the proportion of carbona-ceous matter. However, little influence of the heating rate was observed during combustion. For oxy-fuel
combustion, concentrations of 21, 30, 40 and 80% O2 in CO2 were used, and an increase in the
concen-tration of O2 in the gaseous mixture was observed to
reduce the need for high temperatures. The amount of released CO was greater in oxy-fuel combustion, despite the lower levels of SOx and NOx released.
Gil et al. (2011) studied four types of char: a semi-anthracite, a medium- volatile bituminous and two highly volatile bituminous chars, pyrolysed at 1273 K in atmospheres of 100% N2 and 100% CO2.
The authors concluded that a greater loss of mass occurred during devolatilisation under 100% CO2
and that the char produced exhibited a lower reac-tivity because of its more stable structure.
Carotenuto et al. (2011) studied 3 types of coal under oxy-fuel combustion, including a south Bra-zilian coal from Mina do Leão II, which is the same coal used in the present study. The temperatures studied were 1073, 1173 and 1273 K in atmospheres of 21% O2 in CO2 and 21% O2 in N2 (air). The
au-thors reported a greater consumption of O2 under
conditions of oxy-fuel combustion compared to that under conventional combustion. They also observed that an increase in the reaction temperature increased the consumption of O2.
On the basis of the results of the aforementioned research, experimental parameters were established for this work, including the atmosphere used for pyrolysis, the temperature of the oxy-fuel and the concentration of O2 in CO2, to evaluate the kinetic
parameters of oxy-fuel combustion. The motivation for this study was based on the need to obtain a per-manent set of data to understand the conversion of mineral coal char under oxy-fuel combustion condi-tions. Therefore, the present investigation studied the oxy-fuel combustion of char produced in an atmos-phere of N2 from a Brazilian bituminous coal with a
high ash content using a thermobalance. The oxy-fuel combustion reaction was studied with concen-trations of 10 to 30% O2 in CO2 and at temperatures
ranging from 973 to 1273 K.
The experimental parameters used to evaluate the kinetics of the oxy-fuel combustion of a Brazilian sub-bituminous coal were selected for the purpose of gathering useful data for the sizing and modelling of fluidised-bed reactors.
MATERIALS AND METHODS
Sample
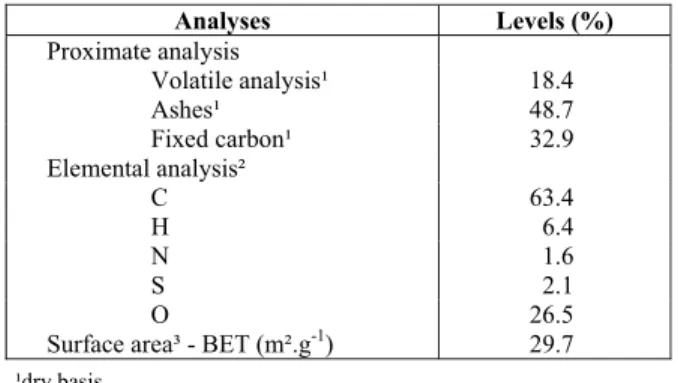
and sieved to yield an average particle diameter of 715 μm was used for the production of char in an atmosphere of N2. The results of the immediate
analysis, elemental analysis and surface-area analysis are shown in Table 1:
Table 1: Composition of the coal and the char
produced.
Analyses Levels (%)
Proximate analysis
Volatile analysis¹ 18.4
Ashes¹ 48.7
Fixed carbon¹ 32.9
Elemental analysis²
C 63.4 H 6.4 N 1.6 S 2.1 O 26.5 Surface area³ - BET (m².g-1) 29.7
¹dry basis ²ash free dry basis
³analysis in the char produced.
Char Preparation
For the production of char, a 0.1 kg sample of coal was placed in a stainless steel reactor (0.14 m high and 0.06 m in diameter), and heated in a muffle furnace, as shown in Figure 1. The unit had an inert gas inlet and an outlet for the gases produced during pyrolysis, as well as a temperature controller and a thermocouple to measure the axial temperature of the reactor. During char production, a N2 atmosphere, a
granulometric range of 590 to 840 μm and a tem-perature of 1173 K were used. The heating rate of the sample was 20 K.min-1 from room temperature to the final temperature. After 100 minutes of heating, the sample mass was observed to remain unchanged because all volatile matter had been eliminated. Be-cause of the heterogeneity of the raw material em-ployed, a residence time in the reactor of 105 minutes was established.
Oxy-Fuel Combustion
The oxy-fuel combustion of char was analysed with the use of a thermobalance (Netzsch 409) under atmospheric pressure. Approximately 30 mg of char was placed in a dish crucible whose base was formed by a platinum screen that allowed the passage of reagent gases through the sample. A thermocouple located below the dish monitored the temperature, which ranged from 973 to 1273 K. The gases used in the experiments were introduced into the thermobal-ance at a rate of 120 mL.min-1, with O2 concentrations
in CO2 varying from 11 to 30%. The conversion X of
char was calculated according to Equation (1):
i
i C
M M
X
M M (1)
where Mi represents the initial mass of the char (mg), M is the instantaneous mass (mg), and Mc is the final mass after oxy-fuel combustion (mg) (Levenspiel, 1976).
1. Thermocouple 2. Alumina tube 3. Refractory lining
4. Ceramic support for the crucible 5. Heating chamber
6. Resistance heating elements (MoSi2)
7. Reactor 8. Inert gas inlet
Kinetic Model
Models for the interpretation of kinetic data from gas-solid reactions are described in the literature. Three such models were used to model the experi-mental results obtained and to determine the kinetic parameters of the oxy-fuel combustion reaction of the studied char:
Unreacted Core Model: the reaction starts at the outside surface and moves towards the centre of the solid, leaving a layer of inert solid, i.e., ashes. This model considers the occurrence of five sequential steps: 1) diffusion of the reagent gas through the stagnant film of gas at the surface of the solid parti-cle; 2) diffusion of he reagent gas through the ash layer; 3) reaction of the gas with the solid on its sur-face; 4) diffusion of the gas product generated by chemical reaction through the ash layer; and 5) diffu-sion of the gas product through the layer of stagnant film of gas around the particle.
Each of the steps is modelled by a mathematical equation based on conversion over time (Barranco et al., 2009, Levenspiel, 1976).
Whenever the diffusion of the reagent gas A through the stagnant film of gas on the surface of a solid particle controls the reaction, the reaction can be modelled by Equation (2), where the expression for τ is shown in Equation (3):
t X
τ (2)
2
3
g O
ρ R
τ
k P (3)
where X is the char conversion, t is the time for the conversion X (s), τ is the time for the full conversion (s), R is the radius of the char particles (m), ρ is the specific mass of the char sample (kg.m-³), PO2 is the partial pressure of oxygen (kPa) and kg is the
coeffi-cient of mass transfer between the fluid and solid (kg.m-2.s-1.kPa-1).
If the ash layer acts as a barrier controlling the process, then the results can be modelled according to Equation (4), where the expression for τ is shown in Equation (5):
2
3
1 3 1 2 1
t
X X
τ (4)
2
2
6
e O
ρ R
τ
P (5)
where X is the char conversion, t is the time for the
conversion X (s), τ is the time for the full conversion (s), R is the radius of the char particles (m), ρ is the specific mass of the char sample (kg.m-3), e is the coefficient of effective diffusivity (m².s-¹) and PO2 is the partial pressure of oxygen (kPa).
If the chemical reaction is the limiting step of the reaction, such a gas-solid surface reaction can be modelled according to Equation (6), where the ex-pression for τ is shown in Equation (7):
1 3
1 (1 )
t
X
τ (6)
2
O
ρ R
τ
k P (7)
where X is the char conversion, t is the time for the con-version X (s), τ is the time for the full conversion(s), R is the radius of the char particles (m), ρ is the specific mass of the char sample (kg.m-3), k is the superficial first-order reaction rate constant (kg.m-2.s-1.kPa-1) and PO2 is the partial pressure of oxygen (kPa).
Continuous Reaction Model: the reaction occurs simultaneously across the entire particle as the re-agent gas is consumed. This model was developed for cases where the diffusion of the reagent gas is much faster than the chemical reaction involved. Equation (8) represents this model:
ln 1
X kt (8)
where X is the char conversion, t is the time for the conversion X (s) and k is the first-order reaction rate constant (s-1).
Langmuir-Hinshelwood Model: this model es-tablishes a formula for the rate of heterogeneous chemical reaction that combines the behaviors of the steps of adsorption, desorption and chemical reac-tion. The reaction occurs via two elementary steps, (9) and (10):
1
2
k
C O C O (9)
2k
C O CO (10)
2 21 2
1 2
O A
O
k k P r
k P k (11)
where (-rA) is the rate of reaction, k1 (kmol.m
-².s-¹) and k2 (kmol.kPa.m-².s-¹) represent the specific rates
of reactions (9) and (10), respectively, and PO2 repre-sents the partial pressure of oxygen (kPa).
Notably, in the Langmuir-Hinshelwood model, the parallel reaction step in the gaseous phase of oxidation of CO (Equation (12)) is not considered.
2 2
1 2
CO O CO (12)
RESULTS AND DISCUSSION
Effect of Temperature
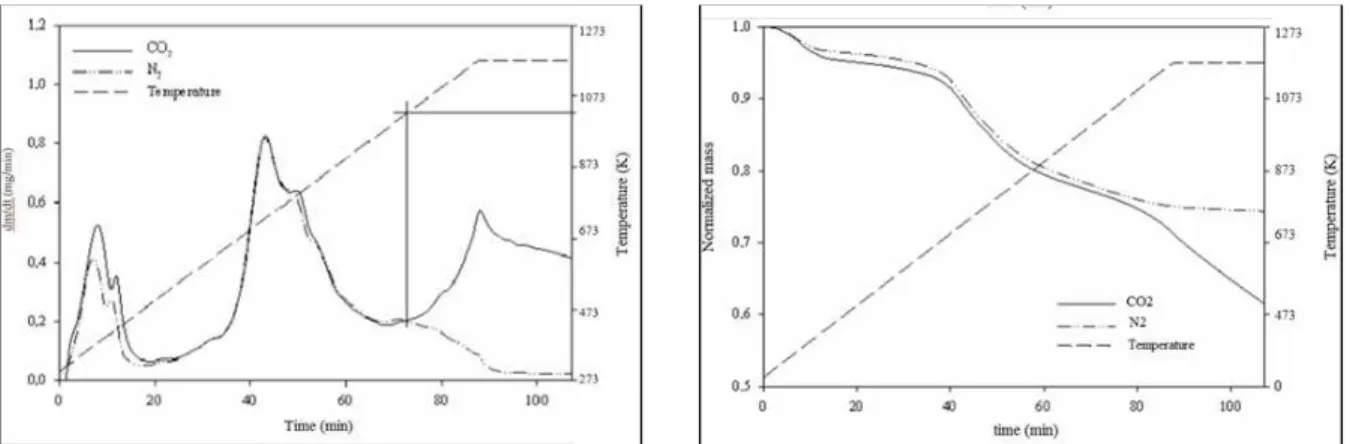
To evaluate the effect of temperature on the reac-tion rate of the oxy-fuel combusreac-tion of char, the temperatures 973 K, 1073 K, 1173 K and 1273 K were used, and the other variables were fixed. We selected these temperatures on the basis of prelimi-nary results obtained in the thermogravimetric tests
shown in Figure 2, which were conducted at Bran-denburg University of Technology in Cottbus – Germany using a sample of coal from Mina do Leão II in the granulometric range 0.125 – 0.500 mm (Carotenuto et al., 2012).
As shown in Figure 2, the loss of normalized car-bon demonstrates consistent behavior up to 1073 K, under both N2 and CO2 atmospheres. Above this
temperature, the Boudouard reaction occurs, and the carbon is consequently consumed.
Figure 3 shows the curves of char conversion as a function of time for the temperatures 973 K, 1073 K, 1173 K and 1273 K with a mixture of 20%O2/80%CO2 as the reagent gas.
As evident in Figure 3, an increase in the tem-perature increases the rate of consumption of char, i.e., it increases the reaction rate. At temperatures of 973 K and 1073 K, the behavior of char conversion as a function of time is very similar; however, at temperatures of 1173 K and 1273 K, the reaction rate dramatically increases in relation to temperature. Most likely, the increase in temperature causes an increase in the surface area of the char, thereby fa-cilitating the access of reagent gases to the sample surface. This behavior indicates that the kinetic re-gime controls the process.
Figure 2: Normalised mass loss and curve of the reaction rate of coal from Mina do Leão II as function of time (granulometry between 0.125 and 0.500 mm). From: Carotenuto et al., 2012.
Influence of O2 Concentration in the Gas Mixture
Because of differences in the physicochemical properties of N2 and CO2, the ignition of coal is
known to be delayed in an oxy-fuel combustion at-mosphere when a given concentration of O2 is added
to either N2 or CO2. To obtain the same temperature
profile as that in atmospheric air, which normally contains 21% O2 in N2,a reagent mixture must
con-tain 30% O2 in CO2 (Khatami et al., 2012).
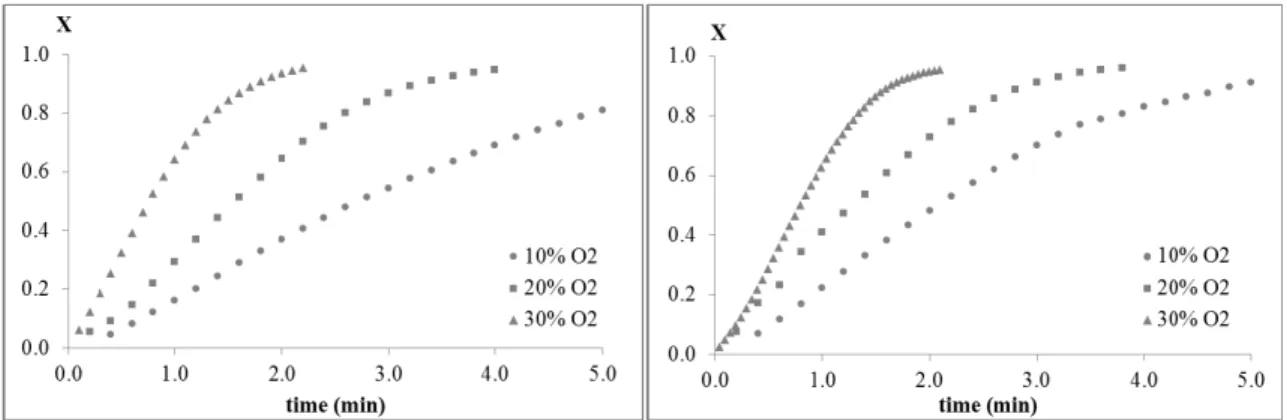
Therefore, on the basis of this information, we analysed O2/CO2 gas mixtures in the proportions
10% O2/90% CO2, 20% O2/80% CO2 and 30% O2/
70% CO2 at temperatures of 973 K, 1073 K, 1173 K
and 1273 K, shown in Figures 4 and 5.
At all four temperatures, an increase in the O2
centration in the gas mixture increased the rate of con-version of char. This phenomenon indicates that the process is determined by chemical reaction, although
the overlap of the curves associated with 20% and 30% O2 in the mixture at a temperature of 1273 K
sug-gest a change in the determining reaction mechanism.
Kinetic Models
Unreacted Core Model
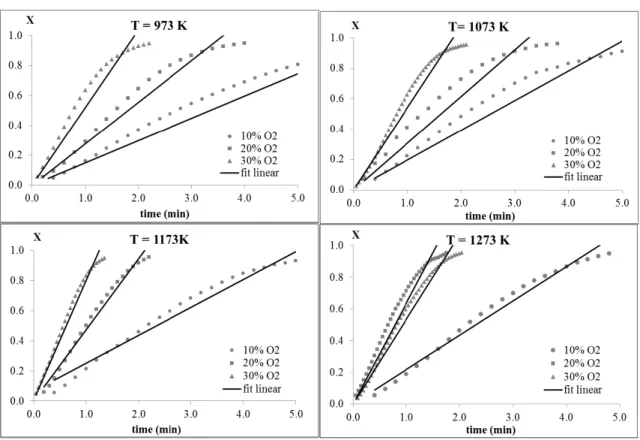
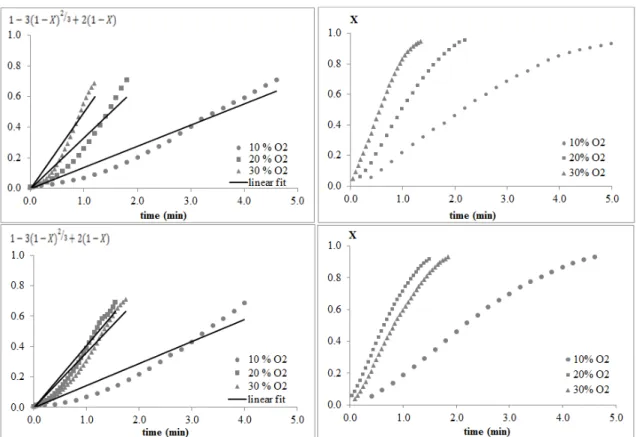
Figures 6 and 7 present the curve fit of the ex-pression for the unreacted core model to the experi-mental data obtained at 973 K, 1073 K, 1173 K and 1273 K for the model in which the diffusion in the gas layer outside the particle controls the reaction and the diffusion of the reagent gas in the layer of ash, respectively.
As evident in Figures 6 and 7, the models do not adequately reproduce the measurements because a continuous change occurs in the slope of the straight lines, indicating a change of reaction control.
Figure 4: Conversion of char vs. time for different concentrations of the O2/CO2mixture at 973 K and
1073 K.
Figure 5: Conversion of char vs. time for different concentrations of the O2/CO2 mixture at 1173 K
Figure 7: Curve-fit of the expression for the unreacted core model when diffusion of reagent gas in the ash layer controls the process and the curves of char conversion as a function of time for the temperatures 973 K, 1073 K, 1173 K and 1273 K.
In Figure 8, the fit of the experimental data col-lected at 973 K, 1073 K, 1173 K and 1273 K to the unreacted core model was calculated, considering step 3 of the reaction process to be the controlling step. In this case, a good fit of the experimental data to the model was achieved, indicating that the chemi-cal reaction is indeed the controlling step of the reaction process.
At low concentrations of oxygen in the gaseous mixture, the reaction is slower and the determining character of the chemical kinetics becomes more evident.
When the chemical reaction controls the reaction process, the time τ for the full conversion of the par-ticle is given by Equation (13):
2
O
ρ R
τ
k P (13)
where τis the time for the full conversion (s), R is the radius of the char particles (m), ρ is the specific mass of the char sample (kg.m-³), k is the superficial first-order reaction rate constant (kg.m-2.s-1.kPa-1) and PO2 is the partial pressure of oxygen (kPa).
If the rate of reaction (-rA) is assumed to obey
Equation (14),
2n
A O
r k P (14)
where n is the order of the reaction and k is the superfi-cial first-order reaction rate constant (kg.m-2.s-1.kPa-n), then the rate of reaction (-rA) can be calculated using Equation (15):
.ρA
R r
τ (15)
where (-rA) is the rate of reaction (kg.m-2.s-1), R is the radius of the char particles (= 3.63x10⁻⁴ m), ρ is the specific mass of the char sample (1960 kg.m-³) and τ is the experimental value obtained from Figure 4 or 5. By linearising Equation (14), the values of k and n can be determined. The pre-exponential factor, A (kmol.s-1.m-2), and the activation energy of the reaction, Ea (kJ.kmol-1), can also be calculated via
the Arrhenius equation. The Arrhenius equation is represented in Equation (16):
a
E
k A exp
Figure 9 presents a graph of the linearised Arrhenius equation. Analysis of the behaviour of the results revels that a change occurs in the dominant reaction mechanism from chemically-controlled at low temperatures to diffusion-controlled at high temperatures.
Thus, for the unreacted core model, values of 56.7 kJ.kmol-¹ for the energy of activation and 0.78 kmol.s-1.m-2 for the pre-exponential factor were ob-tained for temperatures between 973 K and 1073 K. For temperatures between 1073 K and 1273 K, the activation energy was 23.4 kJ.kmol-¹ and the pre-exponential factor was 0.56 kmol·s-1·m-2.
The order of reaction was 0.5 for 973 K and 0.7 for the other temperatures.
For the calculation of the kinetic parameters, the partial concentration of O2 was considered as being
proportional to the concentration of the reagent gas, a situation that occurs only at temperatures lower than 1073 K. For temperatures greater than 1073 K, it is also necessary to consider Boudouard’s reaction because, in this case, reactions (17) and (18) occur simultaneously:
2 2
C O CO (17)
2 2
C CO CO (18)
Figure 10 shows a sample of 30 mg of char on the platinum screen before being added to the ther-mobalance and the char obtained after oxy-fuel combustion. Because of the high ash content of the samples, the particles did not suffer size reduction after the oxy-fuel combustion process, which sup-ports the hypothesis of the unreacted core model.
Continuous Reaction Model
The experimental data were not fit to the continu-ous reaction model.
The char particles used contained 59.7% ash scattered throughout their volume, making the con-sumption of carbon heterogeneous as the reaction proceeded to the interior of the particles. Therefore, the assumptions of the continuous reaction model were not satisfied in this case.
Figure 9: Effect of temperature on the reaction 2C + O2→ 2CO.
Langmuir-Hinshelwood Model
Considering that the rate of reaction (-rA) can be expressed as the inverse of Equation (11), according to Equation (19), the specific rates k1 and k2 of reac-tions (9) and (10) can be evaluated through the de-termination of the angular and linear coefficients of the referred line:
2 2 11 1 1 1
.
A O
r k P k (19)
Figure 11 shows the lines obtained at tempera-tures of 973 K, 1073 K, 1173 K and 1273 K using the Langmuir-Hinshelwood model to fit the experi-mental data of the oxy-fuel combustion of char.
Figure 11: Graph obtained from the linearisation of Equation (17) for determination of the specific rates of reaction of each elementary step.
On the basis of the equations of the lines shown in Figure 10, the specific rates for each step of the elementary reactions (9) and (10) can be determined according to Equation (20) and (21):
11 1
a
E
k A exp
T
R (20)
22 2
a
E
k A exp
T
R (21)
Table 2 shows the results obtained for k1 and k2 for the temperatures 973 K, 1073 K, 1173 K and 1273 K.
As is evident from the results in Table 2, an in-crease in temperature causes the values of k2 to in-crease more significantly than the values of k1. This phenomenon indicates that increased temperature
favours oxygen adsorption onto the active sites of the carbon over desorption of carbon monoxide from active sites; consequently, the reaction is zeroth-or-der (Hurt and Calo, 2001).
Table 2: Values of the rate constants for each elementary step of the equation.
Temperature (K)
k1 (kmol.m-².s-¹).10+2
k2
(kmol.kPa.m-².s-¹).10+3
973 1.468 3.017
1073 1.657 6.045
1173 2.401 6.532
1273 2.458 9.726
To determine the frequency and activation energy for each elementary step of the reaction, the Arrhenius Equation (20) and (21) were used in linearised form, as shown in Figure 12.
Figure 12: Chart for determining the activation energy and the frequency factor of the reactions (20) and (21).
The activation energy observed for step 1 of the reaction process was 19.8 kJ.kmol-1 (reaction 9), and that for step 2 was 37.3 kJ.kmol-1 (reaction 10). The pre-exponential factors for steps 1 and 2 of the reac-tion were 0.995 kmol.m-2.s-1 and 2 kmol.kPa.m-2.s-1 respectively.
CONCLUSIONS
A high-ash mineral coal from Mina do Leão II, southern Brazil, previously pyrolysed with N2 at
1173 K, was used to study oxy-fuel kinetics (using mixtures of O2/CO2 in concentrations of 10, 20 and
30% O2 in CO2) at temperatures of 973, 1073, 1173
and 1273 K. The main conclusions of this study are as follows:
control predominates in the reactions, with an acti-vation energy of 23.4 kJ.kmol-¹ and a pre-exponential factor of 0.093 kmol.s-1.m-2. Above this temperature, the control mechanism shifts and diffusion predomi-nates, with an activation energy of 56.7 kJ.kmol-¹ and a pre-exponential factor of 3.91 kmol.s-1.m-2. For the calculation of kinetic parameters, only the partial con-centration of O2 was considered as being proportional
to the concentration of the reagent gas, a situation that occurs only at temperatures lower than 1073 K. For temperatures above 1073 K, the Boudouard reaction occurs simultaneously, which explains why the order of the reaction is 0.5 at 973 K and 0.7 at the other investigated temperatures.
Using the continuous reaction model did not yield a good fit to the experimental data because the model assumes a uniform consumption of carbon during the reaction, which does not occur experimentally be-cause of the large amount of ash distributed through-out the char particles.
The activation energy determined for the C-O2
reaction using the Langmuir-Hinshelwood model was 19.8 kJ.kmol-1 for the adsorption of oxygen at-oms onto the active sites of the carbon and 37.3 kJ.kmol-1 for the desorption of carbon monoxide from the active sites. The reaction and desorption steps of the Langmuir-Hinshelwood model did not provide an exact value for the order of the reaction.
On the basis of the experimental results obtained in this study, we recommend that the unreacted core model be used to interpret data in the kinetic regime for the scaling and modelling of fluidised-bed oxy-fuel reactors using mineral coal with a high ash content.
NOMENCLATURE
A pre-exponential factor kmol.s-1.m-2
e
coefficient of effective
diffusivity
m².s-¹
Ea activation energy kJ.kmol-¹
k superficial first-order reaction rate constant
kg.m-2.s-1.kPa-1 kg coefficient of mass transfer
between the fluid and solid
kg.m-2.s-1.kPa-1
k1 specific rate kmol.m-2.s-1
k2 specific rate kmol.kPa.m-2.s-1
Mi initial mass of the char mg
M instantaneous mass mg
Mc final mass after oxy-fuel
combustion
mg
n order of the reaction
PO2 partial pressure of oxygen kPa
R radius of the char particles
m
R gas constant 8.314
kPa.m3.kmol-1.K-1
(-rA) rate of reaction kg.m-2.s-1
T temperature K
t time s
Greek Symbols
τ time to complete the reaction,
s
ρ specific mass of the char sample,
kg.m-³
REFERENCES
BEM, Balanço Energético Nacional 2012, Ano Base 2011, Rio de Janeiro (2012). (In Portuguese). Bachu, S., Bonijoly, D., Bradshaw, J., Burruss, R.,
Holloway, S., Christensen, N. P., Mathiassen, O. M., CO2 storage capacity estimation: Methodology
and gaps. International Journal of Greenhouse Control, 1, p. 430-443 (2007).
Barranco, R., Rojas, A., Barraza, J., Lester, E., A new char combustion kinetic model 1. Formula-tion. Fuel, 88, p. 2335-2339 (2009).
Buhre, B. J. P., Elliott, L. K., Sheng, C. D., Gupta, R. P., Wall, T. F., Oxy-fuel combustion technology for coal-fired power generation. Program in En-ergy and Combustion Science, 31, p. 283-307 (2005).
Cailly, B., Thiez, P., Egermann, P., Audibert, A., Vidal-Gilbert, S., Longaygue, X., Geological Storage of CO2: A state-of-the-art of injection
process and technologies. Oil & Gas Science and Technology, 60, p. 517-525 (2005).
Carotenuto, A., Silva, R. C., Rech, R. L., Marcílio, N. R., Schneider, P. S., Krautz, H. J., Preliminary investigation of the global kinetic parameters of low-rank coals under oxy-fuel conditions. 3th Brazilian Congress of Coal, Gramado (2011). Carotenuto, A., Silva, R. C., Rech, R. L., Schneider,
P. S., Marcilio, N. R., Krautz, H. J., Experimental analysis of low-rank coal combustion under air and oxy-fuel conditions. In: ENCIT 2012 14th Brazilian Congress of Thermal Sciences and Engineering, 2012, Rio de Janeiro, ENCIT, Rio de Janeiro: ABCM (2012).
Washington (2011).
EIA, Energy Information Administration – Interna-tional Energy Outlook (2012).
Gil, M. V., Riaza, J., Álvarez, L., Pevida, C., Pis, J. J., Rubiera, F., Oxy-fuel combustion kinetics and morphology of coal chars obtained in N2 and CO2
atmospheres in an entrained flow reactor. Applied Energy, 91, p. 67-74 (2011).
Hecht, E. S., Shaddix, C. R., Molina, A., Haynes, B. S., Effect of CO2 gasification reaction on
oxy-combustion of pulverized coal char. Proceeding of the Combustion Institute, 33, p. 1699-1706 (2011).
Hurt, R. H., Calo, J. M., Semi-global intrinsec ki-netic for char combustion modeling. Combustion and Flame, 125, p. 1138-1149 (2001).
Irfan, M. F., Usman, M. R., Kusakabe, K., Coal gasi-fication in CO2 atmosphere and its kinetics since
1948: A brief review. Energy, 36, p. 12-40 (2011). José, H. J., Zur Reaktivität von Koksen aus Santa
Catarina-Steinkohle, Brasilien, bei der Vergasung mit Wasserdampf und Kohlendioxid. Thesis, RWTH Aachen, Germany (1989). (In German). Khatami, R., Stivers, C., Joshi, K., Levendis, Y. A.
and Sarofim, F. A., Combustion behavior of sin-gle particles from three different coal ranks and from suger cane bagasse in O2/N2 and O2/CO2
atmospheres. Combustion and Flame, 159, 1253-1271 (2012a).
Khatami, R., Stivers, C. and Levendis, Y. A., Igni-tion characteristics of single coal particles from three different ranks in O2/N2 and O2/CO2
atmos-pheres. Combustion and Flame, 159, p. 3554-3568 (2012b).
Kazanc, F., Khatami, R., Manoel-Crnkovic, P., Levendis, Y. A., Emissions of NOx and SO2 from
coals of various ranks, bagasse and coal-bagasse blends burning in O2/N2 and O2/CO2
Environ-ments. Energy and Fuels, 25(7), 2850-2861 (2011).
Levenspiel, O., Chemical Reaction Engineering. 3th Ed., New York, John Wiley & Sons (1976).
Li, Q., Zhao, C., Chen, X., Wu, W., Li, Y., Compari-son of pulverized coal combustion in air and in O2/CO2 mixtures by thermo-gravimetric analysis.
Journal of Analytical and Applied Pyrolysis, 85, p. 521-528 (2009).
Liu, H., Zailani, R., Gibbs, B. M., Comparisons of pulverized coal combustion in air and in mixtures of O2/CO2. Fuel, 84, p. 833-840 (2005).
Middleton, D., Mcculloch, M., Miller, P., Normand, E., Cassels, G., Bullock, A., Jacobina, E., Trial CO2 measurement and capture system
incorpo-rating hybrid inorganic membranes for flue gas cleaning. Journal of Membrane Technology, 2011, p. 7 -10 (2011).
Qanbari, F., Pooladi-Darvish, M., Tabatabaie, S. H., Gerami, S., Storage of CO2 as hydrate beneath the
ocean floor. Energy Procedia, 4, p. 3997-4004 (2011).
Schmal, M., Monteiro, J. L. F., Castellan, J. L., Ki-netics of coal gasification. Ind. Eng. Chem. Pro-cess Des. Dev., 21, p 256-266 (1982).
Soares, P. S. M., Santos, M. D. C., Possa, M. V., Carvão brasileiro: Tecnologia e meio ambiente. Sci. and Technol., (2008). (In Portuguese). Stanger, R., Wall. T., Sulphur impacts during
pul-verized coal combustion in oxy-fuel technology for carbon capture and storage. Progress in Energy and Combustion Science, 37, p. 69-88 (2011). Toftegaard, M. B., Brix, J., Jensen, P. A., Glarborg,
P., Jensen, A. D., Oxy-fuel combustion of solid fuel. Progress in Energy and Combustion Sci-ence, 36, p. 581-625 (2010).
Wall, T., Liu, Y., Spero, C., Elliot, L., Khare, S., Rathnam, R., Zeenathal, F., Moghtaderi, B., Buhre, B., Sheng, C., Gupta, R., Yamada, T., Makino, K., Yu, J., An overview on oxy-fuel coal combustion – State of the art research and technology devel-opment. Chemical Engineering Research and De-sign, 87, p. 1003-1016 (2009).