*e-mail: [email protected]
Article presented at the XV CBECIMAT, Natal - RN, November/2002
Measurement of Oxygen Atom Diffusion in Nb and Ta by Anelastic Spectroscopy
Luciano Henrique de Almeidaa,b, Kelly Cristina Cezaretto Piresb,
Carlos Roberto Grandinib*, Odila Florêncioc
a
Instituto de Física de São Carlos, USP, 13560-970 São Carlos - SP, Brazil
USP, 13560-970 São Carlos - SP, Brazil
13560-970 São Carlos - SP, Brazil
bLaboratório de Relaxações Anelásticas, UNESP, 17033-360 Bauru - SP, Brazil
UNESP, 17033-360 Bauru - SP, Brazil
17033-360 Bauru - SP, Brazil
c
Departamento de Física, UFSCar, 13565-905 São Carlos - SP, Brazil
UFSCar, 13565-905 São Carlos - SP, Brazil
13565-905 São Carlos - SP, Brazil
Received: April 21, 2003; Revised: April 7, 2005
Impurity interstitial atoms present in metals with BCC structure can diffuse in the metallic matrix by jumps to energetically equivalent crystallographic sites. Anelastic spectroscopy (internal friction) is based on the measurement of mechanical loss or internal friction as a function of temperature. Due to its selective and non-destructive nature, anelastic spectroscopy is well suited for the study of diffusion of interstitial elements in metals. Internal friction measurements were made using the torsion pendulum technique with oscillation frequency of a few Hz, temperature interval from 300 to 700 K, heating rate of about 1 K/min, and vacuum better than 10-5 mbar. The polycrystalline Nb and Ta samples used were supplied by Aldrich Inc. The results obtained showed thermally activated relaxation structures due to stress-induced ordering of oxygen atoms around the Nb (or Ta) atoms of the metallic matrix. The results were interpreted by three methods and led to activation enthalpy values for the diffusion of oxygen in Nb and Ta of 1.15 eV and 1.10 eV, respectively.
Keywords:oxygen diffusion, internal friction, interstitials, Nb, Ta
1. Introduction
The study of the behavior of group-V metals with interstitials impurities such as O, N, C, H in solid solution has raised many researchers’ interest, because these impurities can modify the me-chanical properties of these metals1-3, for example, causing either their softening4 or hardening5.
The interactions of these interstitial elements with group-V metals have been largely studied by anelastic spectroscopy measurements (internal friction). The interest in studying bcc metals began with Snoek’s early paper6, in which he postulated a stress-induced ordering of interstitials. Atom reorientation gives rise to pronounced internal friction peaks called Snoek peaks. Such impurity reordering under the action of an applied external force and the interaction with the metal-lic matrix through a relaxation process is known as stress-induced ordering7. The application of this property to diffusion studies is based on the fact that a heavy interstitial atomic element such as oxygen present in a bcc lattice constitutes an elastic dipole with tetragonal symmetry and can produce anelastic relaxation.
Normally, the diffusion coeficient is measured by mass low technique8, but in the last thirty years, internal friction measurement has been widely recognized as a very useful technique to study diffusion phenomena in metals and alloys9. The discussion of diffu-sion phenomena in metals and alloys is centered on the fact that an interstitial atom jumps into energetically equivalent sites as a result of the application of external mechanical stress. These jumps give origin to peaks in the internal friction spectra. In general, relaxation peaks in bcc metals appear due to the presence of interstitial solute atoms and are observed as Snoek-type peaks7. The relaxation strength and the activation energy of the peaks give some information on the properties of interstitials atoms in bcc metals.
In the last twenty years, the amount of information on relaxation peaks due interstitial oxygen and nitrogen in Nb and Ta has increased sharply10-14. The positions of these peaks with respect to temperature
are relatively well known, as are the activations energies and the pre-exponential factors11. Consequently, peak identiication does not present a particular problem. In contrast, some arguments as to whether “clustering” and “anticlustering” occurs with increasing oxygen content13-19 have been raised. The clustering model proposes the formation of oxygen pairs and other oxygen clusters13, while the anticlustering model proposes a long-range repulsive interaction between oxygen interstitials and the possibility of some interaction between different types of heavy interstitials, such as oxygen and nitrogen14.
The purpose of this paper was to study the diffusion of oxygen atoms in Nb and Ta through anelastic spectroscopy measurements as a function of temperature using the torsion pendulum technique. The present investigation determined the activation parameters and the shape of Snoek peaks in Nb and Ta in the presence of oxygen and nitrogen using three methods of data analysis.
2. Experimental Part
Samples of Nb and Ta polycrystals containing oxygen and nitrogen in solid solution were investigated. The samples supplied by Aldrich Inc. had cylindrical form and 60 mm in length by 1 mm diameter, and purity of 99.8% (niobium) and 99.9% (tantalum). The chemical composition of the samples is listed in Table 1.
Data relative to the pendulum free oscillation damping are col-lected automatically using a laser beam recol-lected by a mirror placed on the pendulum that strikes two phototransistors connected to a microcomputer by a dedicated interface20.
3. Results and Discussion
Typical anelastic spectra for Nb and Ta samples are presented in Figures 1 and 2. The peaks observed in the anelastic spectrum can be associated with the interaction of oxygen atoms (main peak) and ni-trogen atoms (secondary peak) with the metallic matrix, Nb(or Ta)-O and Nb(or Ta)-N, respectively. These peaks are very well known and
are attributed to the stress-induced ordering of oxygen and nitrogen atoms around Nb (or Ta) atoms in the lattice10-15. Figures 1 and 2 also show the behavior of frequency (related with the shear modulus) with temperature. The step in the peak region in the frequency curves shows that they are Snoek type. In this work, analysis will be restricted to the Nb-O relaxation process.
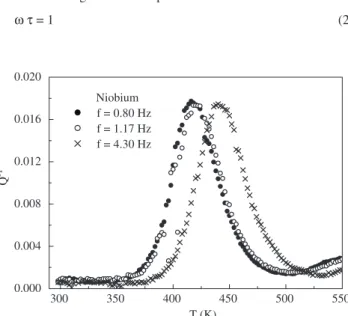
Figures 3 and 4 show the inluence of the oscillation frequency on the internal friction spectra for the relaxation process due to stress-induced ordering of the oxygen atoms around Nb (or Ta) lattice atoms. In these igures, it can observed that the relaxation structure (peak) moves to the high temperature zone with the increase in the pendulum oscillation frequency. This effect shows that the relaxation process is thermally activated.
If a single relaxation process governs the relaxation process represented by the peak in the internal friction spectrum, the basic internal friction equation is given by7:
( )
( )
Q
1 1
2
~x
~x ~x
= +
D
-(1)
where: ∆ is the relaxation strength, τ is the relaxation time, and ω = 2πf, f is the pendulum oscillation frequency.
The basic condition for the occurrence of relaxation peaks as-sociated to a single relaxation process is:
ωτ = 1 (2)
Table 1. Chemical composition of Nb and Ta samples.
Ta Nb
Impurity Quantity (ppm) Impurity Quantity (ppm)
Cu 100 Ta 930
Ni 55 Ti 640
V 15 Na 6
Cr 13 Ni 4
Mg 7 Mg 3
O 35 O 50
N 25 N 30
H 12 H 10
300 400 500 600 700
0.000 0.005 0.010 0.015 0.020
0.65 0.70 0.75 0.80
T (K)
Q
-1
background
Nb-N Nb-O
Niobium f = 0.8 Hz
f (Hz)
0.92 0.96 1.00 1.04
300 400 500 600 700 800
0.000 0.004 0.008 0.012 0.016
background
f (Hz)
Tantalum f = 1.06 Hz
Ta-N Ta-O
Q
-1
T (K)
Figure 1. Anelastic relaxation spectrum of Nb measured with frequency of 0.8 Hz.
Figure 2. Anelastic relaxation spectrum of Ta measured with frequency of 1.06 Hz.
300 350 400 450 500 550
0.000 0.004 0.008 0.012 0.016 0.020
Niobium f = 0.80 Hz f = 1.17 Hz f = 4.30 Hz
Q
-1
T (K)
300 350 400 450 500 550
0.000 0.002 0.004 0.006 0.008 0.010 0.012
Q
-1
T (K) Tantalum
f = 1.06 Hz f = 1.71 Hz f = 4.66 Hz
Figure 3. Frequency inluence on internal friction for Nb-O relaxation process.
Thus, the internal friction and the frequency as a function of the temperature measured in the proximity of Snoek’s peak can be used to obtain information on diffusion characteristics of point defects, their thermal activation, the formation of different point defect and their redistribution under the effect of external stress. A point defect produces local distortions in the crystal, and an elastic dipole, a second order tensor, is formed7.
For a material with bcc structure, the migration of interstitial atoms is given by jumps to energetically equivalent octahedral or tetrahedral sites. The diffusion of these atoms is governed by the following expression7:
D a 36 0 2
x
= (3)
where: D is the diffusion coeficient, a0 is the lattice parameter, and
τ is the relaxation time.
If the relaxation process is thermally activated, as is the case, the relaxation time can be written using Arrhenius’ law7:
τ = τ0 exp (H / kT) (4)
where: τo is the pre-exponential factor (fundamental relaxation time of the process), H is the activation enthalpy, and k is the Boltzmann constant.
Thus, substituting Equation 4 into Equation 3, we obtain:
exp D D
kT H
0
= b- l (5)
with:
D a
36 0
0 0
2
x
= (6)
where: Do is the pre-exponential factor.
Applying logarithm to Equation 5, we obtain:
( ) ( )
ln D ln D
kTH
0
= - (7)
Equation 7 shows that the logarithm of the diffusion coeficient is related with the inverse of temperature. Thus, the logarithmic graph of the diffusion coeficient as a function of the inverse of the temperature gives the activation enthalpy, H, and the pre-exponential factor, Do.
Substituting Arrhenius’ law (Equation 4) in the condition of oc-currence of relaxation peak (Equation 2) and applying the logarithm, it is obtained:
ln f = – ln 2πτ0 – H / k Tp (8) where: Tp is the relaxation peak temperature.
Thus, the logarithmic graph of the oscillation frequency as a func-tion of the inverse of the temperature gives the activafunc-tion enthalpy and the fundamental relaxation time of the process. Figure 5 shows the relaxation process graphs for Nb-O and Ta-O. Using linear regression, it can be obtained the relaxation parameters above for the relaxation processes in question. These parameters are presented in Table 2.
Another methodology used to obtain the relaxation parameters of the relaxation processes above was proposed by Weller et al.11. It consists in the resolution of Equation 1 for τ, that is:
Q Q
1
2 1 2 1 1
2 !
x=~ D D
-- d - n
> H (9)
According with Weller et al.11, ∆ can be written as: Q
2 T
T
p p
1
D=
-(10)
where: Q-1p is the maximum internal friction, i.e., the internal friction for Tp.
Thus:
Q T Q
Q T Q T
1 p Tp p p 1
1 1
1
1 2
!
x=~
-f p
R
T S SS
V
X W
WW (11)
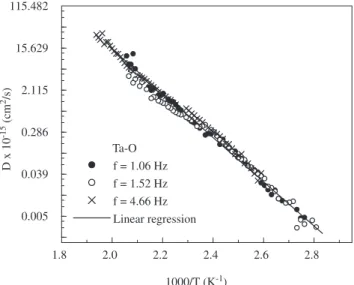
Figures 6 and 7 show the diffusion coeficient as a function of the inverse of the temperature for Nb and Ta samples. The pre-ex-ponential diffusion factor of oxygen in Nb and Ta can be obtained using linear regression:
Do (Nb) = (3.17 ± 0.02) x 10-4 cm2/s
Do (Ta) = (2.03 ± 0.01) x 10-5 cm2/s
The activation enthalpy for these relaxation processes obtained by this methodology is presented in Table 2.
Table 2. Relaxation parameters for oxygen diffusion in Nb and Ta.
Process f (Hz) T (K) H (eV) Ref.
Nb-O 1.02 Figure 5
(relaxation time) 1.17 Figure 6
(diffusion coeficient) 0.80 418 1.15 Figure 8 (Debye peak)
2.9 440 1.15 [10]
3.5 442 1.17 [15]
1.0 430 1.15 [17]
1.3 430 1.15 [19]
6.0 485 1.15 [22]
Ta-O 0.98 Figure 5
(relaxation time) 0.91 Figure 7
(diffusion coeficient)
1.06 414 1.10 Figure 9
(Debye peak)
1.0 421 1.10 [10]
1.0 420 1.10 [11]
2.25 2.30 2.35 2.40 2.45
0.37 1.00 2.72 7.39
Nb - O Experimental points Linear regression
ln (f) (Hz)
1000/TP (K-1)
Ta - O Experimental points Linear regression
A third procedure consists in using the model proposed by Weller et al.14 and Equation 1 in combination with Arrhenius’ law and the temperature dependence for the relaxation strength ∆. In this case, the internal friction can be written as:
( ) cosh ln ( )
Q T Q T T
k H
T T f
f T
1 1
m m
b m m
1 1 1
= - +
- -
-c m d n
= G (12)
The three parameters that characterize a Debye maximum are Qm-1 (peak intensity), Tm (peak’s temperature), and H (activation enthalpy). These parameters can be determined by applying appropriate numeri-cal analytinumeri-cal methods to the experimental data. In this paper, the Peak Fitting Modulus from Microcal Origin®21 was used.
Figures 8 and 9 show an analysis of one of the curves shown in Figures 3 and 4 based on Equation 12. The theoretical curve (full line) represents a Debye peak. The relaxation parameters are presented in Table 2 too.
The results obtained in this paper are in good agreement with data in the literature on the activation enthalpy of the relaxation
process due to stress-induced ordering of oxygen atoms around Nb and Ta atoms in metallic matrix: 1.15 eV and 1.10 eV, respectively (vide Table 2). These results are based mainly on analysis using Debye peak-based itting.
Among the three methods presented, analysis by Debye peak-based itting was the most precise, because the inluence of the relaxation process due to nitrogen cannot be discarded by the two other methods, frequency logarithm (Equation 8) and relaxation time (Equation 11). This occurs because the analysis is based on a single relaxation process and the presence of another relaxation process, in this case due the stress-induced ordering of nitrogen atoms, causes a broadening of the main peak.
4. Conclusions
Anelastic relaxation measurements of Nb and Ta polycrystalline samples with oxygen and nitrogen in solid solution were made.
The results showed spectra containing a relaxation peak that was
1.8 2.0 2.2 2.4 2.6 2.8
0.001 0.005 0.039 0.286 2.115 15.629
D x 10
-15
(cm
2/s)
1000/T (K-1) Nb-O
f = 0.80 Hz f = 1.17 Hz f = 4.30 Hz Linear regression
1.8 2.0 2.2 2.4 2.6 2.8
0.005 0.039 0.286 2.115 15.629 115.482
D x 10
-15
(cm
2/s)
1000/T (K-1)
Ta-O f = 1.06 Hz f = 1.52 Hz f = 4.66 Hz Linear regression
Figure 9. Internal friction as a function of temperature for Ta sample measured with frequency of 1.06 Hz. The full line shows Debye’s peak.
Figure 6. Diffusion coeficient as a function of the inverse of the tempera-ture for Nb-O relaxation process measured with frequencies of 0.80 Hz (•), 1.17 Hz (ο), and 4.30 Hz (×).
Figure 7. Diffusion coeficient as a function of the inverse of the tempera-ture for Ta-O relaxation process measured with frequencies of 1.06 Hz (•), 1.52 Hz ((ο), and 4.66 Hz (×)., and 4.66 Hz (×).
300 350 400 450 500
0.000 0.003 0.006 0.009 0.012 0.015 0.018
Experim. points Debye's peak f = 0.8 Hz
Q
-1
T (K) Nb
300 350 400 450 500
0.000 0.001 0.002 0.003 0.004 0.005 0.006 0.007
Experim. points Debye's peak f = 1.06 Hz
Q
-1
T (K) Ta
attributed to the relaxation process due to stress-induced ordering of oxygen atoms around Nb (Ta) atoms in the metallic matrix.
The activation enthalpy and the diffusion parameter values of oxygen atoms in Nb and Ta obtained by three methods were 1.15 eV and 3.17 x 10⁻⁴ cm2/s for Nb, and 1.10 eV and 2.03 x 10⁻⁵ cm2/s for Ta, respectively.
Acknowledgments
The authors would like to thank Fundação de Amparo à Pesquisa do Estado de São Paulo (FAPESP), Conselho Nacional de Desen-volvimento Cientíico e Tecnológico (CNPq) and to Fundação para o Desenvolvimento da UNESP (FUNDUNESP) for the inancial support.
References
1. Lundin CE, Klodt DT. The alloy systems of the group Va metals.
Transac-tions of the ASM. 1961; 53(4):735-741.
2. Wert C. Physical acoustics. vol. 3A. New York: Academic Press; 1966.
3. Wukusick CS. Refractory metals and alloys. London: Gordon and Breach; 1967.
4. Igata N, Miyahara K, Hakomori K. Radiation anneal hardering of neutron-irradiated niobium. Journal of Nuclear Science and Technology. 1979; 16(1):73-75.
5. Kubin LP. Reviews on the deformation behavior of materials. 1982; 4(3):181-275.
6. Snoek L. Effect of small quantities of carbon and nitrogen on the elastic and plastic properties of iron. Physica. 1941; 8(7):711-733.
7. Nowick AS, Berry BS. Anelastic relaxation in crystalline solids. New York: Academic Press; 1972.
8. Farraro RJ, McLellan RB. Diffusivity of oxygen and nitrogen in niobium.
Materials Science and Engineering. 1978; 33(1):113-116.
9. Nowick AS. Diffusion in crystalline solids. New York: Academic Press; 1984.
10. Haneczok G, Weller M. Analysis of internal friction spectra caused by Snoek-type relaxations. Journal of Less-Common Metals. 1990; 159(3):269-276.
11. Weller M, Li GY, Zhang JX, Kê TS, Diehl J. Accurate determination of activation enthalpies associated with the stress-induced migration of oxygen or nitrogen in tantalum and niobium. Acta Metallurgica. 1981; 29(6):1047-1954.
12. Indrawirawan H, Brasche LJH, Owen CV, Rehbein DK, Carlson ON, Peterson DT, Buck O. Internal-friction studies of the effect of hydrogen on the oxygen Snoek peaks in Va and Nb. Journal of Physics and Chemistry
of Solids. 1987; 48(6):535-539.
13. Powers RW, Doyle MV. Diffusion of interstitial solutes in the group-v transition metals. Journal of Applied Physics. 1959; 30(4):514-524.
14. Weller M, Hanceczok G, Diehl J. Internal-friction studies on oxygen-oxy-gen interaction in niobium: 1. Experimental results and application of pre-vious interpretations. Physics Status Solidi b. 1992; 172(1):145-159.
15. Grandini CR, Scalvi RMF, Oliveira ARG, Florêncio O, Tejima H, Jordão JAR. Estudo do efeito Snoek devido ao oxigênio em nióbio. Revista
Brasileira de Física Aplicada e Instrumentação. 1995; 10(4):133-138.
16. Weller M. Anelastic relaxation of interstitial foreign atoms and their complexes with intrinsic defects in BCC metals. Journal de Physique. 1985; 46(C10):7-14.
17. Florêncio O, Botta Fo. WJ, Grandini CR, Tejima H, Jordão JAR. Anelastic behavior in NbTi alloys containing interstitial elements. Journal of Alloys
and Compounds. 1994; 211-212:37-41.
18. Weller M. Anelastic relaxation of point defects in cubic crystals. Journal
de Physique IV. 1996; 6(C8):63-72.
19. Grandini CR, Ferreira, LEC, Sandim, HRZ, Florêncio, O,Tejima, H, Jordão, JAR. Internal friction measurements in Nb-0.3wt.%Ti containing oxygen. Journal de Physique IV. 1996; 6(C8):135-138.
20. Grandini CR. A Low cost automatic system for anelastic relaxation measurements. Revista Brasileira de Aplicações de Vácuo. 2002; 21(1-2):13-16.
21. Microcal Origin - Version 6. User’s Manual. Northampton; 1999.