Consumption of Dependence-Producing
Substances in Colombia1
YOLANDA
TORRES
DE GALVIS~ & LENN MURRELLE~
A survey examining the use of six dependence-producing .-_ . . .- . . substances (alcohol, - . to-
bacco, tranquilizers, marijuana, coca paste or “basuca, ” and cocaine) was con-
ducted in Colombia in 1987. The survey population consisted
of
2,800 urban resi- dents in four cities (Barranquilla, Bogota, Cali, and Medellin) between the agesof
12 and 64. The results indicated that substantially more men than women wereusing all the substances involved except tranquilizers, that high proportions of study subjects used alcohol and tobacco, that 8.1% of the study subjects could be considered alcoholics, and that another 7.3% were at risk
of
becoming alcoholics. User prevalencesof
the three illegal substances (marijuana, basuca, and cocaine) were much lower, and the prevalence of marijuana users exceeded thatof
the other two drugs combined. However,1%
of
the male study subjects reported using basuca within the past year. The high prevalence of basuca use has important public health implications, because the drug typically does great harm to its users within a short periodof
time.A
lcoholism, smoking, and drug ad- diction have emerged in recent years as priority public health problems in Colombia. To date, several epidemio- logic investigations of these matters have been conducted (l-11). The study de- scribed here had two main aims: first, to assess the situation regarding consump- tion of dependency-producing sub- stances; and second, to explore some hy- potheses about causal associations. It is expected that the results of the study will serve as a basis for orienting and evaluat-This article is a summary of the work “Estudio national sobre alcoholismo y consume de sustan- cias que producen dependencia,” by the same au- thors, published by the University of Antioquia, Medellfn, Colombia, in 1988.
director. Research Center, National Public Health Faculty,‘University of AnGoquia, Medellfn, Colom- bia. Mailing address: Apartado Aereo 51922, Me- dellfn, Colombia.
3Associate Researcher, Center for Alcohol Studies, School of Medicine, University of North Carolina, Chapel Hill, North Carolina, USA.
ing prevention programs and also for in- forming decision-makers seeking to for- mulate policies in this delicate area.
hliXIERIALS AND
METHODS
The study, carried out in 1987, em- ployed a representative sample (n= 2,800) of urban residents between the ages of 12 and 64. (The 1985 Census re- corded 12,641,741 such residents in Co- lombia.) It did not include institutional populations such as armed forces mem- bers, prisoners, or hospital inpatients; nor did it include transients or people without fixed domiciles.
The prevalence survey method was used. Descriptive analysis was supple- mented by data on causal associations, measurement of the strength of these as- sociations in terms of user prevalence dif- ferences, and calculation of these differ- ences’ degree of statistical significance.
With regard to place, the study sub-
jects’ degree of urbanization was exam- ined in four metropolitan areas-those of Bogot& Medellfn, Cali, and Barranquilla. The sociodemographic variables studied were the subjects’ age, sex, marital sta- tus, amount of schooling, employment status, and people with whom they shared their homes.
Time parameters were used to define several indicators of consumption. These indicators included the prevalence of consumption in the last year (equal to the total number of users during this period divided by the total population studied, multiplied by 1,000); the index of former use (equal to the total number of people who had used the drug in question at least once in their lives and who at the time of the survey had completed more than one year of abstinence, divided by the total population studied, multiplied by 1,000); and lifetime prevalence, also called the global index (the total number of current and former users divided by the total population studied, multiplied by 1,000).
In addition, the number of years and months of use were recorded, and these time variables were used to calculate the incidence of consumption (considering new consumers to be those using drugs 11 months or less) and also the preva- lence of consumption within the last 30 days.
Both the sample selection and data col- lection were handled by professionals in these fields. Initially, several instruments used in the United States were examined (12), together with others used for pre- vious research in Medeb (4-8) and ones being currently applied at clinical settings in Colombia (23-17). Proceeding from the models provided by these documents, the instrument employed to collect data in the present study was prepared by the authors. This preceded instrument in- cluded the CAGE questionnaire for the diagnosis of alcoholism (24, 28-21) and
the self-administered Zung scale for as- sessing clinical depression (27, 28, 22-24).
The instrument was administered to the respondents in two stages. During the first (interview) stage, the person making the survey asked the study sub- ject a list of general questions on the use of tranquilizers and tobacco. Then, dur- ing the second (questionnaire) stage, the subject provided anonymous written an- swers to questions of a more personal na- ture on the use of socially or legally unac- ceptable substances, with assistance from the interviewer. In order to minimize dis- tortion of the information being pro- vided, the “secret ballot” method was employed.
The validity of responses to self- administered questionnaires has been widely recognized, a state of affairs that was reinforced in this study by the expla- nations that the interviewers provided to the survey subjects.
RESULTS
Sex-Specific User Prevalences
Higher percentages of men than women made use of all the substances listed except tranquilizers (Table 1), and the observed differences between the
Table 1. Study subjects reporting use of one or more of the six substances investigated within the last year, by sex; Colombia, 1987.
Substance Alcohol Tobacco Tranquilizers Marijuana Basuca Cocaine
User prevalences per 1,000 subjects, by sex Men Women Total
705 416 560 373 222 297
46 74 60
19 3 11
10 3 6
4 1 3
male and female prevalences involved was generally quite significant.
The substance used by the largest num- bers of study subjects of both sexes was alcohol. Overall, 56% (560 per thousand) of all the study subjects reported using alcoholic beverages within the last year. Tobacco ranked second, with 30% report- ing use of tobacco products within the past year.
Tranquilizers, which like alcohol and tobacco are socially accepted, ranked third in terms of user prevalence. How- ever, as many investigations done in other countries have also found, the bulk of the users were women (7.4% of the female study subjects versus 4.6% of the males).
Regarding the percentage of marijuana users, this exceeded the percentages of those using each of the other substances considered illegal. Specifically, 1.9% of the male study subjects and 0.3% of the females reported using marijuana within the past year. The difference between these figures indicates that a strong asso- ciation exists between the male sex and use of this substance.
Basuca (coca paste) use within the last year was reported by 1% of the male study subjects and 0.3% of the females- indicating a preponderance of male us- ers. In recent years this drug has tended to displace other forms of cocaine, and the user prevalence data shown in Table 1 suggest that basuca users among the
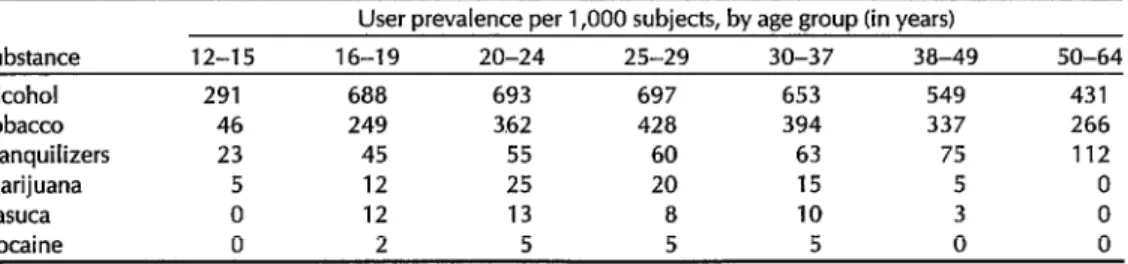
Table 2. Study subjects reporting use of one or mc last year, by age group; Colombia, 1987.
study subjects outnumbered cocaine us- ers two to one.
Age-Specific User Prevalences
Although noteworthy numbers of alco- hol and tobacco users appeared in the youngest (12-15) age group studied, Ta- ble 2 shows very sharp user prevalence increases in the next (16-19) age group. These prevalences then level off among older age groups in the case of alcohol use, while continuing toward a peak in the 25-29 year group in the case of to- bacco .
Regarding tranquilizers, although noteworthy numbers of users appeared in the youngest age group, the one-year user prevalence rose consistently with age-reaching its maximum of 112 users per 1,000 study subjects in the oldest (50- 64) age group. The user prevalence found in the youngest age group is in agree- ment with the results of other studies conducted among secondary students in Colombia (2, 2, 5, 6, 20, 25, 26).
Marijuana was the most commonly used of the illegal substances studied. Marijuana user prevalences by age (see Table 2) were found to follow a fairly symmetrical curve among our study sub- jects. Peak prevalences (25 and 20 per thousand) of those using marijuana within the past year occurred in the 20-24 and 25-29 age groups; lesser prevalences were registered by the 16-19 and 30-37
Ire of the six substances investigated within the
User prevalence per 1,000 subjects, by age group (in years)
Substance 12-15 16-19 20-24 25-29 30-37 38-49 50-64
Alcohol 291 688 693 697 653 549 431
Tobacco 46 249 352 428 394 337 266
Tranquilizers 23 45 55 60 63 75 112
Marijuana 5 12 25 20 15 5 0
Basuca 0 12 13 8 10 3 0
Cocaine 0 2 5 5 5 0 0
age groups; and very low or zero preva- lences were found in the youngest (12- 15) and oldest (38-49 and 50-64) groups.
Among males, the highest prevalence of those who reported using marijuana within the last year (5%) was found in the 20-24 year age group, while among fe- males this highest prevalence (1%) was found in the 16-19 year group.
The lifetime prevalence of marijuana users (the proportion who said they had used marijuana sometime in their lives) was highest among males in the 25-29 and 30-37 groups, where it was 17.6%. Among females, the highest lifetime prevalence (7.5%) was found in the 25-29 group.
No basuca users were found in the youngest (12-15) age group, but a near- peak one-year user prevalence (12 per thousand) was found in the 16-19 group. This prevalence is very high in terms of public health impact, because basuca does great harm to its users and has a short latency period. Comparable preva- lences ranging from 13 to 8 per thousand were found in the 20-24, 25-29, and 30- 37 age groups (see Table 2), with substan- tially lower (3 per thousand and zero) prevalences occurring in the 38-49 and 50-64 groups, respectively. It should be noted, however, that the indicators of former use showed very different pre- vious behavior.’
Among males, the 20-24 group ap- peared to be at greatest risk, the user prevalence in this age range being 25 per thousand. Among females, the highest user prevalence occurred in the 16-19 group, where it was 10 per thousand.
Cocaine use within the last year was reported in only four of the seven age groups studied, the user prevalences in these groups being 2 per thousand in the 16-19 age group and 5 per thousand in the 20-24, 25-29, and 30-37 groups. The age group with the highest prevalences of lifetime (current plus former) cocaine
users of both sexes was the 25-29 group, where the prevalence of male lifetime us- ers was 7.5% and the prevalence of fe- male lifetime users was 2.5%. Displace- ment of the 30-37 age group in this case may be attributable to exposure of the two cohorts to different substances.
Alcoholism
The CAGE questionnaire was used to evaluate alcoholism. This instrument contains only four questions, and an overall score is obtained by totaling the positive responses (18-21). Subjects re- sponding positively to zero or one ques- tion are classified as “normal,” to two questions are classified as being at high risk of alcoholism, and to three or four are classified as “alcoholic.”
As previously noted, 56% of the study population was found to have used alco- holic beverages within the last year. Re- sponses to the CAGE questionnaire indi- cated that 7.3% of the total study population was at high risk of alcoholism and another 8.1% was classified as alco- holic.
As can be seen in Figure 1 and Table 3, the problem of alcoholism among males was found to be pronounced in the 20-24 and older age groups, although some al- coholics were found in the 16-19 and even the 12-15 groups. Although the prevalence of male alcoholics was highest in the 3849 year group, rates nearly as high were registered in the 20-24, 25-29, and 30-37 age ranges. However, the prevalence of alcoholics in the 50+4 year group was substantially lower, presum- ably in part as a result of alcohol-related deaths due to accidents, violence, or other causes.
A very different pattern was found among female study subjects, with those classed as alcoholics being most preva- lent in the 25-29 year group. It should be noted that women in this age range had
”
12-15 16-19 20-24 25-29 30-37 38-49 50-64 Agegroup
Males
lzzi Females
Figure 1. Rates of alcoholism among the study subjects by age group and sex, as indicated by their responses to the CAGE questionnaire; Colombia, 1987.
the highest degree of participation in the job market, and also that an association was found between alcoholism and working outside the home-the preva- lence of alcoholics among those working outside the home being twice that found among the housewives.
It is probable that in the future the age- specific curve for alcoholism will begin to shift, since the 16-19 group seems to be at high risk for its age, and displacement of older cohorts appears likely.
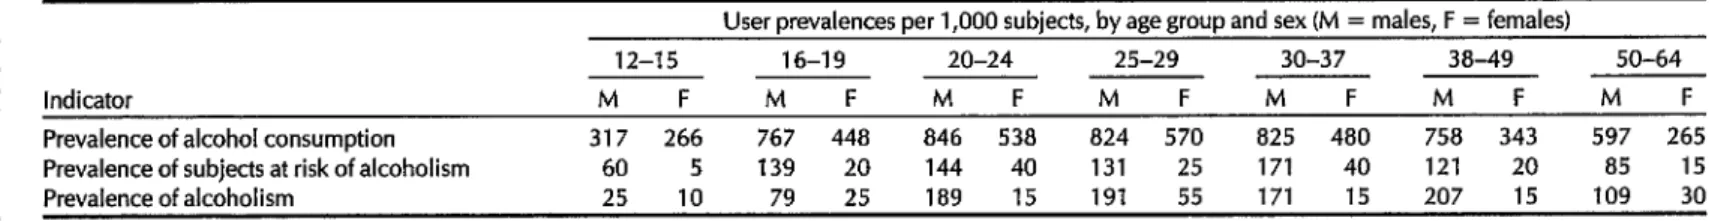
Comparing prevalences of alcohol us- ers with the prevalences of alcoholics in- dicated by the CAGE questionnaire results shows that the highest prevalence of male alcoholics emerged in the 38-49 year group, which did not have the high- est prevalence of users. In the case of women, however, the highest preva- lences of users and alcoholics occurred in the 25-29 year group, which also coin- cided with peak employment (see Table 3). It should be emphasized that serious problems of early alcoholism were found in both sexes. Indeed, the CAGE results indicated that a large percentage of the
16 Buzk?ti7IofPRHO24(z), 1990
16-19 group was at high risk of becoming alcoholic. These data agree with observa- tions of clinicians, who have been report- ing that the age curve of patients treated for alcoholism is getting younger (27).
The foregoing data can be supple- mented by findings from the 1980 Na- tional Health Survey conducted by Co- lombia’s Ministry of Health, which classified people over 15 years of age as alcoholics if they consumed liquor more than three days a week or consumed more than one bottle of liquor (equivalent to a one-quart whiskey bottle) one to three days a week (28,29).
Other
Findings
Regarding marital status, the preva- lence of those using alcohol, marijuana, basuca, or other forms of cocaine was
0.53%
higher among males in consensual unions than among those who were mar- ried. With respect to females, the highest: prevalences of those using these drugs were found among single women.Table 3. A comparison between the prevalence of study subjects using alcohol within the last year and the prevalence of alcoholics as indicated by H
ii
responses to the CAGE questionnaire, by age group and sex; Colombia, 1987.
% User prevalence5 per 1,000 subjects, by age group and sex (M = males, F = females)
p 12-15 16-19 20-24 25-29 30-37 38-49 50-64
Indicator M F M F M F M F M F M F M F
: Prevalence 9 Prevalence Prevalence
of
of alcohol consumption at risk of alcoholism subjects
alcoholism
317 60 266 5 767 139 448 20 846 144 538 40 824 131 570 25 825 171 480 40 758 121 343 20 597 85 265 15
of 25 10 79 25 189 15 191 55 171 15 207 15 109 30
6
8
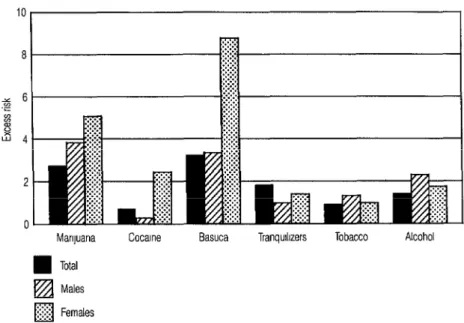
n
Manluana Cocaine Basuca Tranquikers Tobacco Alcohol
q
Malesq
FemalesFigure 2. Excess risk of attempted suicide among drug users in the study popula- tion, by sex and type of drug involved; Colombia, 1987.
ployed groups, the unemployed were found to exhibit higher user prevalences of all the substances studied. Among study subjects living in shantytowns, fe- males were found to be at relatively greater risk of becoming marijuana or ba- suca users than females living in other areas. In general, basuca users tended to be concentrated among members of the lower socioeconomic strata. In the upper socioeconomic classes the highest fre- quencies of cocaine and marijuana use were recorded among males.
In addition, a statistically significant as- sociation (p<O.Ol) was found between attempted suicide and drug use among members of the study population be- tween 15 and 54 years of age. As Figure 2 shows, the risk of suicide was found to increase most markedly among basuca and marijuana users, especially when these users were women.
Table 4 shows user incidence and prev- alence patterns, by sex, of the various substances investigated. Of the three ille-
18 Bullefin
of
PAHO 24(l), 2990gal drugs, marijuana was found to have the highest one-year user incidence, 30- day user prevalence, one-year user prev-
alence, former consumer prevalence, and period prevalence. These data contrast with those from previous studies (2-4, 7) indicating that the one-year incidence of basuca use exceeded the one-year inci- dence of marijuana use. The difference in these incidence data may be the result of a mass campaign directed against basuca.
Regarding marijuana, basuca, and co- caine, the 30-day user prevalences of these substances appear virtually identi- cal to the one-year user prevalences- perhaps largely as a result of their great addictive power.
Table 4. Indicators of consumption per 1,000 subjects (one-year user incidence, 30-day user prevalence, one-year user prevalence, former user prevalence, and lifetime prevalence) of five of the dependence-producing substances investigated, by sex (M = males, F = females, T = total); Colombia, 1987.
One-year SO-day Oneyear Ex-consumer Lifetime
incidence prevalence prevalence prevalence prevalence
Substance M F T M F T M F T M F T M F T
Alcohol 27 45 36 600 259 430 705 416 560 119 102 110 824 518 671 Tranquilizers 19 32 25 39 69 54 46 74 60 63 103 83 109 177 143
Marijuana 4 2 3 19 3 11 19 3 11 84 25 55 103 28 65
Basuca 2 1 1 10 2 6 10 3 6 51 11 31 61 14 37
REFERENCES 1. 2. 3. 4. 5. 6. 7. 8. 9. 10. 11. 20
Bedoya Morales, A., J. Roadas, J. A. Vergara, C. Paredes, B. Mejfa G., and M. I’. Camargo. Drug dependence among secondary school students at Bogota, Ba- rranquilla and Bucaramanga (Colombia): Survey of the prevalence of drug abuse. Bull Narc 28(3):11-29,1976.
Climent, C. E., and L. V Aragon. Abuso de drogus en cinco colegios de Cali. Universidad de1 Valle, Cali, 1982.
Hermindez, G. The Epidemiology of Co- caine and Bazuco Use in Colombia. Paper presented at the World Health Organiza- tion Advisory Group Meeting on the Ad- verse Health Consequences of Cocaine and Coca Paste Smoking, Bogota, Sep- tember 1984.
Perez Tob6n, L., et al. Consumo de sustan- cias que producen dependencia en poblacion post-secundaria de Mea’ellin. Facultad Na- cional de Salud Ptiblica, Universidad de Antioquia, Medellfn, 1983.
Ruiz, A. L., et al. Alcoholismo y farmacode- pendenciu en escolares de Antioquiu. Ministe- rio de Salud, Servicio Sectional de Salud de Antioquia, Medellfn, 1980.
Londofio l?, M. G., et al. Estudio de la fur-
macodependencia en la poblacion mayor de 10 adios de Puerto Berrio, Anfioquia. Facultad National de Salud Priblica, Universidad de Antioquia, Medellin, 1984.
Velasquez de P, E., et al. Estudio epide- miol6gico de uso de drogas en poblaci6n general de Medellfn. Rev Colomb Psiquiatr 14(1):116-153,1985.
Solis M., N. Prevalencia de farmacodepen- dencia en el sector industrial de Medellin. Fa- cultad National de Salud Ptiblica, Univer- sidad de Antioquia, Medellfn, 1977. Colombia, Miiterio de Salud. Una per- spectiva de la situation de las farmacodepen- dencias en Colombia. Direcci6n de Atencion Medica, Division de Salud Mental, Bo- gota, 1981.
Climent, C. E., and L. V Aragon. Factores asociados con el uso de drogas en estu- diantes de secundaria en Cali: Parte I. As- pectos epidemiologicos y psicometricos. Colomb Med 17(2):58-69,1986.
Rojas M., R., and J. de 10s Rfos 0. Habitos de ingesti6n de bebidas alcoholicas en una comunidad rural de Antioquia, Co-
Bulletin @PAHO 24(l), 2990
12. 13. 14. 15. 16. 17. 18. 19. 20. 21. 22.
lombia. Bol Of Sanit Panam 83(2):148-162, 1977.
National Institute on Drug Abuse. Na-
tional Household Survey on Drug Abuse: Population Estimates 1985. DHHS Publica- tion (ADM) 87-1538. Department of Health and Human Services, Washing- ton, D.C., 1987.
Hospital Mental de Antioquia. Segundo Taller sobre Aplicacio’n de Instrumentos Clinicos-invesfigativos en la Adiccion Homo: Manual de Aplicaci6n, Calificacion e Inferpre- tacion. Bello, Antioquia, 1988.
Edwing, J. A. Detecting alcoholism: The CAGE questionnaire. JAMA 252:1905- 1907,1984.
Selzer, M. L. The Michigan Alcoholism Screening Test: The quest for a new diag- nostic instrument. Am J Psychiatry 127: 1653-1658,197l.
McLellan, A. T., L. Luborsky, C. P. O’Brien, and G. E. Woody. Improved di- agnostic instrument for substance abuse patients: The Addiction Severity Index. J Nero Ment Dis 168:26-33,198O.
Zung, W. W. K. A self-rating depression scale. Arch Gen Psychiatry l2:63-70,1965. Berdat, R., W. Munford, J. Taylor, et al. Comparison of questionnaire and labora- tory test in detection of excessive drink- ing and alcoholism. Lancet 1:325-328, 1982.
Beresford, T. P., D. Low, R. Adduci, et al. The CAGE questionnaire in assessing al- coholism prevalence in the general hospi- tal: Abstract 49. In: Proceedings of the Sixth World Congress of the Internafional College of
Psychosomatic Medicine, Montreal, 1981. p. 13.
Cyr, M. G., and S. A. Wartman. The ef- fectiveness of routine screening questions in detection of alcoholism. JAMA 259(1):51-54,1988.
23. Zung, W. W. K. Zung Self-rating Depres- sion Scale and Depression Status Inven- tory. In: Sartorius and Ban (eds.). Assess- ment of Depression. Berlin, Springer- Verlag, 1986, pp. 221-231.
24. Zung, W. W. K., C. B. Richards, and M. J. Short. Self-rating depression scale in an out-patient clinic: Further validation of the SDS. Arch Gen Psychiatry 13:508-515,
1965.
25. Colombia, Ministerio de SaIud. Prevalen- cia de
fa~coa~02ae7
entre escolares de secundaria en Bogotd, Barranquilla y Bucara- manga. Bogota, 1976.26. Ruiz, A. L., M. C. Ferkindez, et al. Preva- lencia de consumo de sustancias que producen dependencia en poblacio’n escolar de secunakria en nueve municipios sede de las unidades re- gionales de salud: Antioquia, 1980. Ministe- rio de SaIud, Servicio SeccionaI de SaIud de Antioquia, MedeIIfn, 1980.
27. Orejuela, E. Personal communication, January 1987.
28. Colombia, Ministerio de SaIud. Estudio national de salud. Bogota, 1982.
29. Torres de GaIvis, Y., and L. MurreIIe. Al- coholismo y ha%to de fumar en Colombia. Fa- c&ad NacionaI de SaIud Piiblca, Univer- sidad de Antioquia, MedeIIfn, 1986.
Cot-$eren.ce
on Nosing and Technology
A conference entitled “High Tech Caring: An International Scientific and Educational Conference for Nurses on Caring and Technology” is sched- uled to be held in Montreal, Quebec, Canada, on 18 and 19 October 1990. i For further information, contact the Conference Office, McGill University, ~ High Tech Secretariat, 3450 University Street, Montreal, Quebec, Canada, 1 H3A 2A7; telephone (514) 398-3770; telex 05-258510; telefax (514) 398-4854.