química
www.scielo.br/ eq
Volume 35, número 3, 2010 Art igo/ Art icle
DEVELOPMENT AND VALIDATION OF
SPECTROPHOTOMETRIC METHOD FOR THE
DETERMINATION OF DPP-4 INHIBITOR, SITAGLIPTIN,
IN ITS PHARMACEUTICAL PREPARATIONS
C.
Bala Sekaran
1*, A. Prameela Rani
21 Department of Biotechnology, J. K. C. College, Guntur, India. 2 Department of Pharmaceutics, K.V.S.R. Siddhartha College of
Pharmaceutical Sciences, Vijayawada, India.
* Corresponding Author: C. Bala Sekaran, 20-3/2-5, II Floor, Ramalayam Street, Ayodhya nagar, Vijayawada – 520 003. Andhra Pradesh.
E-Mail: [email protected]
Call: 91-866-2538492
Abstract: A simple, sensitive and reproducible spectrophotometric method was developed for the determination of sitagliptin phosphate in bulk and in pharmaceutical formulations. The proposed method is based on condensation of the primary amino group of sitagliptin phosphate with acetyl acetone and formaldehyde producing a yellow colored product, which is measured spectrophotometrically at 430nm. The color was stable for about 1 hour. Beer ’s law is obeyed over a concentration range of 5-25 g/ml. The apparent molar absorptivity and Sandell sensi-tivity values are 1.067 x 10⁴ Lmol-1cm-1 and 0.0471 gcm-2 respectively. All the variables were studied to optimize the reaction conditions. No interference was observed in the presence of common pharmaceutical excipients. The validity of the method was tested by analyzing si-tagliptin phosphate in its pharmaceutical preparations. Good recoveries were obtained. The developed method was successfully employed for the determination of sitagliptin phosphate in various pharmaceutical preparations.
Keywords: Sitagliptin phosphate, Acetyl acetone, Beer’s Law, Sandell’s sensitivity.
INTRODUCTION
Sitagliptin phosphate(STP)(1-4) is 1,2,4-triazolo[4,3-a]pyrazine,7-[(3R)-3-amino-1- -oxo-4-(2,4,5-trifluorophenyl)butyl]-5,6,7,8-te-trahydro-3-(trifl uoromethyl)-, phosphate, whose structure is given in the Fig. 1. It is used in the tre-atment of diabetes. It is an oral antihyperglycemic (anti-diabetic) drug of the dipeptidyl peptidase-4 (DPP-4) inhibitor class. Literature survey reveals that only LC-MS (5-8) methods were reported for the determination of sitagliptin phosphate in plas-ma and urine of huplas-mans, rats and dogs. So far,
Fig 1. Sitagliptin phosphate
EXPERIMENTAL
Apparatus
• Spectral and absorbance measurements were carried out by using Systronics UV – Vi-sible Double beam spectrophotometer model 2201.
• Systronics digital pH meter was used to ad-just and determine the hydrogen ion concen-tration (pH) of the buffer solution.
Materials and Reagents: All the chemicals used were of analytical grade. All the solutions were freshly prepared in distilled water.
• Acetylacetone: 8.4% v/v solution was freshly prepared by mixing 2.1 ml of acetyl acetone with 10 ml of acetate buffer (pH 5) and diluted to 25 ml with distilled water. • Formaldehyde (34 - 40%): Twenty percent solution was prepared by mixing 5 ml of for-maldehyde with 10ml of acetate buffer (pH 5) and diluted to 25 ml with distilled water. • Acetate buffer (pH 5): Prepared by dissol-ving 13.6 g of sodium acetate and 6 ml of gla-cial acetic acid in suffi cient water to produce 1000 ml.
• Pharmaceutical grade Sitagliptin phospha-te, certifi ed to be 99.8% pure was procured
from local pharmaceutical industry and was used as received.
• Januvia 100mg, 50mg and 25mg (labeled to contain 100mg, 50mg and 25mg of sitagliptin phosphate per tablet) were obtained from the local pharmacy.
Standard drug solution
Stock solution of STP (1 mg/ml) was pre-pared by dissolving 100 mg of STP in distilled water and making the volume to 100 ml in a stan-dard volumetric fl ask. Working solution of lower concentration (100 g/ml) was prepared by fur-ther dilution of the above standard stock solution with water.
General procedure for the determination of Sita-gliptin phosphate
Different aliquots of working standard so-lutions containing 50-250μg of STP was transfer-red into a series of serially numbetransfer-red 10ml vo-lumetric fl asks. To each fl ask 1 ml of 8.4% v/v acetyl acetone solution and 0.5 ml of 20% for-maldehyde reagents were added. The fl asks were stoppered, contents were mixed well. The mixture was heated for 5 min, cooled and diluted to 10 ml with distilled water. The absorbance of the yellow color solution was measured at 430 nm using the experiment as a blank. The amount of sitagliptin phosphate present in the sample was computed from the corresponding calibration curve.
The calibration graph was prepared was prepared by plotting absorbance versus concentra-tion of drug and the concentraconcentra-tion of the unknown was read from the calibration graph or computed from the regression equation derived from the Beer’s law data. The calibration graph was then prepared by plotting the absorbance versus con-centration of the drug
Assay procedure for pharmaceutical tablets
For the analysis of STP, three brands of commercially available tablets (20) were weighed
and ground into a fi ne powder. An accurately wei-ghed portion of the powder equivalent to 100mg of sitagliptin phosphate was transferred in to a 100ml beaker containing small volume of water and the solution was shaken thoroughly for 10-15 minutes and fi ltered through a whatman fi lter paper no.1 to remove the insoluble matter. The fi lter paper was washed with water and the washings were added to the fi ltrate, the fi nal volume (100ml) was made with water. A suitable aliquot of this solution in the working range of sitagliptin phosphate was treated as per procedure described in the above determination of pure sitagliptin phosphate. The nominal content of STP in the tablets was calcu-lated either from a previously plotted calibration graph or using the regression equation
RESULTS AND DISCUSSION
Determination of Absorption Maxima ( max): To determine the max 10 g/ml of the STP was added to 10 ml volumetric fl ask. Then 1 ml of 8.4% v/v acetyl acetone solution and 0.5 ml of 20% formaldehyde reagents were added. The con-tents were mixed well. The mixture was heated for 5 min, cooled and diluted to 10 ml with distilled water. The absorbance was measured against re-agent blank in the range of 400-700 nm. max for STP was found to be 430 nm. Absorption spec-trum of the proposed method was shown in Fig. 2. Under the experimental conditions each reagent blank showed a negligible absorbance at the cor-responding max.
Fig 2. Tentative reaction scheme for the formation of Hantzch product
Chemistry of the colored species
Hantzsch reaction is a known condensation reaction that was reported in the literatures as a useful pathway for pyrrole and pyridine synthesis (9). In the same manner, acetylacetone together with formaldehyde react with aliphatic amines by Hantzsch reaction forming a yellow product that can be measured spectrophotometrically or spec-trofl uorimetrically. This reaction was applied for the determination of certain sulpha-Drug (10),
ka-namycin (11), lisinopril (12) and gabapentin and cefprozil (13).
Fig 3. Absorption spectra of the Hantzch product
0 0.2 0.4 0.6 0.8 1 1.2
390 400 410 420 430 440 450 460 470 480
Wave length (nm)
A
b
so
rb
an
ce
Investigation of Assay Parameters
Optimum reagent concentrations required for the formation of sensitive and quantitative co-lored products were determined by varying one reagent concentration and fi xing the concentra-tions of other reagents and its effect on absorban-ce was measured at 430nm.
Effect of heating time:
To study the effect of heating time for the development of maximum color, the contents of the mixture were heated for up to 30 min at 100 ± 1°C. The intensity of the color developed was measured at room temperature (25 ± 1°C) after dilution to 10.0ml with double distilled water. It is apparent from this investigation that the maxi-mum intensity of color was obtained after 5 min of heating and remained constant up to 30 min. Therefore, the optimum heating time was fi xed at 5 min.
Effect of reagent concentration:
The effect of acetyl acetone and formal-dehyde concentration on the absorbance was studied; volumes from 0.5-2.5ml of 8.4% acetyl acetone solutions and 0.1 to 1.0ml of 20% formal-dehyde solutions were examined. The investiga-tions showed that 1ml of acetyl acetone and 0.5ml of formaldehyde gave maximum absorbance. So the same volumes of both the reagents were cho-sen for the procedure.
Effect of pH:
Different acetate buffers with pH range of 3.0 - 7.0 were tried and pH 5 was the pH of choice for the proposed method.
Effect of Solvents:
Different diluting solvents were used, such as water, ethanol, methanol, acetonitrile and
ace-tone. Best color intensities were obtained using the fi rst three solvents; water was used, being the most available solvent.
Interference Studies
To study the potential interference from the commonly used excipients and other additi-ves such as glucose, lactose, starch, sodium star-ch glycolate, cellulose, magnesium stearate and
ascorbic acid, recovery studies were carried out. Under the experimental conditions employed, to a known amount of drug (sitagliptin phosphate 25 g/ml), excipients in different concentrations were added and analyzed. Results of the recovery analysis are presented in Table 1. Excipients at the concentrations shown in Table 1 do not interfe-re with the assay. In addition interfe-recoveries in most cases were around 100% and the lower relative standard deviation (RSD) values indicate the good precision of the proposed method.
Table 1. Determination of STP in the Presence of Excipients
S.No. Excipients Amount taken (25 g/ml) Recovery
(%) RSD (%) (n = 5)
1 Cellulose 300 99.8 0.26
2 Glucose 50 99.6 0.15
3 Lactose 300 99.4 0.36
4 Starch 200 100.2 0.42
5 Sodium starch glycolate 100 99.8 0.28
6 Magnesium stearate 50 99.5 0.37
7 Ascorbic acid 50 100.1 0.46
Validation of the method:
Detection and Quantifi cation Limits: Ac-cording to the Analytical Methods Committee(15) the detection limit (LOD) is the concentration of drug corresponding to a signal equal to the blank mean (YB) plus three times the standard deviation of the blank (SB). Quantifi cation limit (LOQ) is the concentration of drug corresponding to the blank mean plus ten times the standard deviation of the blank. The LOD and LOQ values for STP were found to be 1.947 and 5.90 g /ml respectively.
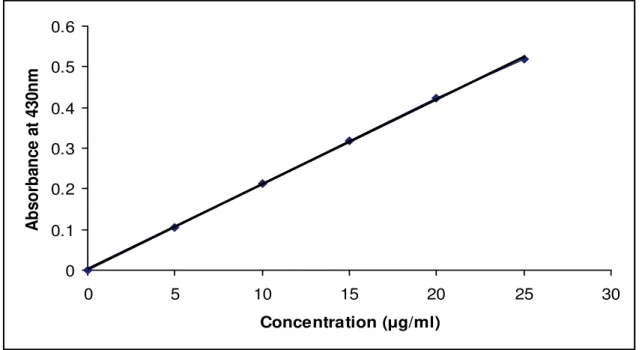
Quantifi cation: The optical characteris-tics such as Beer’s law limits (Fig: 4), Sandell’s sensitivity and molar absorptivity were calcula-ted for the proposed method and the results are summarized in Table 2. Regression analysis of the Beer’s law plot at their max revealed a good corre-lation. Graphs of absorbance versus concentration showed zero intercept and are described by the regression equation Y = bx + a (where Y is the absorbance, b is the slope, x is the concentration
Fig 4. Linearity of absorbance to concentration of Hantzch product
0 0.1 0.2 0.3 0.4 0.5 0.6
0 5 10 15 20 25 30
Concentration (μg/ml)
A
b
so
rb
an
ce at
430n
m
Table 2. Optical and Regression characteristics, Precision and Accuracy of the proposed method
Parameters Method B
max (nm) 430
Beer’s law limit ( g/ ml) 5 - 25
Sandell’s Sensitivity ( g/cm2/0.001 abs. unit) 0.0471
Molar absorptivity(Litre.mole-1.cm-1) 1.067 x 10⁴
Stability of Color (hours) 1
Regression equation (Y)*
Intercept (c) 0.0106
Slope(b) 0.0020
Correlation coeffi cient 0.9998
% Relative standard deviation** 1.13
% Range of errors
0.05% level 0.951
0.01% level 1.397
Limit of detection ( g/ ml) 1.947
Limit of quantifi cation ( g/ ml) 5.90
* Y= c + bx, where Y is the absorbance and x is the concentration of Sitagliptin phosphate in g/ml ** Average of six determinants
Accuracy precision and recovery studies: The accuracy and precision of the proposed method was evaluated by performing fi ve replicate determinations of STP in pure form at three different con-centrations (5, 10 and 15 μg/ml) by short term (intra day) and daily (inter day) precisions (Table 3). The standard analytical errors, relative standard deviations (RSD) and recoveries obtained in the intra day and inter day analysis for the proposed method was found to be acceptable. Thus the proposed method is effective for the determination of STP.
Table 3. Evaluation of the accuracy and precision of the proposed method by Intra day and Inter day assay
Concentration of sitagliptin
phosphate(μg/ml)
Observed Concentration of STP (μg/ml)
Intra-day Inter-day
Mean* Error (%) RSD (%) Recovery (%) Mean* Error (%) RSD (%) Recovery (%)
5 4.97 0.60 0.56 99.40 5.02 0.40 0.48 100.4
10 10.10 1.00 0.39 101.00 9.98 0.20 0.19 99.80
15 15.06 0.40 0.43 100.40 14.97 0.20 0.73 99.80
* For fi ve determinants
The accuracy of the proposed method was further checked by performing recovery experiments through standard addition technique. For this purpose, a known amount of pure STP was added to pre--analyzed dosage forms and then determined by the recommended procedure. The results (Table 4) sho-wn that the mean recovery and relative standard deviation (RSD) were in the range of 99.94–100.12 and 0.26–0.54% indicating the reproducibility of the method.No interference from the common excipients was observed.
Table 4. Determination of STP in pharmaceutical formulations by standard addition technique
Amount of drug added(μg)
Theoretical amount(μg)
Mean amount (μg) Recovered(n=5)
Mean % of
Recovery(n=5) RSD (%)
50 50 100.12 100.12 0.26
100 100 199.89 99.94 0.54
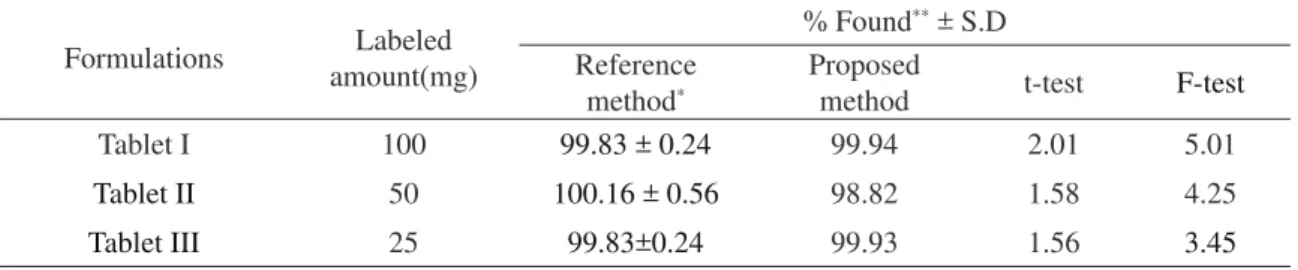
ANALYSIS OF PHARMACEUTICAL PREPARATIONS
Table 5. Results of analysis of tablet formulations containing STP
Formulations Labeled
amount(mg)
% Found** ± S.D Reference
method*
Proposed
method t-test F-test
Tablet I 100 99.83 ± 0.24 99.94 2.01 5.01
Tablet II 50 100.16 ± 0.56 98.82 1.58 4.25
Tablet III 25 99.83±0.24 99.93 1.56 3.45
** Recovery amount was the average of fi ve determinants * UV method developed in the laboratory
Tabulated t-value at 95% confi dence level is 2.306 Tabulated F-value at 95% confi dence level is 6.39
CONCLUSIONS
The proposed method was quite simple and do not require any pretreatment of the drug and tedious extraction procedure. The methods have wider linear range with good accuracy and preci-sion. Hence, the data presented in the manuscript “Development and validation of a spectrophoto-metric method for the determination of a DPP-4 inhibitor, sitagliptin, in its pharmaceutical pre-parations”demonstrate that the proposed method was accurate, precise, linear, selective and offer advantages of reagent availability and stability, less time consumption and high sensitivity. Thus it can be extended for routine analysis of STP in pharmaceutical industries, hospitals and research laboratories. Unlike the LC/MS procedure and high performance liquid chromatography proce-dures, the UV-visible spectrophotometer instru-ment is simple and not of high cost, on the other hand in terms of simplicity and expense, the me-thod could be considered superior in comparison with the previously reported methods. Moreover the methods are free from interferences by com-mon additives and excipients.
ACKNOWLEDGEMENTS
The authors are grateful to the Manage-ment of J.K.C College, Guntur and ManageManage-ment of Siddhartha Academy, Vijayawada for their
con-tinuous support and encouragement for providing the necessary facilities.
REFERENCES
[1] G. Herman, C. Stevens, K. Van Dyck, A. Bergman, Yi B, M. De Smet, K. Snyder, D. Hilliard, M. Tanen, W. Tanaka, A. Wang, W. Zeng, D. Musson, G. Winchell, M. Davies, S. Ramael, K. Gottesdiener and J. Wagner, Clinical Pharmacology and Therapeutics. 78(6) (2005) 675.
[2] Januvia Side Effects & Drug Interactions. RxList.
com, 2007.
[3] U.S. Food and Drug Administration. FDA Approves New Treatment for Diabetes. 2006.
[4] G. Herman, A. Bergman, F. Liu, C. Stevens, A. Wang, W. Zeng, L. Chen, K. Snyder, D. Hilliard, M. Tanen, W. Tanaka, A. Meehan, K. Lasseter, S. Dilzer, R. Blum and J. Wagner. Journal of Clinical Pharmacology. 46(8) (2006) 876.
[5] H. Stella Vincent, R. James Reed, A. J. Bergman, C. S. Elmore, Bing Zhu, Shiyao Xu, David Ebel, Patrick Larson, Wei Zeng, Li Chen, Stacy Dilzer, Kenneth Lasseter, Keith Gottesdiener, J. A. Wagner and G. A. Herman. Drug Metabolism and Disposition. 35(4) (2007) 533.
[6] Wei Zeng, Donald G Musson, Alison L Fisher, Li Chen, Michael S Schwartz, Eric J Woolf and Amy Qiu Wang. Journal of Pharmaceutical and Biomedical Analysis. 2008; 46(3) (2008) 534.
[7] Ramakrishna Nirogi, Vishwottam Kandikere, Koteshwara Mudigonda, Prashanth Komarneni, Raghupathi Aleti, Rajeshkumar Boggavarapu. Biomedical Chromatography. 22(2) (2008) 214.
[8] M. G. Beconi, J. R. Reed, Yohannes Teffera, Yuan-Qing Xia, C. J. Kochansky, D. Q. Liu, Shiyao Xu, C. S. Elmore, Suzanne Ciccotto, D. F. Hora, R. A. Stearns, and S. H. Vincent. Drug Metabolism and Disposition. 35(4) (2007) 525.
[9] F. R. S Derker Bratlon and W. David Olis. Comprehensive Organic Chemistry, The Synthesis and Reactions of Organic Compounds. 4, Pergamon Press, London, 65, 1979, pp. 298.
[10] A. S. Amin and M. M. Zareh. Microchimica Acta.,
124(3-4) (1996) 227.
[11] A. S. Ahmad, M. D. Hoda N, M. Ahmad, F. Islam and S. Z. Qureshi. Journal of Analytical Chemistry. 61(9) (2006) 870.
[12] A. Fawzy. El-Yazbi, H. H. Abdine and R. A. Shaalan.
Journal of Pharmaceutical and Biomedical Analysis.
19(6) (1996) 819.
[13] M. M. Ayad, M. M. El-Henawee, H. E. Abdellatef, H. M. El-Sayed. Alexandria Journal of Pharmaceutical Sciences. 9(2) (2005) 157.
[14] Khalifa Abulghasem El-Aroud, Adel Mohamed Abushoffa and Hisham Ezzat Abdellatef. Chem. Pharm. Bull. 55(3) (2007) 364.
[15] Analytical Methods Committee, 1987. Recommendations for the definition, estimation and use of the detection limit. 1987. Analyst., pp:199