Abed Alr zaq S. Alshqirate*
[email protected]Assistant Professor Al-Shoubak University College
Al-Balqa' Applied University Department of Basic and Applied Sciences 19117 Al-Shoubak, Al-Salt, Jordan *Correspondence Author
Mohammad Tarawneh
[email protected] The Hashemite University Mechanical Engineering Department 13115 Zarqa, JordanMahmoud Hammad
[email protected] Professor, University of Jordan Mechanical Engineering Department 11942 Amman, Jordan
Dimensional Analysis and Empirical
Correlations for Heat Transfer and
Pressure Drop in Condensation and
Evaporation Processes of Flow Inside
Micropipes: Case Study with Carbon
Dioxide (CO2)
In this paper, the experimental results of the convection heat transfer coefficient and pressure drop values during condensation and evaporation of CO2 were obtained at different operating conditions for flow inside micropipes. Reynolds number (ReD) ranged between 2000 and 15000. The dimensional analysis technique was utilized to develop correlations for Nusselt numbers and pressure drops. A comparison between experimental and correlated results was carried out. The results showed that for the condensation process, the bias errors were 5.25% and 0.4% for pressure drops and Nusselt number respectively. Consequently, Average Standard Deviation (ASD) values reached 17.94% and 4.62% for both respectively. On the other hand, for the evaporation process, the Nusselt number error was 3.8% with an ASD of 4.14%. The correlations presented in the present work can be used in calculating pressure drops and heat transfer coefficients for phase change flows in mini and micro tubes. It helps to enhance design calculations of heat exchangers, condensers and evaporators.
Introduction1
Carbon dioxide is an old refrigerant, and the history of its use dates back to the end of the 19th century. The unusual properties of
carbon dioxide give heat transfer and two-phase flow characteristics that are very different from those of conventional refrigerants. Examples of such differences are a much higher pressure, resulting high vapor density, a very low surface tension, and a low liquid viscosity as reported by Kim et al. (2004).
One of the major challenges for CO2 refrigeration systems is the
improvement of the performance of heat exchangers. Park and Hrnjak (2005; 2007), and Abu-Dhem (2006) performed works on CO2 using macro scale tube heat exchangers.
Experimental investigation of the convective boiling heat transfer in the super critical region of CO2 flowing through
micropipes was studied by Liao and Zhao (2002), Choi et al. (2007) and X-Jiang et al. (2004).
Thome and Ribatski (2005) listed previous experimental studies of CO2 flow in macro- and micro- channels undergoing boiling or
simple two phase flow.
Jokar et al. (2006) used the dimensional analysis technique to correlate a formula for heat transfer coefficient and Nusselt number during evaporation and condensation processes of refrigerant R-134a in mini channel plate heat exchangers.
Alshqirate (2008) studied the condensation and evaporation of CO2 inside micropipes experimentally and by using dimensional
analysis.
The basic objective in dimensional analysis is to reduce the number of variables involved in a correlation by introducing independent dimensionless groups of variables (dimensionless parameters). The method for selecting dimensionless groups is using the Buckingham π theorem and the method of indices which is commonly known in the texts of fluid mechanics, as presented by Chapra (1998) and Oosthuizen and Naylor (1999).
Paper received 2 November 2010. Paper accepted 21 October 2011. Technical Editor: José Parise
The main aim of this research is to correlate a relation that can relate the different variables of heat transfer and pressure drop characteristics of any flow undergoing condensation or evaporation. This relation will enhance the calculations of heat flux from pipes with inside phase change flow. Thus, design of heat exchangers, condensers and evaporators will be more reliable and more predictable.
Carbon dioxide is an old refrigerant. It was used in the experimental part of this work. Dimensional analysis results were compared to the experimental results.
Nomenclature
ASD = Average Standard Deviation Ai = micropipe internal surface area, m2 CO2 = carbon dioxide
Cp, m = mean specific heat, J/ (kg K) DAS = Data Acquisition System Di = micropipe internal diameter, m Eu = Euler number
fl = friction factor for liquid state fg = friction factor for gas state F = some function
g(ρl -ρg) = Buoyancy force per unit volume, kg/ (m2 s2) Ga = Galileo number
hfg = latent heat of vaporization, J/ kg
hi = convection internal heat transfer coefficient, W/ (m2 K) Ja = Jacob number
Km = mean thermal conductivity, W/(m K) Ltotal = overall test section length, m L = length of the condensation region, m Lg = length of the cooling (gas) region, m Ll = length of the subcooling (liquid) region, m N = number of data points
Nu = average Nusselt number
Nucorr. = correlated (predicted) average Nusselt number
Pb = barometric pressure, kPa Pga = Gauge pressure, kPa Pin = test section inlet pressure, kPa
Pin ,cond = micropipe condenser inlet pressure, kPa Pout = test section outlet pressure, kPa Pr = Prandtl number
R2 = coefficient of determination (curve fitting) Re D = Reynolds number
T sat, in = condenser inlet saturation temperature, ºC T sat, out = condenser outlet saturation temperature, ºC T si = measured surface temperature, ºC
T surf = calculated surface temperature, ºC Vm = mean velocity, m/ s2
Vg = velocity of the gas, m/ s2 Vl = velocity of the liquid, m/ s2 We = Weber number
W = uncertainty Greek Symbols
∆Pcond = pressure drop during condensation, kPa
∆Ptotal = overall pressure drop, kPa
∆Pg = the pressure drop across the vapor region, kPa
∆Pl = the pressure drop across the liquid region, kPa
∆T = difference between saturation temperature and test section surface temperature, ºC
∆ Tlm = logarithmic mean temperature difference, ºC
∆Tout = difference between outlet saturation temperature and calculated surface temperature, ºC
∆Tin = difference between inlet saturation temperature and calculated surface temperature, ºC
∆Xj = distance along the condenser between two subsequent thermocouples, m
m CO2 = mass flow rate of carbon dioxide, kg/s
Q CO2 = total heat transfer rate rejected from carbon dioxide gas, W
µm = mean dynamic viscosity, Pa s
µg = gas dynamic viscosity, Pa s
µl = liquid dynamic viscosity, Pa s
ρm = mean density, kg/ m3
ρg = gas density, kg/ m3
ρl = liquid density, kg/ m3
σ = surface tension, N/ m V = volume flow rate, l /min Subscripts
b = barometric cond = condenser
corr = correlated (predicted) exp = experimental
g = gas
ga = Gauge
i = internal in = inlet
j = thermocouple number l = liquid
lm = logarithmic
m = mean
out = outlet sat = saturation total = overall Superscripts
a,b,c,d,e, = power constants f,h,i,j,k, = power constants l,m,n,p,q = power constants
Experimental Set-up and Experimental Results
The schematic diagram of the test apparatus used in this study and its main components are shown in Fig. 1. The experimental set-up consists basically of:
1- The pressurized CO2 (g) cylinder as a main source of
carbon dioxide gas.
2- High pressure regulating valve with built-in gas cylinder pressure gauges.
3- Chest freezer used as environment to cool, condense and sub cool the carbon dioxide gas flowing inside the micropipe condenser test section by natural convection. 4- The micropipe condenser.
5- High pressure cutoff and isolating valves. 6- Pressure gauges.
7- Sight glasses.
8- The micropipe evaporator. 9- Data Acquisition System (DAS).
10- Volume flow meter for measuring the mass flow rate of the gas.
K-type thermocouples were used in order to measure the outside wall surface temperature of the micropipe condensers and evaporators during condensation and evaporation processes, the chest freezer inside air temperature and the ambient temperature.
Thirty two temperature readings, distributed along each condenser and each evaporator, were sensed by K-type thermocouples connected to a module of (32 channels), which is in turn plugged into a data acquisition system of model SCXI-1000, manufactured by National Instruments Company.
The well-known LAB VIEW software was used for processing the signals from the thermocouples and for changing it to temperature readings on the screen of a connected personal computer. For each experimental test run, the variations of the temperature with time were monitored. The temperature readings were monitored until the steady state conditions were achieved.
The pressure was recorded in three positions at steady state conditions; they were: before condensation, after condensation and after evaporation. Volumetric rate of flow in m3s-1 was read at the end outlet flow by a gas flow meter calibrated for CO2 (g).
Experiments were conducted for different pipe diameters, at different pressures, and at settings of different rate of flows. More than 2500 readings were collected.
Figure 1. Schematic diagram of the test apparatus.
The experimental convective heat transfer coefficient was calculated (These data are always used to calculate the constants of the empirical equation as will be shown).
The experimental conditions that were used in this study are listed in Table 1.
CO
Flow direction of CO2 (g)
Computer
Data Acquisition System DAS
Chest Freezer
Printer
Condenser
Evaporator
Thermocouples
3
1
4 5
5
5 6
6 7
7
8
9
6 10
Table 1. Experimental conditions.
Test sections Three micropipe condensers
Three micropipe evaporators
Process
Condensation inside a chest freezer of –28oC
Evaporation in still room temperature air Working fluid CO2 (g) CO2 (l)
Micropipe internal diameter, Di , mm
0.6, 1.0, 1.6 0.6, 1.0, 1.6 Test section total
length, m 29.72 16 Test section inlet
pressure, kPa
3350, 3600, 4000, 4500
3600, 4000, 4500, 4800
Saturation temperature, oC
-1.5, 1.23, 5.30, 9.98
1.23, 5.30, 9.98, 12.60
Volume flow rate,
l / min 1, 2, 3, 4 1, 2, 3, 4
Condensation process
Three micropipe test sections of different internal diameters were used for the condensation process with 29.72 m total length for each test section. The test tube was installed inside a chest freezer as a cooling environment. Flow of CO2 (g) inside the tube was carried
out. The micropipe test section outside surface temperatures were measured and recorded in addition to the test section inlet and outlet pressures and gas flow rate for each test.
The experimental data was collected; the pressure drop and the convection heat transfer coefficients during the condensation processes were calculated and studied.
Evaporation process
Three micropipe test sections of different internal diameters were used for evaporation processes with 16 m total length for each test section, located on a table in still, room temperature air. This process was carried out for CO2 (l). The micropipe test section
outside surface temperatures were measured and recorded in addition to the test section inlet and outlet pressures and gas flow rate for each test.
The experimental data was collected; the convection heat transfer coefficients during evaporation processes were calculated and studied
Calculations of Heat Transfer Coefficients and Pressure Drop
Calculation of pressure drop of carbon dioxide
In this research a pressure drop was noticed and can be measured during the condensation process only. A simple technique was followed for the pressure drop calculation based on dividing the test section into three regions as presented in Fig. 2: the first region was considered a single phase carbon dioxide vapor state cooling; the second region was considered a two phase flow (vapor and liquid mixture) condensation; the third region was considered a single phase liquid state carbon dioxide subcooling.
The difference between the measured test section inlet pressure (Pin) in kPa and the measured outlet test section pressure (Pout) in
kPa was recorded as the overall pressure drop (∆Ptotal) in kPa of the complete cooling, condensation and subcooling processes. This was considered for subcritical carbon dioxide flow through micropipe condensers at different inlet pressures, and different volume flow rates for each pressure. Hence, the pressure drop across the vapor region (∆Pg) in kPa, and the pressure drop across the liquid region (∆Pl) in kPa can be calculated, then the pressure drop of carbon
dioxide across the condenser (two phase region) (∆Pcond) in kPa results from:
∆Pcond = ∆Ptotal – (∆Pg + ∆Pl) (1)
where:
∆Pl = ( fl ρl Vl 2 Ll) / (2Di) (2)
∆Pg = ( fg ρgVg2 Lg) / (2Di) (3)
fg , fl are friction factors for the vapor and the liquid states of
CO2, respectively.
Lg, Ll are the length of the cooling (vapor state) and the sub
cooling (liquid state) regions from the test section in meters, respectively. These lengths can be found by considering Fig. 2. This figure represents temperature values for all positions along the pipe. Each test produces such a curve.
Figure 2. Experimental test section outside wall surface temperatures in
o
C versus total test section length during condensation process.
From this figure, it is noticed that these distributions can be divided into three regions which can be represented into three lines: cooling, condensation and subcooling sections. The intersection points of the lines between cooling and condensation, condensation and subcooling processes present the actual start and end points of each section.
As a result of this technique, and from the overall test section length Ltotal = 29.72 m, the micropipe length of each region was found for each experiment.
Vg, Vl are the velocities of vapor and liquid of CO2 in m/s which
can be found by the calculation of respective mass flow rates.
ρg, ρl are the densities of the vapor state and the liquid state of
CO2 in kg/m, respectively.
Calculation of heat transfer coefficient of carbon dioxide
The total heat transfer rate rejected from carbon dioxide gas in watts (W) during a complete condensation process to the
surrounding air,
.
2
Q
CO , was calculated as follows:.
2
Q
CO = .2
m
CO * hfg (4)where
.
2
m
CO is the mass flow rate of carbon dioxide in kg/s and hfg is the latent heat of vaporization in kJ/ kg.Convection internal heat transfer coefficient, hi, is used to describe the heat transfer at the phase change processes, from CO2
(g) to the cold environment in condensation process or to the CO2 (l)
-15 -10 -5
0 5 10 15 20 25
0 5 10 15 20 25 30 35
Length (m)
T
em
p
er
at
u
re
(
oC
)
Device:Micropipe internal diameter 0.6mm
Process: Condensation
from the hot environment in evaporation process. Radial heat flux will be the same either through internal forced convection with CO2
(g), or external natural convection with surrounding air. All these processes were performed under steady state conditions. The two figures in Appendix A illustrate the two processes (condensation and evaporation) and show the limits of the tube regions, especially the phase change region.
The rate of heat transfer from carbon dioxide to the inner surface of the condenser is:
.
2
Q
CO = hi Ai∆ Tlm (5)where hi is the convective internal heat transfer coefficient. The logarithmic mean temperature difference calculation is:
∆Tlm = (∆Tout – ∆Tin) / ln (∆Tout / ∆Tin) (6)
∆Tout = Tsat, out - Tsurf (7)
∆Tin = Tsat, in - Tsurf (8)
where Tsat,outand Tsat,in are the condenser outlet and inlet saturation
temperatures at the outlet and inlet condenser pressures, respectively. Tsurf is the calculated outer surface temperature of the condenser in oC.
Jiang et al. (2004) calculated the outer surface temperature (Tsurf) required for logarithmic mean temperature difference using the following relation:
Tsurf =
L
X
T
si∗
∆
J∑
, j= 1, L (9)
where:
Tsi is the thermocouple measured surface temperature along the
condensation part of test section in oC.
∆XJ = XJ –XJ-1 (10)
is the distance along the condenser between two subsequent thermocouples, m.
L is the length of the condensation part of test section in meter. The complete condensation test section area (micropipe condenser internal surface area (Ai) in m2) can be calculated as
follows:
Ai = π Di L (11)
Dimensional Analysis
The Buckingham π theorem and method of indices were used for finding dimensionless groups appropriate for this problem, and new empirical correlations were developed using the Multiple Linear Regression Method.
This process of dimensional analysis was discussed in many references. Thome (2005) conducted a comprehensive review of various works for prediction of the heat transfer coefficients of flow in channels with phase change of CO2. Not less than 10 variables
were considered. Thus, a very useful comparison was carried out. Jokar et al. (2006) used this process to find the relation between at least 12 variables affecting heat flux of phase change for R-134a flowing inside tubes. Incropera and Dewitt (2002) discussed generally the phase change heat transfer for refrigerants and
mentioned the use of dimensional analysis of at least 10 variables and 5 dimensions.
In this research, the results for convection heat transfer coefficient and pressure drop during condensation processes, and convection heat transfer coefficient during evaporation processes were presented, plotted and discussed.
Dimensional analysis of convection heat transfer coefficient during condensation
The convection internal heat transfer coefficient (hi) of any gas during condensation process in micropipes is expected to depend on the following dimensional variables: the difference between the mean saturation temperature during condensation process and the test section surface temperature; the buoyancy force arising from the liquid-vapor density difference; the latent heat of vaporization; the mean surface tension; the micropipe internal diameter; the length of the micropipe condenser; the mean velocity; the pressure drop across the condenser; the mean value of the density; the mean specific heat; and the mean thermal conductivity and the mean dynamic viscosity as presented by Incropera and Dewitt (2002).
The mean values of the properties were defined by liquid and gas properties,
(i.e., ρm =
2
g
l
ρ
ρ
+
, µm =
2
g
l
µ
µ
+
, etc.).
Liquid and gas properties were obtained from CO2 tables
published by (IIR).
It is assumed, therefore, that:
F [hi, ∆T, g(ρl - ρg), hfg, Di, L, Vm, ∆Pcond, ρm, Cp, m, Km, µm] = 0
(12)
where F is a function. This equation consists of 12 variables with five basic primary dimensions needed to express the variables, these dimensions are: Power [W] in Watt, Mass [M] in kilogram, Length [L] in meter, time [t] in second and Temperature [T] in Kelvin.
Based on the above, the number of the dimensionless variables applicable to this problem was seven.
By using a step-by-step approach, the seven prime variables are selected and another five repeated variables are found. The selected prime dimensional variables are:
hi [W/ (L2 T) ], g(ρl - ρg) [M/ (t 2 L2)], hfg [W t/ M], L [L], Vm
[L/ t], ∆Pcond [M/ (t 2 L)], Cp, m [W t/ (M T)]
The other repeated five dimensional variables are:
Di [L], ρm [M/ L3], Km [W/ (L T)], µm [M/ (L t)], ∆T [T]
Notice that the units of specific heat (Cp, m) and the corrected
latent heat of vaporization (hfg) are written [W s/ (kg K)] rather than [J/ (kg K)], and [W s/ kg] rather than [J /kg], respectively, so as to utilize the set of primary dimensions or units.
The results of dimensional analysis are in the following form:
F(π1,π2, π3,π4,π5, π6, π7) = 0 (13)
π1 = m i i
k
D
h
=
Nu
,π2 =m m i m
D
V
µ
ρ
=ReD, π3 =m m m P
k
C
,µ
=Pr ,
π4 =
2 3
)
(
m m i g lD
g
µ
ρ
ρ
ρ
−
= Ga, π5 =
fg pm
h
TC
∆
= Ja,π6 =
i
D
L
, π
7 =
m m cond
V
P
ρ
2∆
= Eu (14)
Empirical correlation of convection heat transfer coefficient during condensation
The empirical correlation equation for the convection internal heat transfer coefficient during the condensation processes inside micropipe condensers out of the dimensionless group of the average Nusselt number can be obtained as follows:
Nu
= function (ReD, Pr, Ga, Ja, iD
L
, Eu) (15)
A general formula for heat transfer coefficient during condensation can be put in the form:
Nu
=C (ReD)a (Pr)b (Ga)c (Ja)d (i
D
L
)e (Eu)f (16)
where C, a, b, c, d, e, and f are constants.
Solving for carbon dioxide data generated by the experimental work using the Multiple Linear Regression Method will give the following correlation:
Nu
= 2.56 * 10(-5) * [ (ReD)1.27 (Pr )4.37 (Ga)-0.11 (Ja)-1.24
(
i
D
L
) -0.72 (Eu) 0.21] (17)
Dimensional analysis of pressure drops of any gas undergoing condensation process
The pressure drop of any gas during condensation (∆Pcond) is
expected to depend on the following dimensional variables: micropipe condenser inlet pressure (Pin,cond); the micropipe internal diameter (Di); the length of the micropipe condenser (L); the mean velocity (Vm); and the mean value of the density (ρm) and the
dynamic viscosity (µm).
It is assumed, therefore, that:
F [∆Pcond, Pin, cond, Vm, Di, ρm, µm, L] = 0 (18)
where F is a function. There are thus seven variables involved in the pressure drop problem with three basic dimensions needed to express the variables, these dimensions are: Mass [M] in kilogram, length [L] in meter and time [t] in second.
In this problem there are four prime variables selected and another three dimensional variables occur in all theπ's. The selected
prime dimensional variables are:
∆Pcond [M/ (L t 2)], Vm [L/ t], µm [M / (L t)], L [L]
The other three variables are:
Pin, cond[M/ (L t 2)], Di [L], ρm [M /L3]
The dimensional analysis resulted in the following form:
F(π1,π2, π3,π4) = 0 (19)
where:
π1 =
cond in cond
P
P
,∆
= dimensionless pressure drop,
π2 =
2 / 1 , 2 / 1 cond in m m
P
V
ρ
, π3 =
i m cond in m
D
P
1/,2ρ
1/2µ
, π4 =
i
D
L
(20)
The groups'π
2 and π3 are new numbers, once multiplied with
each other a new non-dimensional group is found:
π = π2 * π3 =
2 / 1 , 2 / 1 cond in m m
P
V
ρ
* i m cond in mD
P
1,/2ρ
1/2µ
= m m m m i cond in m mV
V
D
P
V
ρ
ρ
µ
∗
, = m i m m cond in m mV
D
P
V
ρ
µ
ρ
∗
, 2 = DEu
Re
1
1
∗
(21)Empirical correlation of pressure drop during condensation
The dimensionless pressure drop can be obtained as follows:
cond in cond
P
P
,∆
= function (
D
Eu
Re
1
1
∗
, iD
L
) (22)
A general formula for the non-dimensional pressure drop during condensation can be put in the following form:
cond in cond
P
P
,∆
= C (
D
Eu
Re
1
1
∗
) h (
i
D
L
) i (23)
where C, h and i are constants.
Solving for carbon dioxide data generated by the experimental work using the Multiple Linear Regression Method will give the following correlation: cond in cond
P
P
,∆
= 1.56 * [(
D
Eu
Re
1
1
∗
) 0.27 (i
D
L
) 0.14] (24)
Dimensional analysis of convection heat transfer coefficient during evaporation
The convection internal heat transfer coefficient (hi) of any gas
temperature during the evaporation process and the test section wall surface temperature, the buoyancy force arising from the liquid-vapor density difference during phase change, the latent heat of vaporization; the mean surface tension; the micropipe internal diameter; the length of the micropipe evaporator; the mean velocity; the evaporation test section inlet pressure (the saturation pressure); the mean value of the density; the mean specific heat; the mean thermal conductivity and the mean dynamic viscosity.
It is assumed, therefore, that:
F [hi, ∆T, g(ρl - ρg), hfg, σm, Di, L, Vm, Pin, ρm, Cp, m, Km, µm]= 0
(25)
where F is a function. This equation consists of 13 variables with five basic primary dimensions needed to express the variables. Based on the above, the number of the dimensionless variables resulted for this problem was eight.
The results of dimensional analysis are in the following form:
F (π
1,π2, π3,π4,π5, π6, π7,π8) = 0 (26)
where:
π1 = m
i i
k
D
h
=
Nu
, π2 = mm i m
D
V
µ
ρ
= ReD, π3 = m
m m P
k
C
,µ
= Pr,
π4 =
2 3
)
(
m m i g
l
D
g
µ
ρ
ρ
ρ
−
= Ga,π5 = fg
pm
h
TC
∆
= Ja,
π6 = m
i m m
V
D
σ
ρ
2= We, π7 = i
D
L
, π8 = m m
in
V
P
ρ
2 = Eu
(27)
Empirical correlation of convection heat transfer coefficient during evaporation
The empirical correlation equation for the convection heat transfer coefficient during evaporation inside micropipes correlated average Nusselt number can be obtained as follows:
Nu
= function (ReD, Pr, Ga, Ja, We, iD
L
, Eu) (28)
This equation can be put in the following form:
Nu
= C (Re,D)j (Pr)k (Ga)l (Ja)m (We)n (i
D
L
)p (Eu)q (29)
where C, j, k, l, m, n, p and q are constants.
Solving for carbon dioxide data generated by the experimental work using the Multiple Linear Regression Method will give the following correlation:
Nu
= 34.92 * [(ReD)-0.31 (Pr)-0.39 (Ga) 0.11 (Ja)-0.71 (We) 0.81(
i
D
L
) -0.82 (Eu) 0.2] (30)
Results and Analysis
The convection heat transfer coefficient during condensation
The experimentally determined values of the average Nusselt number (
Nu
exp) were compared with the predicted values of theaverage Nusselt number (
Nu
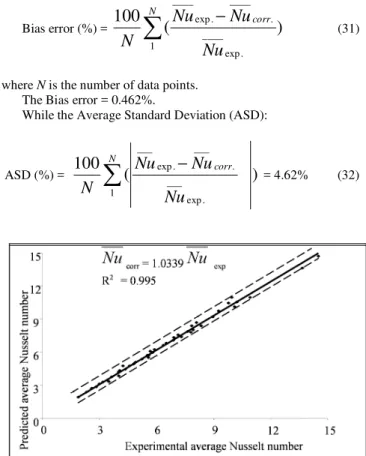
corr.) obtained from Eq. (17). Thecomparison is shown in Fig. 3. A reasonable degree of agreement is exhibited.
For curve fitting it is clear that the Coefficient of Determination (R2) = 0.985, which indicates that 98.5 percent of the original uncertainty has been explained by the linear model.
The accuracy refers to how closely a computed value agrees with the measured value. So the inaccuracy (also called bias) of measured and calculated values can be calculated as follows:
Bias error (%) =
∑
−
N
corr
Nu
Nu
Nu
N
1. exp ____
. ____
. exp ____
)
(
100
(31)
where N is the number of data points. The Bias error = 0.462%.
While the Average Standard Deviation (ASD):
ASD (%) =
100
(
)
1
. exp ___
. ___
. exp ___
∑
N−
corrNu
Nu
Nu
N
= 4.62% (32)Figure 3. Comparison of the experimental and predicted values of the Nusselt number of Carbon Dioxide during condensation.
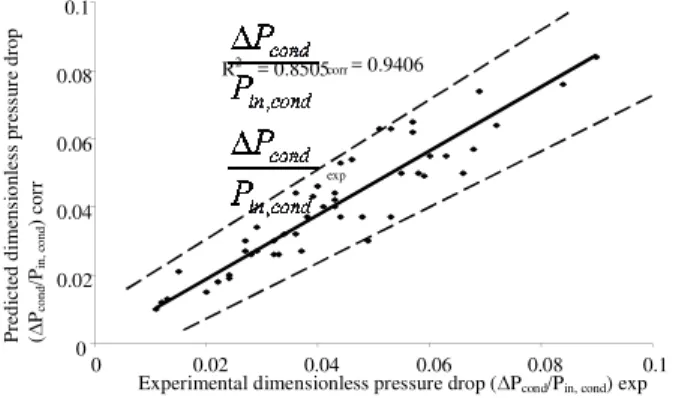
The pressure drop during condensation
The experimentally determined values of the pressure drop
cond in
cond
P
P
,
∆
exp were compared with the predicted values of the
pressure drop
cond in
cond
P
P
,
∆
corr obtained from the resulted correlation of
Figure 4. Comparison of the experimental and predicted values of the dimensionless pressure drop of Carbon Dioxide during condensation.
Figure 5. Comparison of the experimental and predicted values of the Nusselt number of Carbon Dioxide during evaporation.
For curve fitting it is clear that R2 = 0.85 which indicates that 85% of the original uncertainty has been explained by the linear model.
The Bias error (%) =
∑
N
N
1100
[( cond in condP
P
,∆
exp. -
cond in cond
P
P
,∆
corr.) cond in condP
P
,/
∆
exp.] = 5.25%. (33)While the Average Standard Deviation (ASD):
ASD =
∑
N
N
1100
[( cond in condP
P
,∆
exp. -
cond in cond
P
P
,∆
corr.) /
cond in cond
P
P
,∆
exp]= 17.94%. (34)
The convection heat transfer coefficient during evaporation
The experimentally determined values of the average Nusselt number (
Nu
exp) were compared with the predicted values of theaverage Nusselt number obtained from Eq. (19). The comparison is shown in Fig. 5. A reasonable degree of agreement is exhibited.
For curve fitting it is clear that R2 = 0.995 which indicates that 99.5% of the original uncertainty has been explained by the linear model.
The Bias error (%) =
∑
−
N corr
Nu
Nu
Nu
N
1 . exp ____ . ____ . exp ____)
(
100
= 3.8% (35)
While the Average Standard Deviation (ASD):
ASD =
100
(
)
1 . exp ___ . ___ . exp ___
∑
N−
corrNu
Nu
Nu
N
= 4.14% (36)No pressure drop of reasonable value was noticed for the evaporation process inside the micropipe flow.
The uncertainty analysis of the convection heat transfer coefficient
Since the convection heat transfer coefficient is a function of:
hi = hi (Tsurf, Pga, Pb,
.
V
) (37)where Tsurf is the micropipe outside wall surface temperature, Pga is
the gauge pressure, Pb is the barometric pressure at the experimental
set-up location,
.
V is the volume flow rate.
Then the error depends on the accuracy of previously mentioned measuring variables, so the uncertainty of carbon dioxide's convection heat transfer coefficient can be calculated as follows:
Whi = .
2 2 2 2 2 2 2 2 1/2 .
[(
)
(
)
(
)
(
) ]
surf ga b
CO CO CO CO
T P P
V surf ga b
h
h
h
h
W
W
W
W
T
P
P
V
∂
+
∂
+
∂
+
∂
∂
∂
∂
∂
(38) surf COT
h
∂
∂
2= 1.2799,
ga CO
P
h
∂
∂
2= 0.2377,
b CO
P
h
∂
∂
2= 0.0061,
. 2
V
h
CO∂
∂
= 0.0244The uncertainty of the K-type thermocouples (
surf
T
W
) is ±1.0oC;the uncertainty of pressure gauge (
ga
P
W
) is ±0.5 bar; the uncertaintyof the barometer (
b
P
W
) is ±0.25 mbar; and the uncertainty of the volume flow meter ( .V
W
) is ±0.5 l/min.Finally, the value of the uncertainty of the convection heat transfer coefficient is equal to:
Whi = ±1.28 W/ m2.K
The uncertainty analysis of the pressure drop
Since the pressure drop is a function of:
∆Pcond = ∆Pcond (Pga, Pb,
.
V
)Then the error depends on the accuracy of previously mentioned measuring variables. So the uncertainty of the pressure drop coefficient can be calculated as follows:
corr = 0.9406
exp
R2 = 0.8505
0 0.02 0.04 0.06 0.08 0.1
0 0.02 0.04 0.06 0.08 0.1 Experimental dimensionless pressure drop (∆Pcond/Pin, cond) exp
P re d ic te d d im en si o n le ss p re ss u re d ro p ( ∆ Pco n d /Pin , co n d ) co rr
exp corr = 1.0081
R2 = 0.985 0 1 2 3 4 5 6 7 8
0 1 2 3 4 5 6 7 8
Experimental average Nusselt number
cond
P
W
∆ = 21/2. 2
2
(
)
(
)
]
)
[(
.V cond P
b cond P
ga
cond
W
V
P
W
P
P
W
P
P
b ga
∂
∆
∂
+
∂
∆
∂
+
∂
∆
∂
(39)
The relationship between the pressure drop of carbon dioxide during condensation and the measured parameters can be obtained as follows:
ga cond
P
P
∂
∆
∂
= 2.0,
b cond
P
P
∂
∆
∂
= 2.5 * 10-8,
.
V
P
cond∂
∆
∂
= 0.10995Finally, the value of the uncertainty of the pressure drop is equal to:
cond
P
W
∆ =±
1.0 kPaTable 2. Correlations resulted by this work.
Specific CO2 correlations
General correlations Process
Nu = 2.56 * 10(-5) * [ (Re
D)1.27 (Pr )4.37 (Ga)-0.11 (Ja)-1.24 (
i
D
L
) -0.72 (Eu) 0.21]a) Convection heat transfer coefficient
Nu = C (Re,D)a (Pr)b (Ga)c (Ja)d (
i
D
L
)e (Eu)f
Condensation
cond in
cond
P P
,
∆ = 1.56 * [(
D
Eu
Re
1
1
∗
) 0.27 (i
D
L
) 0.14]b) Pressure drop
con in
cond
P P
,
∆ = C (
Re
1
1
∗
Eu
)h
(
i
D
L
) i
Nu = 34.92 * [(ReD)-0.31 (Pr)-0.39 (Ga) 0.11 (Ja)-0.71 (We) 0.81(
i
D
L
) -0.82 (Eu) 0.2] c) Convection heat transfer coefficient
Nu = C (Re,D)j (Pr)k (Ga)l (Ja)m (We)n (
i
D
L
)p (Eu)qEvaporation
Conclusions
The following conclusions resulted from this work:
1- For the condensation process, two empirical correlations were developed for the carbon dioxide pressure drop and convective heat transfer coefficient. These correlations were proved to be highly accurate for pressure drops with the bias error = 5.25% and ASD = 17.94%, while for convective heat transfer coefficients, with bias error = 0.4% and ASD = 4.62%.
2- For the evaporation process, an empirical correlation was developed for the carbon dioxide convective heat transfer coefficient. This correlation was proved to be highly accurate for convective heat transfer coefficients with bias error = 3.8% and ASD = 4.14%.
3- All resulted correlations obtained in this work are listed in Table 2.
4- The study covered flow of Reynolds number (ReD) ranging between 2000 and 15000.
References
Abu-Dhem, F.M., 2006, "Modeling Simulation and Experimental Study of the Heat Transfer Characteristic of Subcritical Carbon Dioxide during Condensation and Evaporation Processes in Refrigeration Systems", Ph.D Thesis, University of Jordan, Amman, Jordan.
Alshqirate, A.S., 2008, "Characteristic Study of Carbon Dioxide (CO2)
During Condensation and Evaporation inside Micropipes when used as Refrigerant", Ph.D Thesis, University of Jordan, Amman, Jordan.
Chapra, S.C. and Canale, R.P., 1998, "Numerical Methods for Engineers", 3ed edition, McGraw-Hill, Singapore.
Choi, K., Pamitran, A.S. and Oh, J.T., 2007, "Two-phase flow heat transfer of CO2 vaporization in smooth horizontal mini channels",
International Journal of Refrigeration, Vol. 30, pp. 767-777.
Incropera, F.P. and Dewitt, D.P., 2002, "Fundamentals of heat and mass transfer", 5th edition, John Wiley and Sons.
Jiang, P.-X., Xu, Y., Lv, J., Shi, R., He, S. and Jackson, J.D., 2004, "Experimental investigation of convection heat transfer of CO2 at
super-critical pressures in vertical mini-tubes and in porous media", Applied Thermal Engineering, Vol. 24, pp. 1255-1270.
Jokar, A., Hosni, M.H. and Eckels, S.J., 2006, "Dimensional analysis on the evaporation and condensation of refrigerant R-134a in minichannel plate heat exchangers", Applied Thermal Engineering, Vol. 26, pp. 2287-2300.
Kim, M., Pettersen, J. and Bullard, C.W., 2004, "Fundamental process and system design issues in CO2 vapor compression systems", Progress in
Energy and Combustion Science, Vol. 30, pp. 119-174.
Liao, S.M. and Zhao, T.S., 2002, "An experimental investigation of convection heat transfer to supercritical carbon dioxide in miniature tubes",
International Journal of Heat and Mass Transfer, Vol. 45, pp. 5025-5034. Oosthuizen, P.H. and Naylor, D., 1999, "An introduction to convective heat transfer analysis", McGraw-Hill, Singapore.
Park, C.Y. and Hrnjak, P.S., 2007, "CO2 and R410A flow boiling heat
transfer, pressure drop, and flow pattern at low temperatures in a horizontal smooth tube", International Journal of Refrigeration, Vol. 30, pp. 166-178.